Several factors contribute to cancer rates, from personal habits and genetics to air pollution or groundwater quality in a given area. People experiencing social, economic, or environmental disadvantages are disproportionately affected by high cancer rates in certain regions—including access or barriers to early screening and care.
Cancer rates also fluctuate by jobs: Higher rates of cancer can be found among meat industry and rubber manufacturing workers, and farmers.
Stacker compiled the counties with the highest cancer rates in Alabama using data from the CDC. Keep reading to see where in your state cancer cases are the most common.
You may also like: Breweries with the most highly ranked beers in Alabama
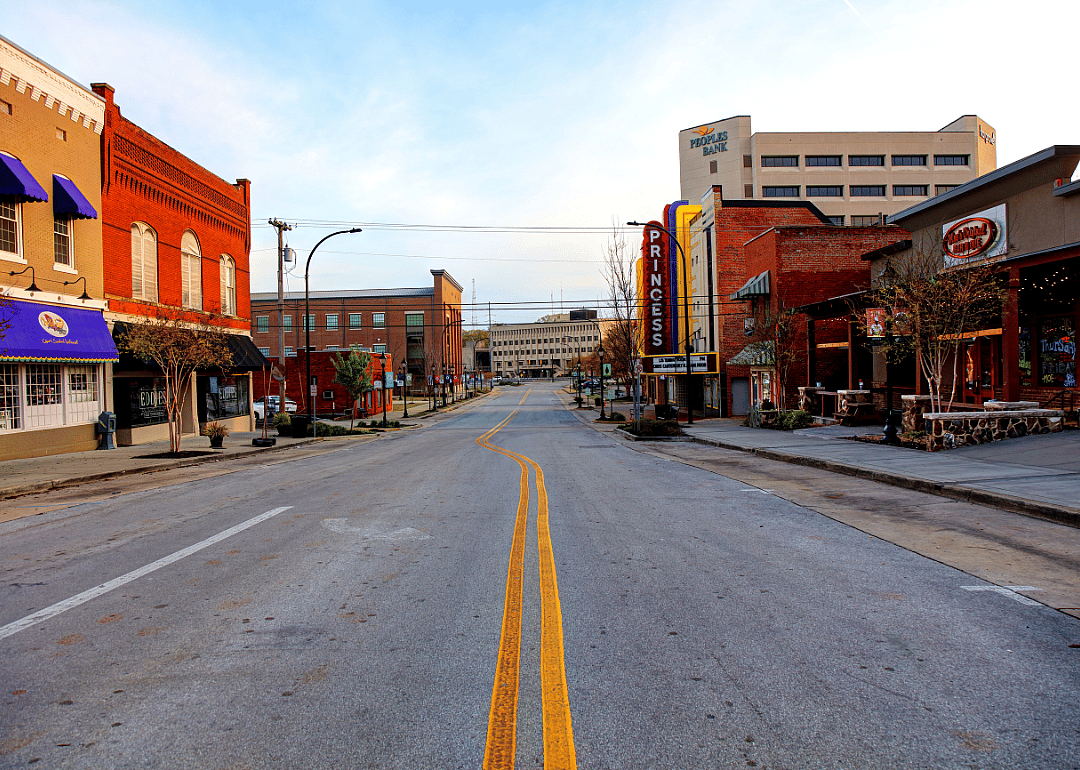
#50. Houston County
- Cancer rate per 100,000, 2016-2020: 561.2
- Age-adjusted rate per 100,000, 2016-2020: 433.4
JNix // Shutterstock
2 / 50#49. Blount County
- Cancer rate per 100,000, 2016-2020: 563.4
- Age-adjusted rate per 100,000, 2016-2020: 428.1
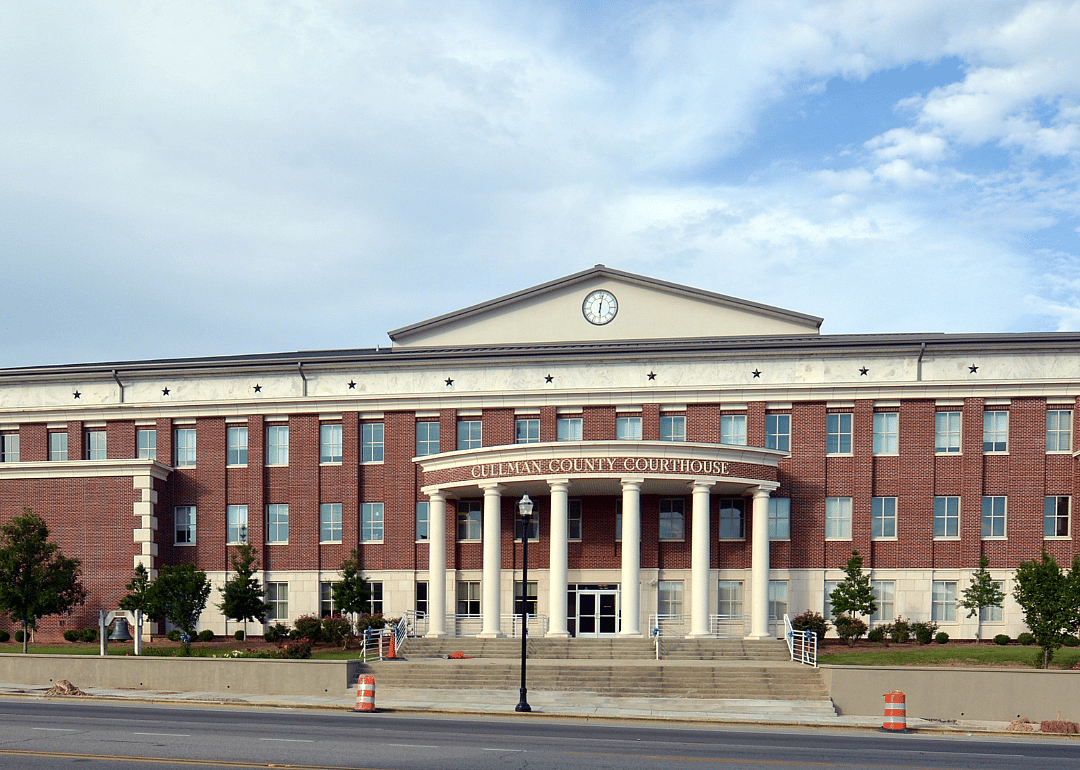
#48. Cullman County
- Cancer rate per 100,000, 2016-2020: 563.9
- Age-adjusted rate per 100,000, 2016-2020: 428.2
Wayne James // Shutterstock
4 / 50#47. Lauderdale County
- Cancer rate per 100,000, 2016-2020: 565.3
- Age-adjusted rate per 100,000, 2016-2020: 415.1
JNix // Shutterstock
6 / 50#45. Washington County
- Cancer rate per 100,000, 2016-2020: 571.7
- Age-adjusted rate per 100,000, 2016-2020: 416.9
#44. Sumter County
- Cancer rate per 100,000, 2016-2020: 576.4
- Age-adjusted rate per 100,000, 2016-2020: 460.2
#43. Bullock County
- Cancer rate per 100,000, 2016-2020: 578.0
- Age-adjusted rate per 100,000, 2016-2020: 464.4
Riley Camp // Shutterstock
9 / 50#42. St. Clair County
- Cancer rate per 100,000, 2016-2020: 579.1
- Age-adjusted rate per 100,000, 2016-2020: 456.2
#40. Perry County
- Cancer rate per 100,000, 2016-2020: 584.4
- Age-adjusted rate per 100,000, 2016-2020: 446.7
Leah G Moloney // Shutterstock
12 / 50#39. Hale County
- Cancer rate per 100,000, 2016-2020: 587.0
- Age-adjusted rate per 100,000, 2016-2020: 419.8
JNix // Shutterstock
13 / 50#38. Autauga County
- Cancer rate per 100,000, 2016-2020: 587.4
- Age-adjusted rate per 100,000, 2016-2020: 487.9
#37. Bibb County
- Cancer rate per 100,000, 2016-2020: 590.0
- Age-adjusted rate per 100,000, 2016-2020: 471.0
Shackleford Photography // Shutterstock
15 / 50#35. Marengo County
- Cancer rate per 100,000, 2016-2020: 601.9
- Age-adjusted rate per 100,000, 2016-2020: 441.3
JNix // Shutterstock
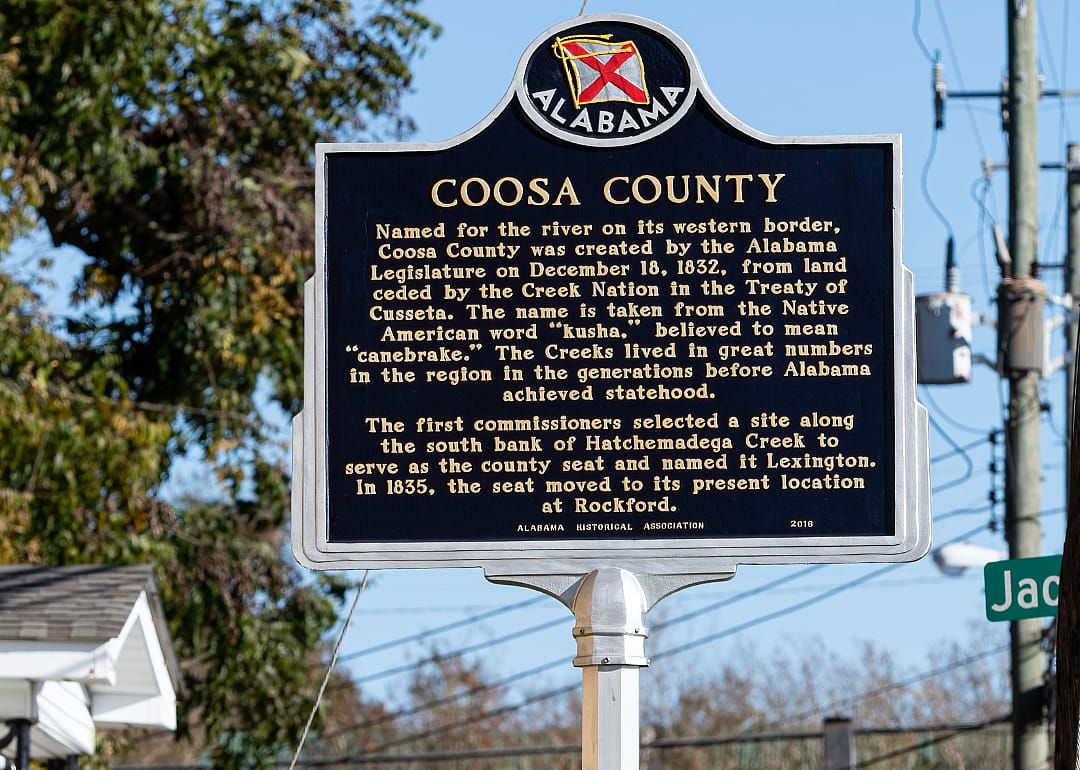
17 / 50#34. Coosa County
- Cancer rate per 100,000, 2016-2020: 602.1
- Age-adjusted rate per 100,000, 2016-2020: 390.2
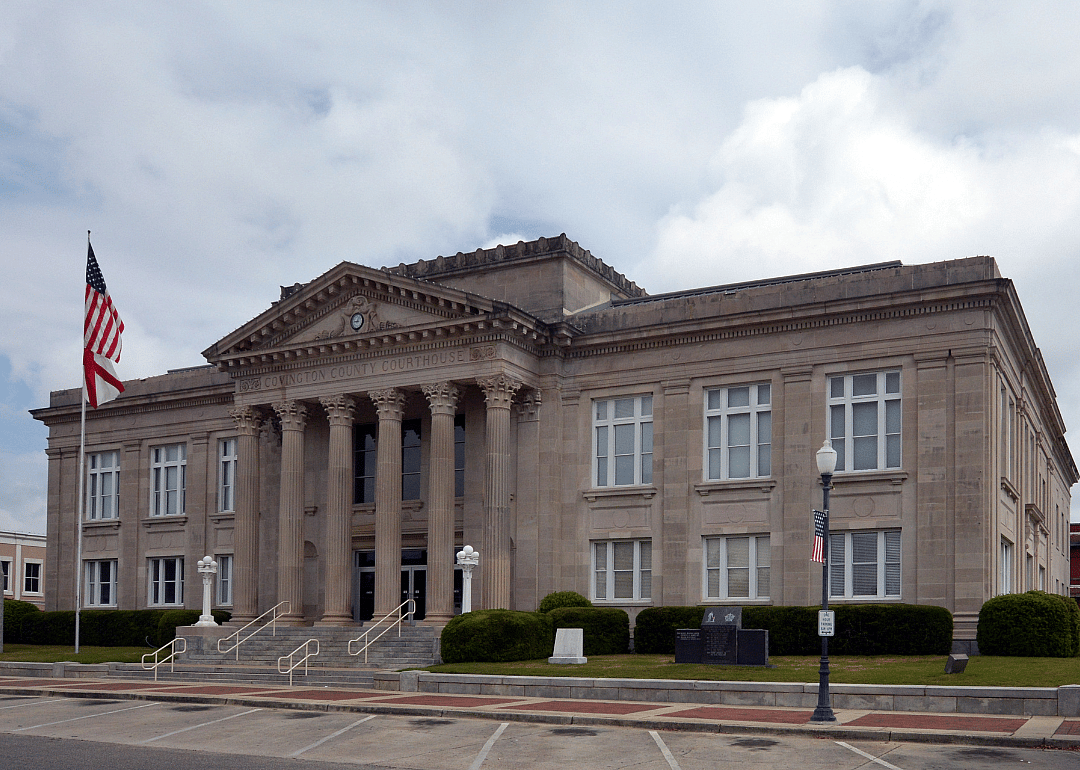
#33. Covington County
- Cancer rate per 100,000, 2016-2020: 604.9
- Age-adjusted rate per 100,000, 2016-2020: 416.8
Thomas Burks // Shutterstock
19 / 50#32. Randolph County
- Cancer rate per 100,000, 2016-2020: 607.1
- Age-adjusted rate per 100,000, 2016-2020: 419.6
#30. Dallas County
- Cancer rate per 100,000, 2016-2020: 611.8
- Age-adjusted rate per 100,000, 2016-2020: 468.8
#29. Morgan County
- Cancer rate per 100,000, 2016-2020: 611.8
- Age-adjusted rate per 100,000, 2016-2020: 476.5
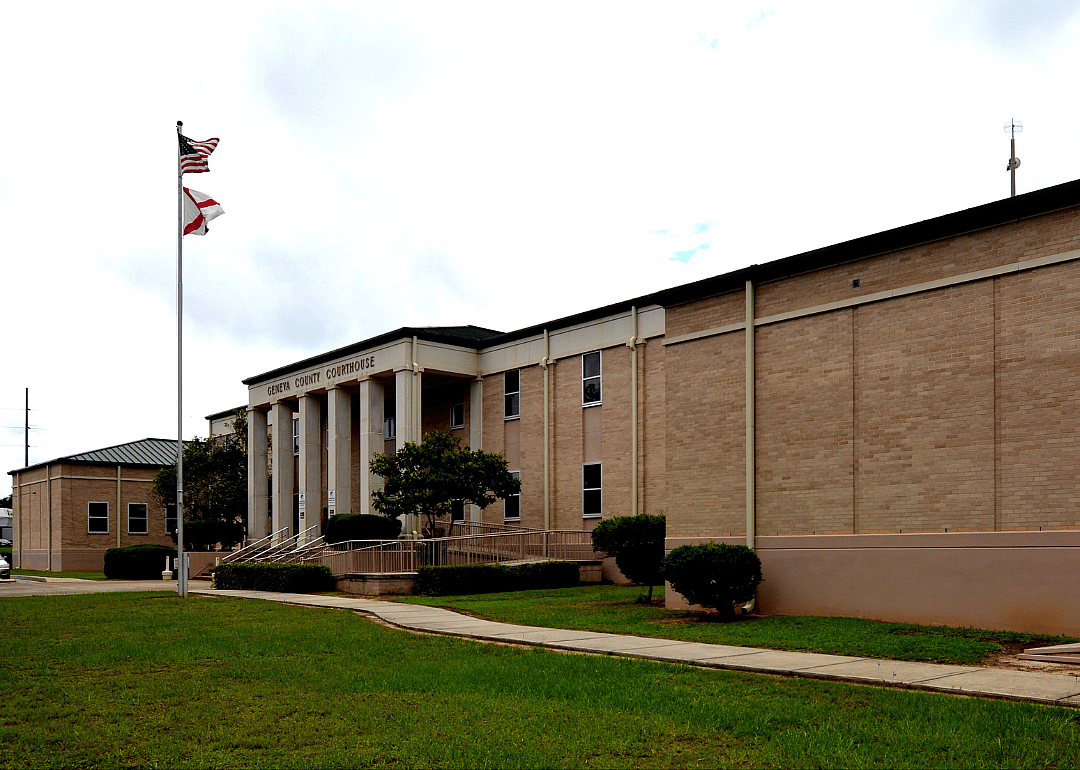
#28. Geneva County
- Cancer rate per 100,000, 2016-2020: 612.5
- Age-adjusted rate per 100,000, 2016-2020: 430.1
#27. Elmore County
- Cancer rate per 100,000, 2016-2020: 614.5
- Age-adjusted rate per 100,000, 2016-2020: 507.2
EWY Media // Shutterstock
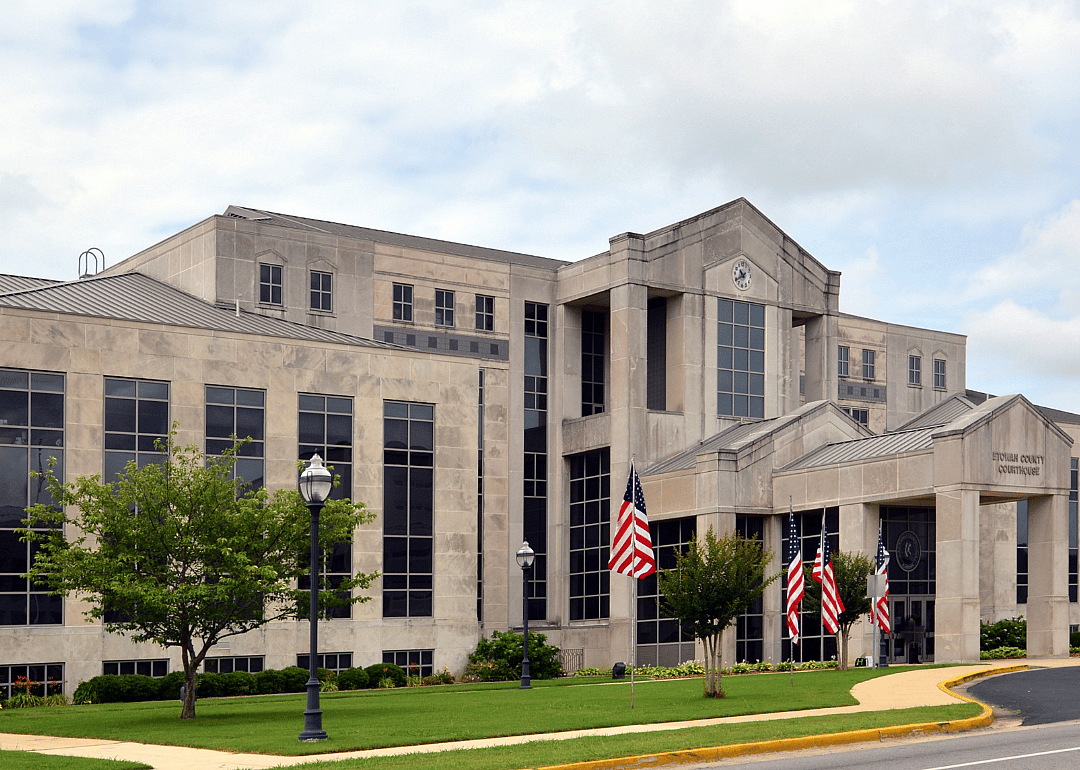
25 / 50#25. Etowah County
- Cancer rate per 100,000, 2016-2020: 618.6
- Age-adjusted rate per 100,000, 2016-2020: 457.1
JNix // Shutterstock
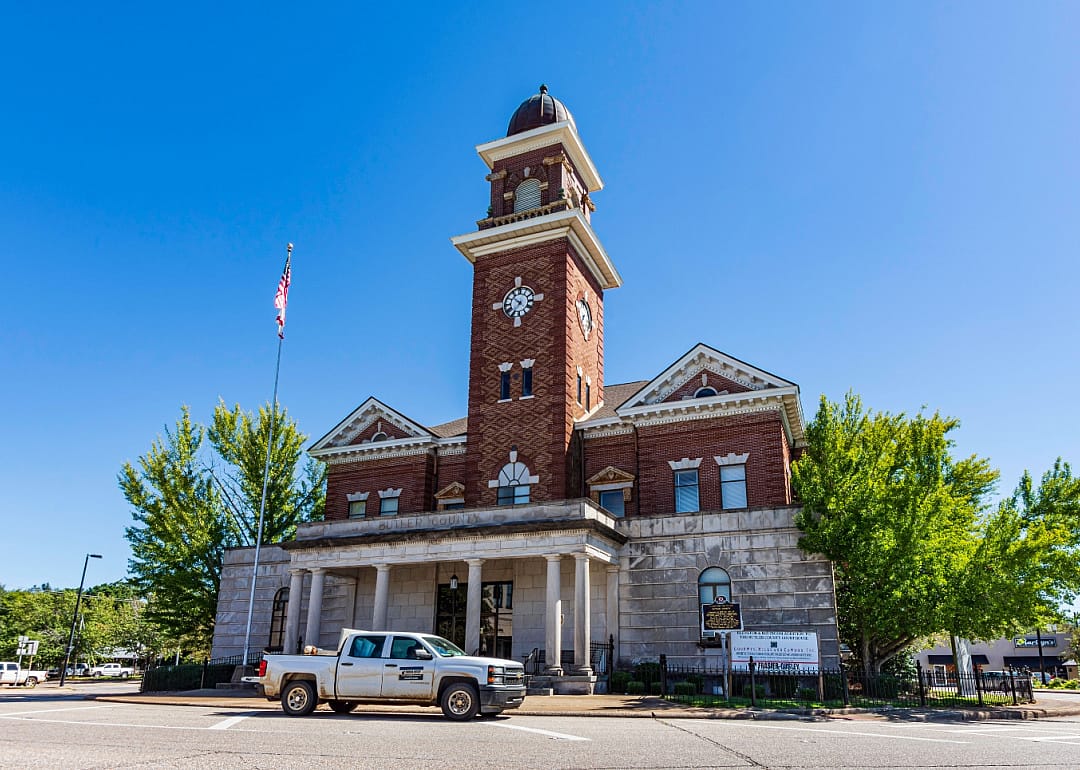
27 / 50#24. Butler County
- Cancer rate per 100,000, 2016-2020: 624.6
- Age-adjusted rate per 100,000, 2016-2020: 453.4
Mccallk69 // Shutterstock
28 / 50#23. Macon County
- Cancer rate per 100,000, 2016-2020: 625.9
- Age-adjusted rate per 100,000, 2016-2020: 456.2
Carl Banks Photography // Shutterstock
29 / 50#22. Jackson County
- Cancer rate per 100,000, 2016-2020: 626.3
- Age-adjusted rate per 100,000, 2016-2020: 438.7
Jennifer Kinkead McNutt // Shutterstock
30 / 50JNix // Shutterstock
31 / 50#20. Barbour County
- Cancer rate per 100,000, 2016-2020: 628.9
- Age-adjusted rate per 100,000, 2016-2020: 450.2
#19. Winston County
- Cancer rate per 100,000, 2016-2020: 630.9
- Age-adjusted rate per 100,000, 2016-2020: 419.4
#18. Conecuh County
- Cancer rate per 100,000, 2016-2020: 631.8
- Age-adjusted rate per 100,000, 2016-2020: 411.7
George Dodd III // Shutterstock
34 / 50#17. Baldwin County
- Cancer rate per 100,000, 2016-2020: 634.1
- Age-adjusted rate per 100,000, 2016-2020: 444.8
Wayne James // Shutterstock
36 / 50#15. Colbert County
- Cancer rate per 100,000, 2016-2020: 643.8
- Age-adjusted rate per 100,000, 2016-2020: 460.4
#14. Fayette County
- Cancer rate per 100,000, 2016-2020: 644.9
- Age-adjusted rate per 100,000, 2016-2020: 442.7
#13. Choctaw County
- Cancer rate per 100,000, 2016-2020: 646.0
- Age-adjusted rate per 100,000, 2016-2020: 409.7
JNix // Shutterstock
39 / 50#12. Chambers County
- Cancer rate per 100,000, 2016-2020: 651.0
- Age-adjusted rate per 100,000, 2016-2020: 466.2
#10. Wilcox County
- Cancer rate per 100,000, 2016-2020: 661.5
- Age-adjusted rate per 100,000, 2016-2020: 476.2
JNix // Shutterstock
42 / 50#9. Pickens County
- Cancer rate per 100,000, 2016-2020: 662.4
- Age-adjusted rate per 100,000, 2016-2020: 491.2
#8. Clarke County
- Cancer rate per 100,000, 2016-2020: 663.7
- Age-adjusted rate per 100,000, 2016-2020: 476.9
#7. Henry County
- Cancer rate per 100,000, 2016-2020: 682.1
- Age-adjusted rate per 100,000, 2016-2020: 446.8
JNix // Shutterstock
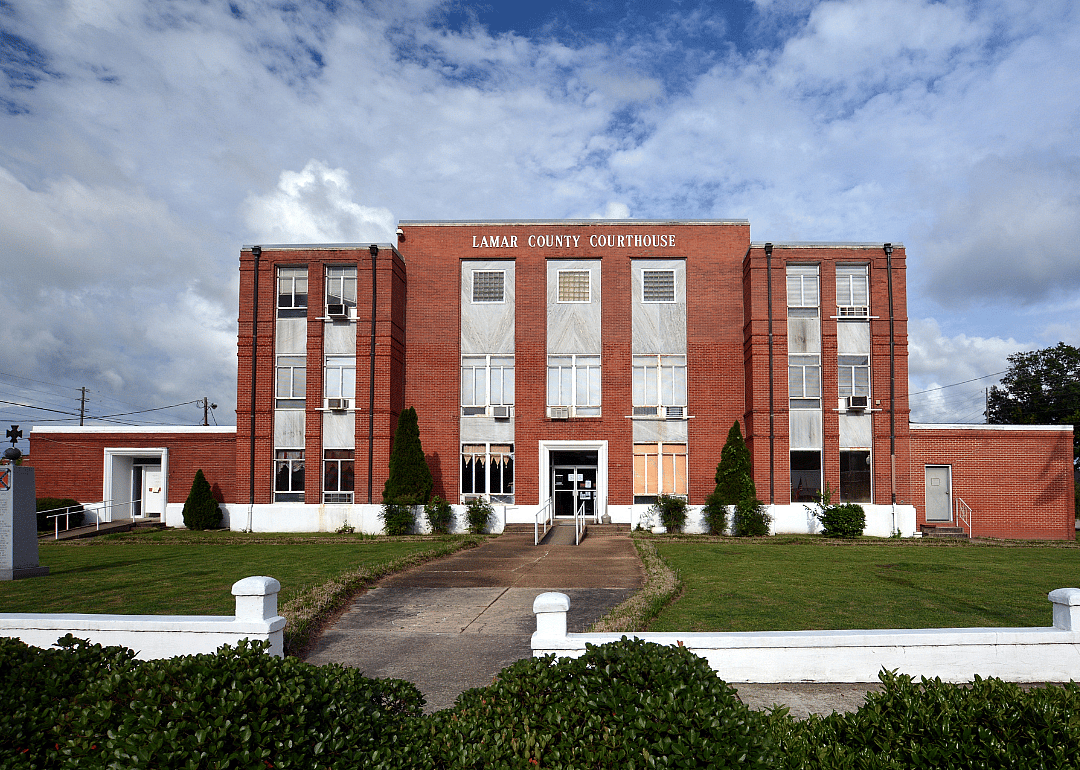
45 / 50#5. Lamar County
- Cancer rate per 100,000, 2016-2020: 701.6
- Age-adjusted rate per 100,000, 2016-2020: 482.0
#4. Walker County
- Cancer rate per 100,000, 2016-2020: 711.6
- Age-adjusted rate per 100,000, 2016-2020: 519.6
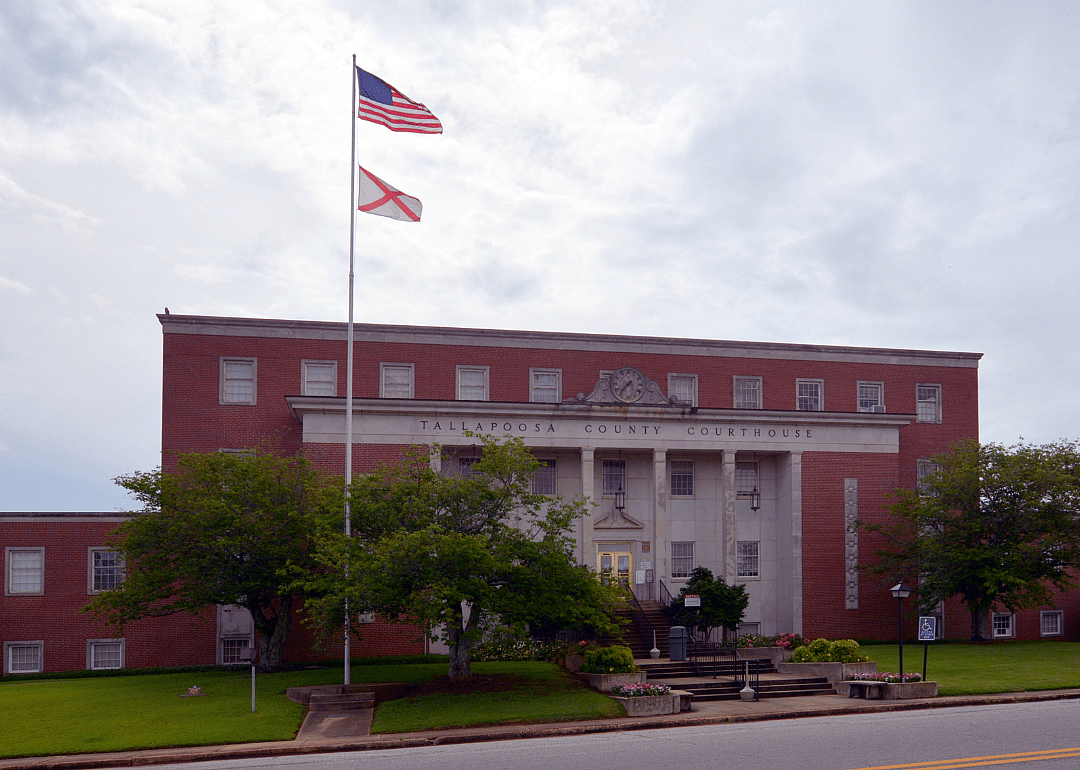
#3. Tallapoosa County
- Cancer rate per 100,000, 2016-2020: 728.8
- Age-adjusted rate per 100,000, 2016-2020: 493.5
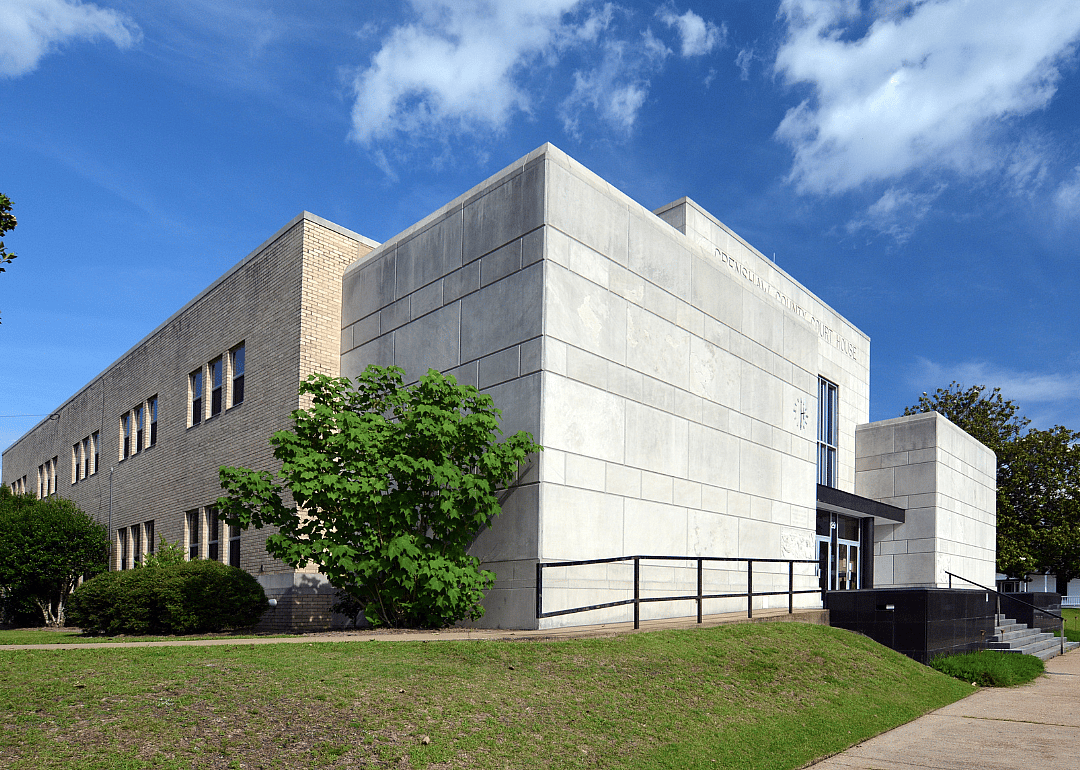
#2. Crenshaw County
- Cancer rate per 100,000, 2016-2020: 739.2
- Age-adjusted rate per 100,000, 2016-2020: 545.8
Carolyn May Wright // Shutterstock
50 / 50