Counties with the best commutes in Arizona

·Stacker

Canetti // Shutterstock

Stacker compiled a list of the counties with the best commutes in Arizona using data from the U.S. Census Bureau. Counties are ranked by the shortest average travel time to work, with ties broken by lowest percent of residents that commute over 60 minutes, and any further ties broken by lowest percent of residents that work outside the county of residence.

You may also like: How gas prices have changed in Arizona in the last week

#15. Pinal County

Canva

1 / 15

#15. Pinal County

- Mean travel time to work: 32.3
- Workers with 60+ minute commute: 13.9%
- Worked outside of county of residence: 45.4%
#14. Apache County

Canva

2 / 15

#14. Apache County

- Mean travel time to work: 27.6
- Workers with 60+ minute commute: 14.2%
- Worked outside of county of residence: 11.6%
#13. Maricopa County

Sean Pavone // Shutterstock

3 / 15

#13. Maricopa County

- Mean travel time to work: 26.4
- Workers with 60+ minute commute: 7.0%
- Worked outside of county of residence: 1.0%
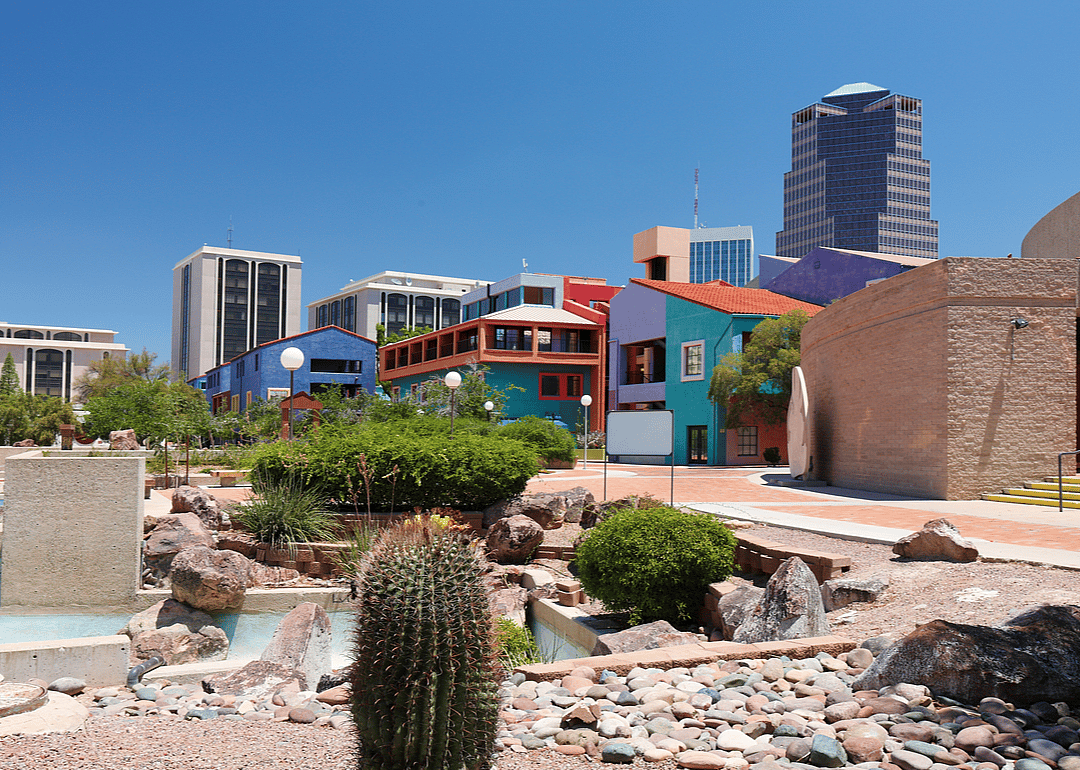
#12. Pima County

Jay Yuan // Shutterstock

4 / 15

#12. Pima County

- Mean travel time to work: 24.6
- Workers with 60+ minute commute: 4.2%
- Worked outside of county of residence: 1.9%
#11. Yavapai County

Canva

5 / 15

#11. Yavapai County

- Mean travel time to work: 23.5
- Workers with 60+ minute commute: 7.2%
- Worked outside of county of residence: 7.0%

You may also like: Most expensive homes for sale in Arizona
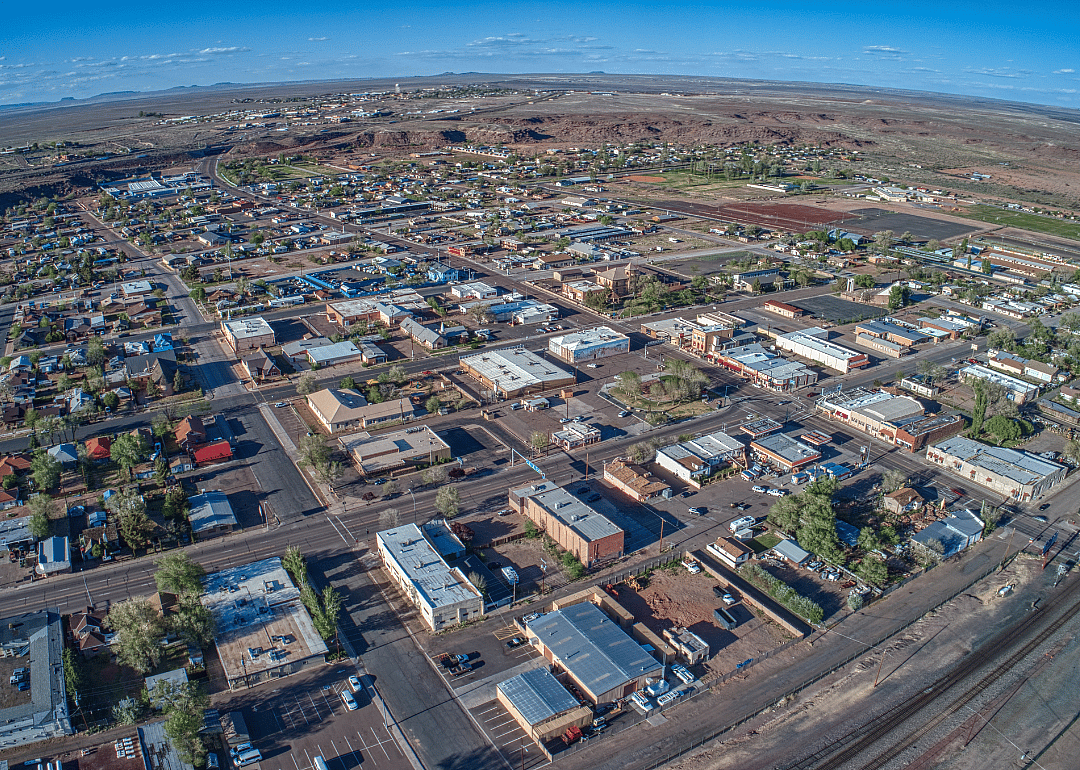
#10. Navajo County

Canva

6 / 15

#10. Navajo County

- Mean travel time to work: 22.9
- Workers with 60+ minute commute: 8.7%
- Worked outside of county of residence: 9.4%
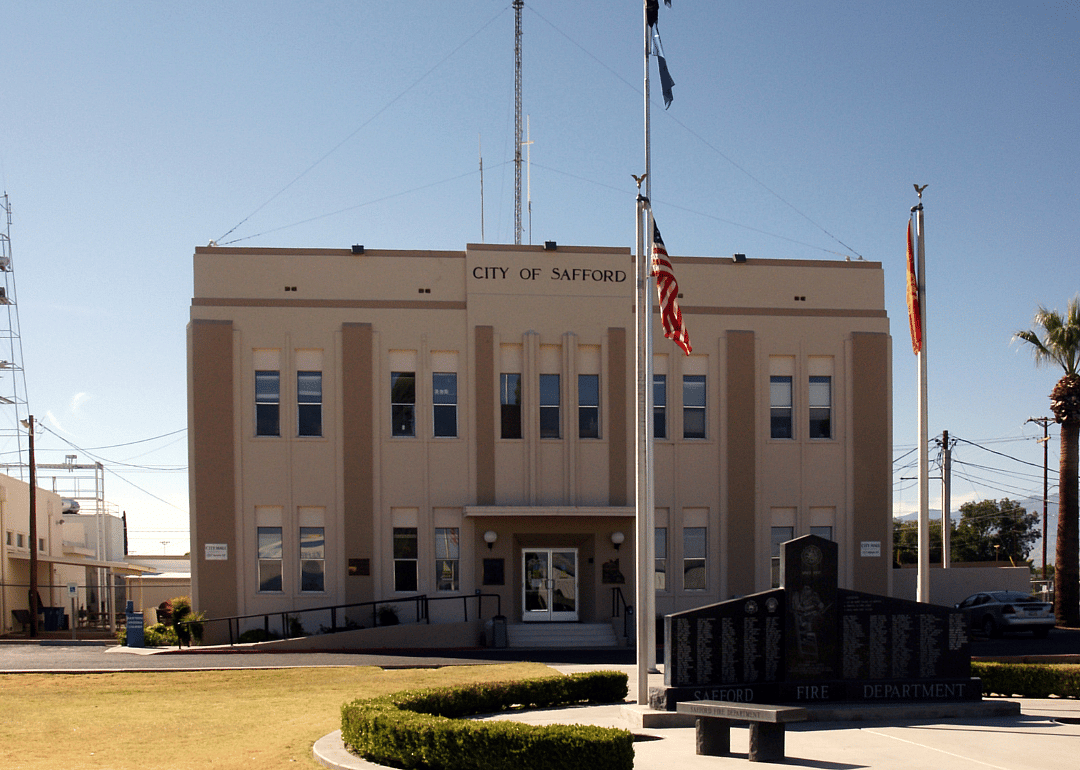
#9. Graham County

Canva

7 / 15

#9. Graham County

- Mean travel time to work: 22.8
- Workers with 60+ minute commute: 12.2%
- Worked outside of county of residence: 16.8%
#8. Santa Cruz County

Canva

8 / 15

#8. Santa Cruz County

- Mean travel time to work: 22.5
- Workers with 60+ minute commute: 9.7%
- Worked outside of county of residence: 15.2%
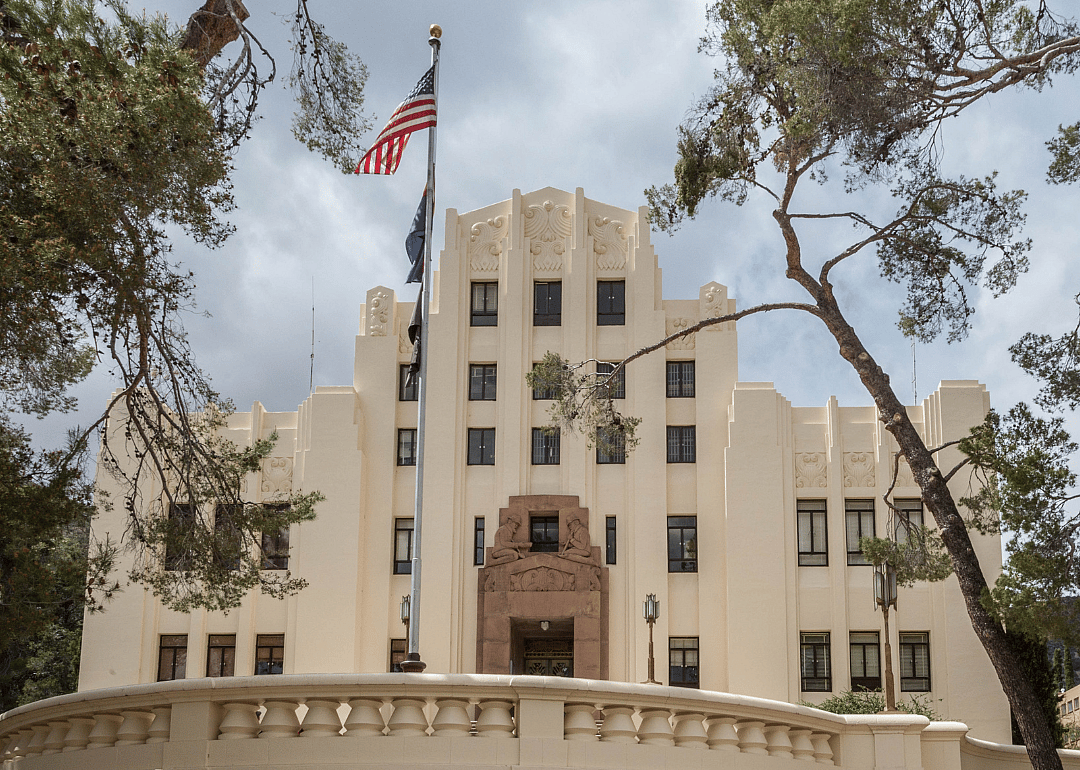
#7. Cochise County

Canva

9 / 15

#7. Cochise County

- Mean travel time to work: 21.8
- Workers with 60+ minute commute: 7.5%
- Worked outside of county of residence: 6.5%
#5. Yuma County

Canva

11 / 15

#5. Yuma County

- Mean travel time to work: 20.9
- Workers with 60+ minute commute: 5.0%
- Worked outside of county of residence: 1.0%
#4. Gila County

Canva

12 / 15

#4. Gila County

- Mean travel time to work: 20.2
- Workers with 60+ minute commute: 8.7%
- Worked outside of county of residence: 16.6%
#3. Coconino County

HildaWeges Photography // Shutterstock

13 / 15
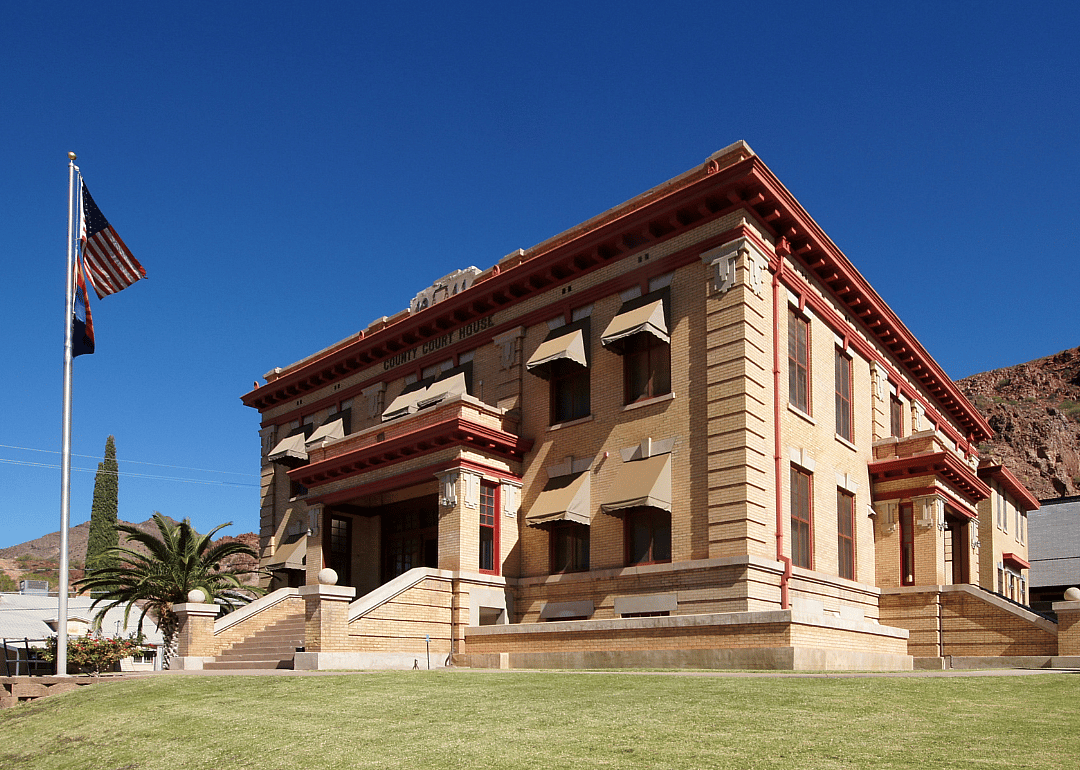
#3. Coconino County

- Mean travel time to work: 19.1
- Workers with 60+ minute commute: 5.5%
- Worked outside of county of residence: 5.1%
#2. Greenlee County

Canva

14 / 15

#2. Greenlee County

- Mean travel time to work: 17.7
- Workers with 60+ minute commute: 2.1%
- Worked outside of county of residence: 4.2%