Rain, sleet, snow, hail, wintry mix. Precipitation takes on many forms, and the degree to which climate change affects precipitation levels comes down to something almost everyone learns about in school—Earth's water cycle. A system in endless motion, the water cycle traces the process through which water exists in its three primary phases—liquid, solid, and gas—as it moves perpetually between the Earth and its atmosphere.
Increases in precipitation frequency and intensity are markers of climate change. When temperatures rise and oceans grow warmer, the amount of water that evaporates into the atmosphere—and the speed at which it does so—also increases. As atmospheric circulation carries the moisture-rich air over land or pushes it into a storm system, heavy rain or snow is often the result.
The continental U.S. on average received about 30 inches of precipitation between March 2022 and February 2023. Traditionally "wet" regions—such as Washington state and Alaska in the northwest and Georgia and Mississippi in the southeast—continue to have some of the rainiest counties in the United States. Other areas such as Oklahoma, Kansas, and Nebraska, as well as pockets of the South and of California, experience the opposite extreme: drought, also largely a product of climate change.
Stacker cited data from the National Centers for Environmental Information to identify the counties in Idaho that receive the most precipitation through rain, sleet, or snow. Counties are ranked by five-year precipitation averages in inches as of February 2023 with rainfall over the past year serving as a tiebreaker. Supplementary data on how last year's precipitation compares to the 100-year average for the area is also included.
You may also like: Hottest Novembers in Idaho since 1895
#44. Jerome County
- Five-year precipitation average: 8.05 inches
- Precipitation over the past year: 7.17 inches (#16 rainiest year since 1895)
- Precipitation compared to 1901-2000 average: -2.56 inches below norm
#43. Lincoln County
- Five-year precipitation average: 8.30 inches
- Precipitation over the past year: 8.24 inches (#25 rainiest year since 1895)
- Precipitation compared to 1901-2000 average: -2.29 inches below norm
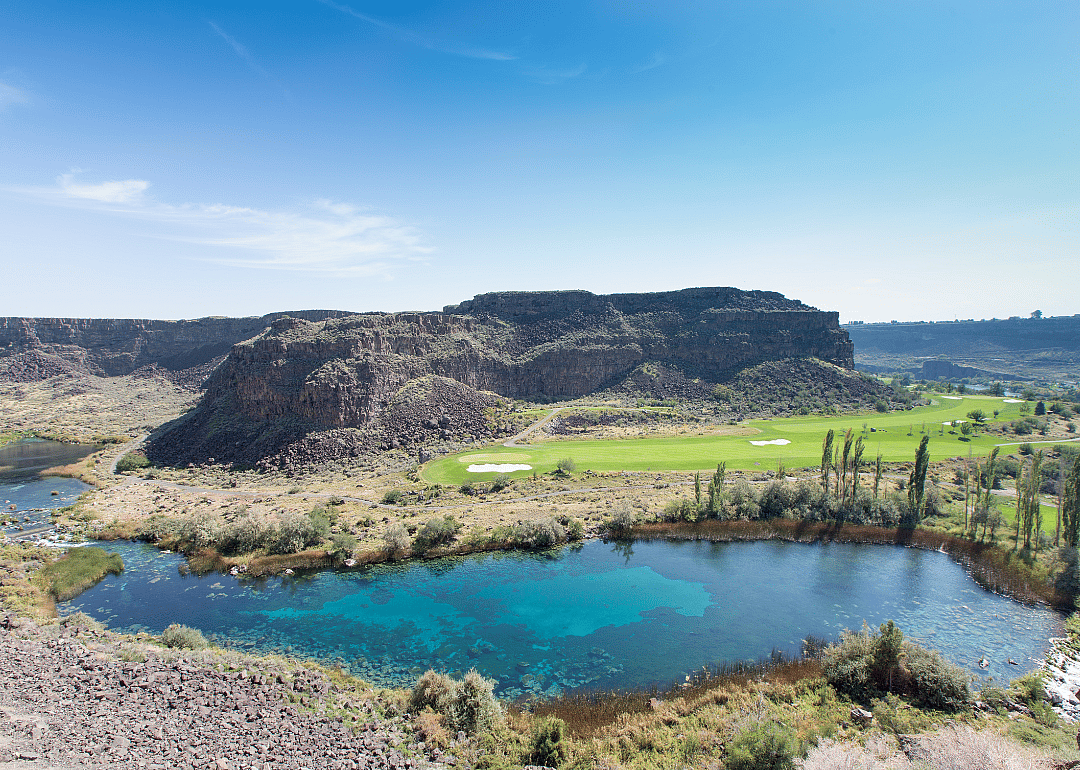
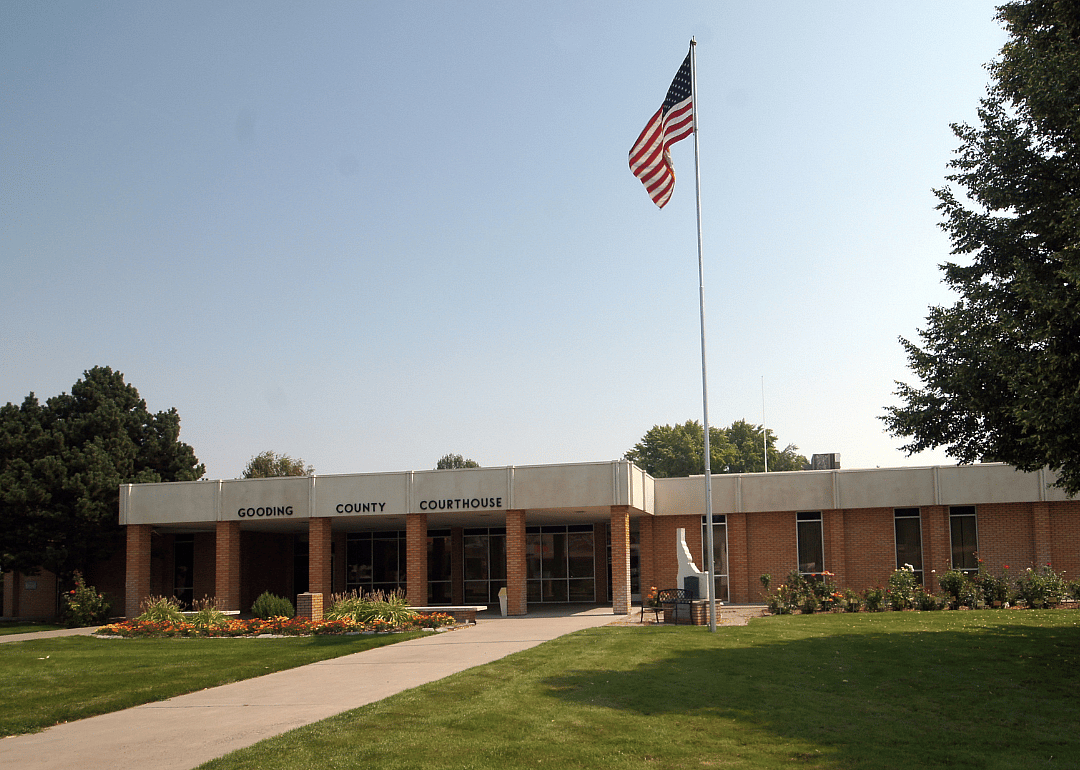
#42. Gooding County
- Five-year precipitation average: 8.88 inches
- Precipitation over the past year: 8.38 inches (#23 rainiest year since 1895)
- Precipitation compared to 1901-2000 average: -2.80 inches below norm
#41. Minidoka County
- Five-year precipitation average: 8.92 inches
- Precipitation over the past year: 8.82 inches (#52 rainiest year since 1895)
- Precipitation compared to 1901-2000 average: -0.91 inches below norm
B Brown // Shutterstock
5 / 44#40. Jefferson County
- Five-year precipitation average: 9.01 inches
- Precipitation over the past year: 8.49 inches (#51 rainiest year since 1895)
- Precipitation compared to 1901-2000 average: -1.20 inches below norm
You may also like: Counties with the oldest homes in Idaho
#39. Canyon County
- Five-year precipitation average: 9.64 inches
- Precipitation over the past year: 9.69 inches (#68 rainiest year since 1895)
- Precipitation compared to 1901-2000 average: 0.14 inches above norm
#38. Twin Falls County
- Five-year precipitation average: 10.76 inches
- Precipitation over the past year: 10.03 inches (#26 rainiest year since 1895)
- Precipitation compared to 1901-2000 average: -2.50 inches below norm
#37. Owyhee County
- Five-year precipitation average: 11.59 inches
- Precipitation over the past year: 11.33 inches (#46 rainiest year since 1895)
- Precipitation compared to 1901-2000 average: -1.24 inches below norm
davidrh // Shutterstock
9 / 44#36. Butte County
- Five-year precipitation average: 11.82 inches
- Precipitation over the past year: 12.86 inches (#65 rainiest year since 1895)
- Precipitation compared to 1901-2000 average: -0.72 inches below norm
Charles Knowles // Shutterstock
10 / 44#35. Ada County
- Five-year precipitation average: 12.21 inches
- Precipitation over the past year: 12.20 inches (#67 rainiest year since 1895)
- Precipitation compared to 1901-2000 average: -0.13 inches below norm
You may also like: Biggest exports from Idaho
#34. Payette County
- Five-year precipitation average: 12.25 inches
- Precipitation over the past year: 11.74 inches (#46 rainiest year since 1895)
- Precipitation compared to 1901-2000 average: -1.06 inches below norm
Tucker James // Shutterstock
12 / 44#33. Bingham County
- Five-year precipitation average: 13.26 inches
- Precipitation over the past year: 13.92 inches (#73 rainiest year since 1895)
- Precipitation compared to 1901-2000 average: 0.42 inches above norm
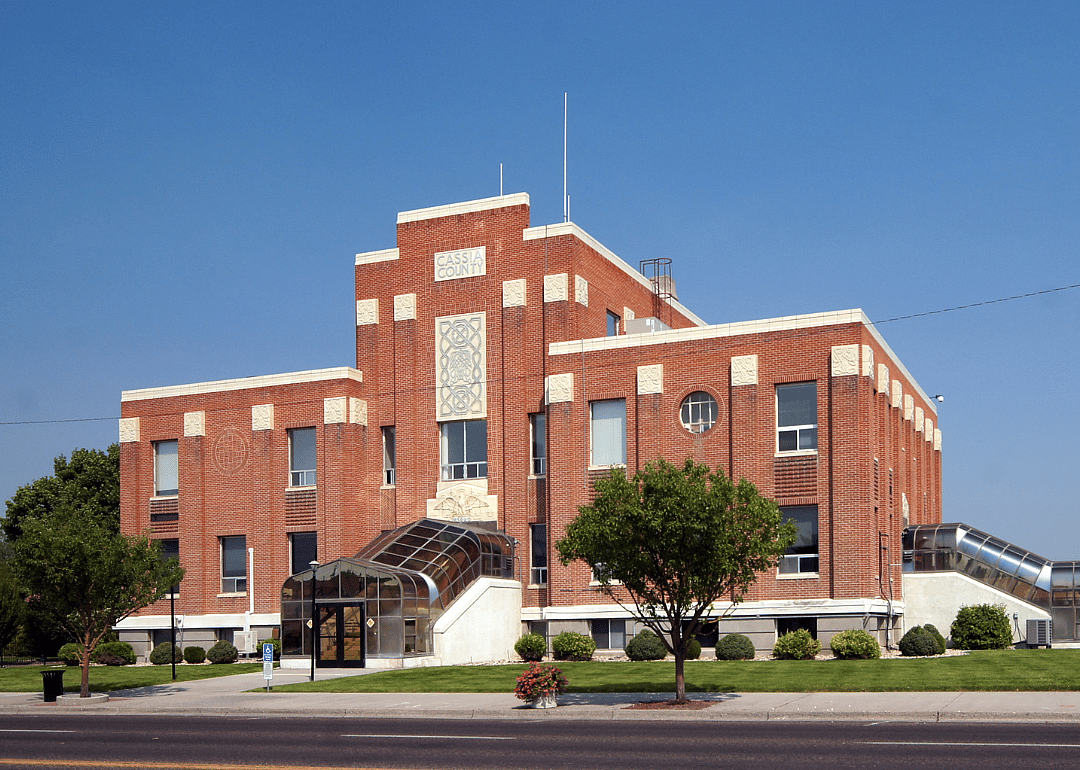
#32. Cassia County
- Five-year precipitation average: 14.88 inches
- Precipitation over the past year: 15.07 inches (#64 rainiest year since 1895)
- Precipitation compared to 1901-2000 average: -0.45 inches below norm
David Gilder // Shutterstock
14 / 44#31. Clark County
- Five-year precipitation average: 15.12 inches
- Precipitation over the past year: 15.57 inches (#54 rainiest year since 1895)
- Precipitation compared to 1901-2000 average: -1.54 inches below norm
#30. Madison County
- Five-year precipitation average: 15.23 inches
- Precipitation over the past year: 13.76 inches (#52 rainiest year since 1895)
- Precipitation compared to 1901-2000 average: -1.07 inches below norm
You may also like: See the most extreme temperatures in Idaho history
#29. Power County
- Five-year precipitation average: 15.61 inches
- Precipitation over the past year: 17.89 inches (#97 rainiest year since 1895)
- Precipitation compared to 1901-2000 average: 1.97 inches above norm
#28. Blaine County
- Five-year precipitation average: 15.91 inches
- Precipitation over the past year: 17.42 inches (#54 rainiest year since 1895)
- Precipitation compared to 1901-2000 average: -1.39 inches below norm
#27. Oneida County
- Five-year precipitation average: 16.18 inches
- Precipitation over the past year: 19.34 inches (#82 rainiest year since 1895)
- Precipitation compared to 1901-2000 average: 0.81 inches above norm
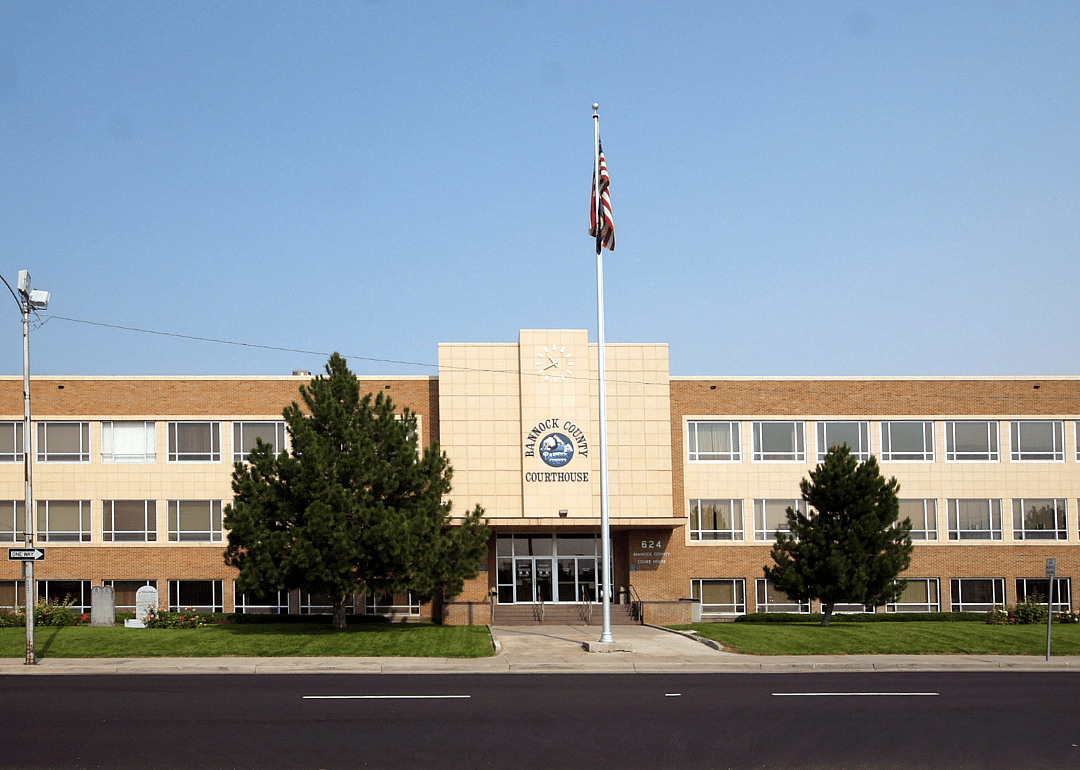
#26. Bannock County
- Five-year precipitation average: 17.30 inches
- Precipitation over the past year: 19.82 inches (#79 rainiest year since 1895)
- Precipitation compared to 1901-2000 average: 0.31 inches above norm
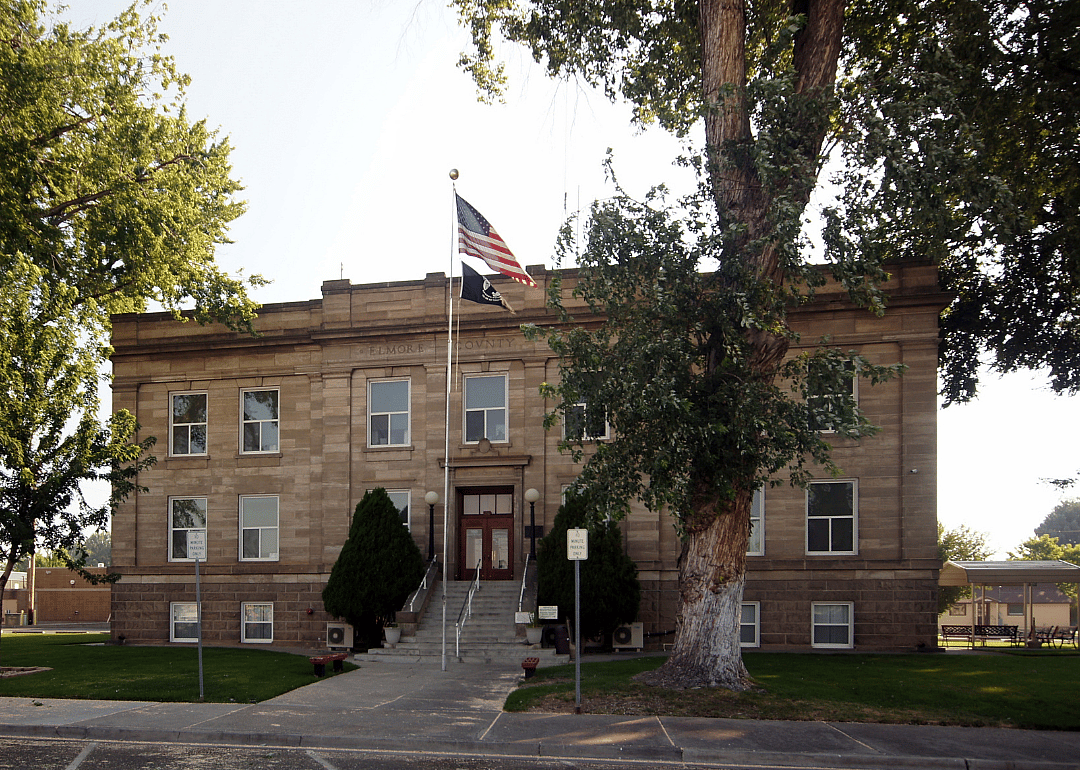
#25. Elmore County
- Five-year precipitation average: 17.97 inches
- Precipitation over the past year: 18.44 inches (#48 rainiest year since 1895)
- Precipitation compared to 1901-2000 average: -1.74 inches below norm
You may also like: See how popular pumpkin spice is in Idaho
MKStyle // Shutterstock
21 / 44#24. Gem County
- Five-year precipitation average: 17.97 inches
- Precipitation over the past year: 18.60 inches (#63 rainiest year since 1895)
- Precipitation compared to 1901-2000 average: -0.20 inches below norm
#23. Lemhi County
- Five-year precipitation average: 18.30 inches
- Precipitation over the past year: 17.92 inches (#30 rainiest year since 1895)
- Precipitation compared to 1901-2000 average: -3.25 inches below norm
#22. Camas County
- Five-year precipitation average: 19.41 inches
- Precipitation over the past year: 19.69 inches (#28 rainiest year since 1895)
- Precipitation compared to 1901-2000 average: -4.71 inches below norm
#21. Washington County
- Five-year precipitation average: 19.43 inches
- Precipitation over the past year: 18.31 inches (#32 rainiest year since 1895)
- Precipitation compared to 1901-2000 average: -2.34 inches below norm
#19. Fremont County
- Five-year precipitation average: 21.07 inches
- Precipitation over the past year: 21.90 inches (#73 rainiest year since 1895)
- Precipitation compared to 1901-2000 average: 0.23 inches above norm
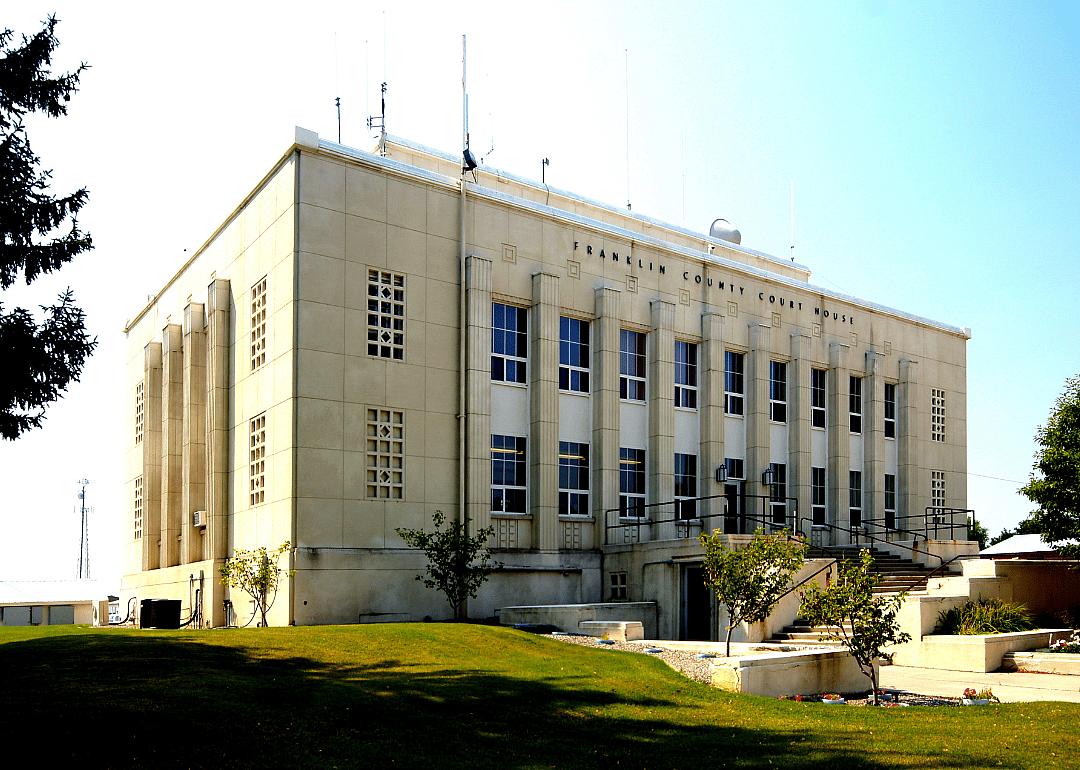
#18. Franklin County
- Five-year precipitation average: 21.23 inches
- Precipitation over the past year: 24.23 inches (#81 rainiest year since 1895)
- Precipitation compared to 1901-2000 average: 1.18 inches above norm
#17. Bear Lake County
- Five-year precipitation average: 21.48 inches
- Precipitation over the past year: 24.14 inches (#96 rainiest year since 1895)
- Precipitation compared to 1901-2000 average: 2.71 inches above norm
#16. Bonneville County
- Five-year precipitation average: 21.55 inches
- Precipitation over the past year: 21.75 inches (#82 rainiest year since 1895)
- Precipitation compared to 1901-2000 average: 1.42 inches above norm
#15. Caribou County
- Five-year precipitation average: 22.18 inches
- Precipitation over the past year: 23.90 inches (#89 rainiest year since 1895)
- Precipitation compared to 1901-2000 average: 1.49 inches above norm
You may also like: Countries to which Idaho exports the most goods
#14. Nez Perce County
- Five-year precipitation average: 22.57 inches
- Precipitation over the past year: 25.48 inches (#107 rainiest year since 1895)
- Precipitation compared to 1901-2000 average: 3.52 inches above norm
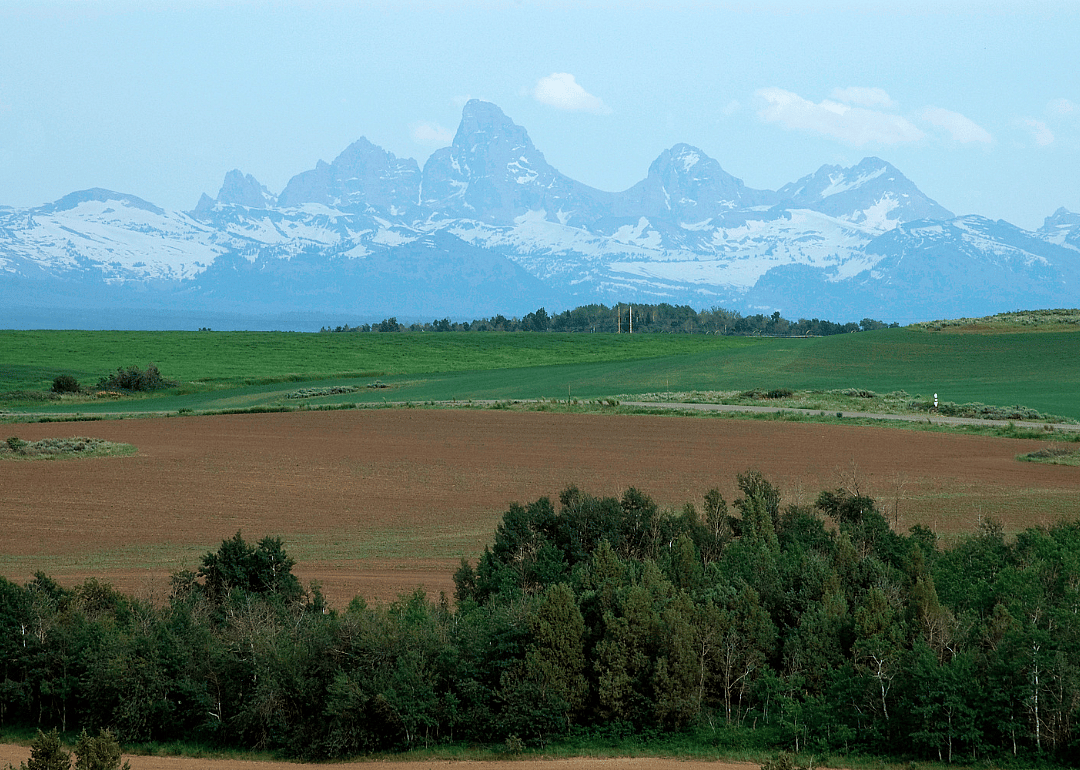
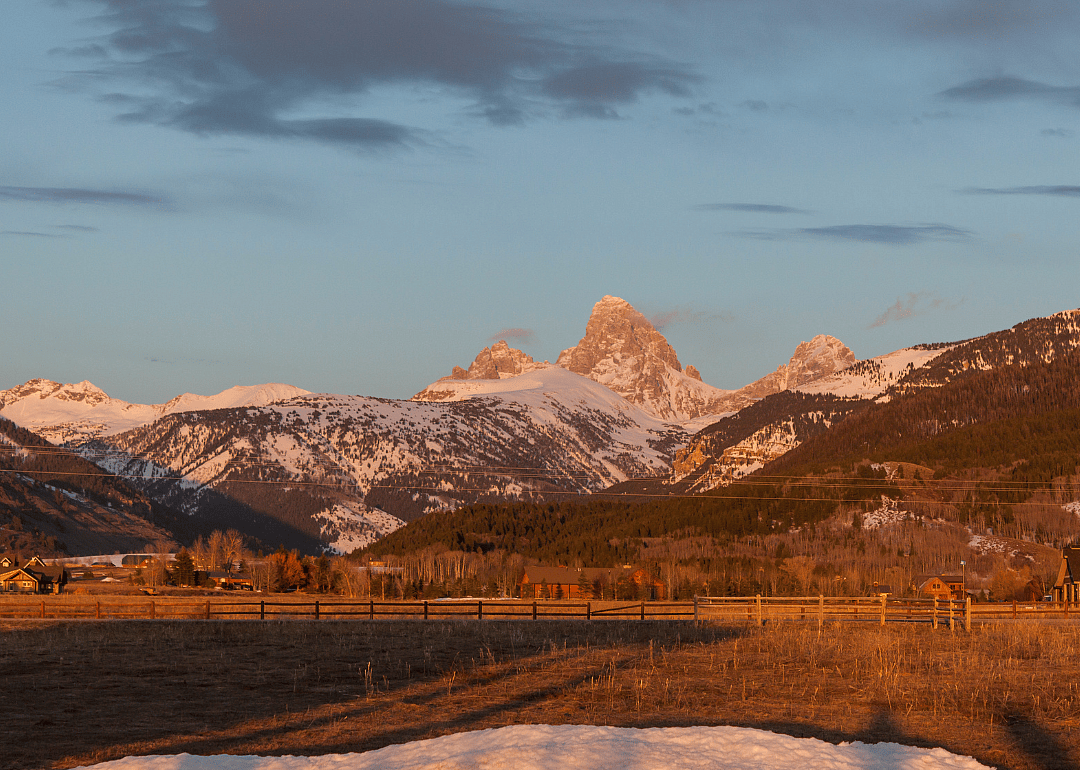
#13. Teton County
- Five-year precipitation average: 24.35 inches
- Precipitation over the past year: 23.01 inches (#72 rainiest year since 1895)
- Precipitation compared to 1901-2000 average: 0.29 inches above norm
melissamn // Shutterstock
33 / 44#12. Lewis County
- Five-year precipitation average: 25.54 inches
- Precipitation over the past year: 27.50 inches (#96 rainiest year since 1895)
- Precipitation compared to 1901-2000 average: 2.04 inches above norm
#11. Boise County
- Five-year precipitation average: 28.01 inches
- Precipitation over the past year: 30.50 inches (#70 rainiest year since 1895)
- Precipitation compared to 1901-2000 average: -0.07 inches below norm
Norm Lane // Shutterstock
35 / 44#10. Benewah County
- Five-year precipitation average: 28.13 inches
- Precipitation over the past year: 31.49 inches (#66 rainiest year since 1895)
- Precipitation compared to 1901-2000 average: 0.11 inches above norm
You may also like: Hottest Octobers in Idaho since 1895
#9. Adams County
- Five-year precipitation average: 28.15 inches
- Precipitation over the past year: 26.86 inches (#25 rainiest year since 1895)
- Precipitation compared to 1901-2000 average: -5.62 inches below norm
#8. Kootenai County
- Five-year precipitation average: 28.93 inches
- Precipitation over the past year: 32.02 inches (#62 rainiest year since 1895)
- Precipitation compared to 1901-2000 average: -0.31 inches below norm
Danita Delimont // Shutterstock
38 / 44#7. Latah County
- Five-year precipitation average: 29.88 inches
- Precipitation over the past year: 33.69 inches (#94 rainiest year since 1895)
- Precipitation compared to 1901-2000 average: 3.10 inches above norm
#6. Valley County
- Five-year precipitation average: 30.35 inches
- Precipitation over the past year: 30.48 inches (#23 rainiest year since 1895)
- Precipitation compared to 1901-2000 average: -5.69 inches below norm
#4. Boundary County
- Five-year precipitation average: 34.53 inches
- Precipitation over the past year: 34.85 inches (#41 rainiest year since 1895)
- Precipitation compared to 1901-2000 average: -3.23 inches below norm
#3. Idaho County
- Five-year precipitation average: 35.54 inches
- Precipitation over the past year: 34.03 inches (#41 rainiest year since 1895)
- Precipitation compared to 1901-2000 average: -3.51 inches below norm
#2. Clearwater County
- Five-year precipitation average: 41.60 inches
- Precipitation over the past year: 41.91 inches (#34 rainiest year since 1895)
- Precipitation compared to 1901-2000 average: -4.88 inches below norm
jfergusonphotos // Shutterstock
44 / 44#1. Shoshone County
- Five-year precipitation average: 41.93 inches
- Precipitation over the past year: 43.91 inches (#45 rainiest year since 1895)
- Precipitation compared to 1901-2000 average: -3.62 inches below norm