Canva
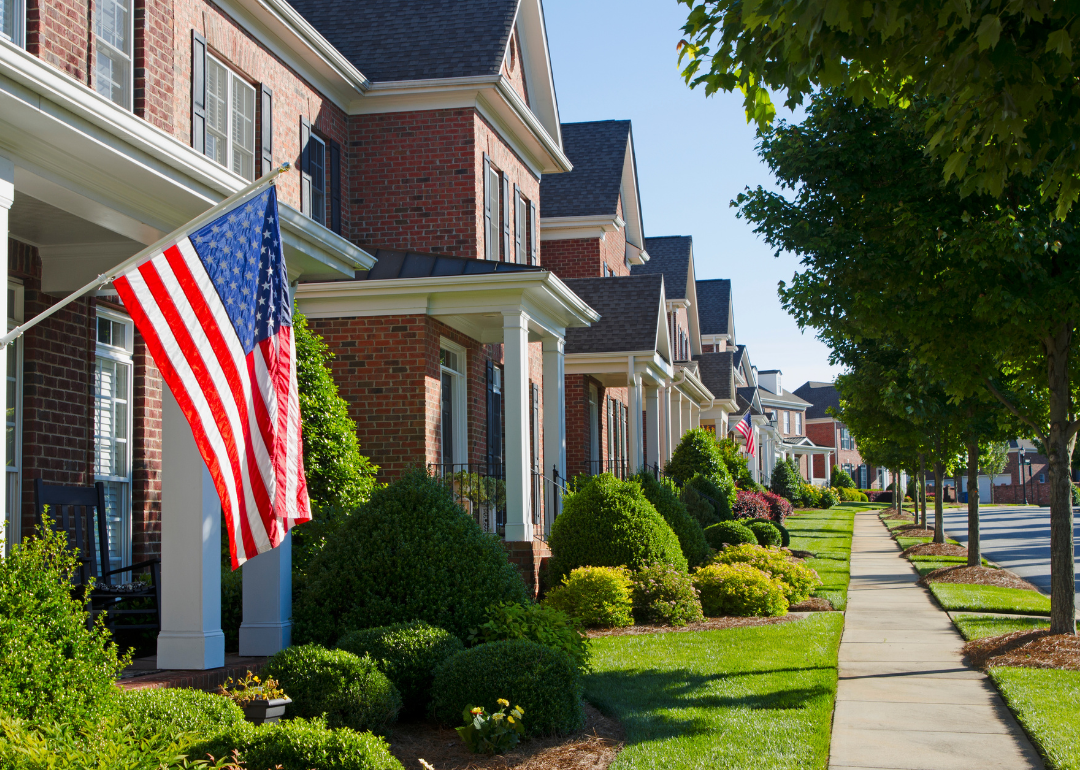
Most diverse counties in Minnesota
The United States has a longstanding reputation as being a melting pot (or salad bowl), with its diversity manifesting itself across many different demographics. However, some places across the country are notably more heterogeneous than others.
Stacker compiled a list of the most diverse counties in Minnesota using data from using data from the U.S. Census Bureau. Counties are ranked by the highest Simpson's diversity index score. Simpson's diversity index measures community diversity on a scale of 0 (least diverse) to 1 (most diverse), more on the calculation can be read here.
Think you know which counties in your home state might be the most diverse? Keep reading to see if your predictions are correct.
#50. Pennington County
- Index: 0.116
- Total population: 14,183
- White: 94.0% (13,329)
- Black or African American: 1.1% (153)
- American Indian and Alaska Native: 1.6% (233)
- Asian: 1.2% (165)
- Native Hawaiian and other Pacific Islander: 0.0% (0)
- 2 or more races: 1.9% (270)
- Some other Race: 0.2% (33)
- Total population: 14,183
- White: 94.0% (13,329)
- Black or African American: 1.1% (153)
- American Indian and Alaska Native: 1.6% (233)
- Asian: 1.2% (165)
- Native Hawaiian and other Pacific Islander: 0.0% (0)
- 2 or more races: 1.9% (270)
- Some other Race: 0.2% (33)
#49. Koochiching County
- Index: 0.123
- Total population: 12,515
- White: 93.6% (11,711)
- Black or African American: 0.6% (73)
- American Indian and Alaska Native: 3.1% (391)
- Asian: 0.4% (49)
- Native Hawaiian and other Pacific Islander: 0.0% (0)
- 2 or more races: 1.4% (180)
- Some other Race: 0.9% (111)
- Total population: 12,515
- White: 93.6% (11,711)
- Black or African American: 0.6% (73)
- American Indian and Alaska Native: 3.1% (391)
- Asian: 0.4% (49)
- Native Hawaiian and other Pacific Islander: 0.0% (0)
- 2 or more races: 1.4% (180)
- Some other Race: 0.9% (111)
#48. Winona County
- Index: 0.124
- Total population: 50,725
- White: 93.6% (47,455)
- Black or African American: 1.3% (651)
- American Indian and Alaska Native: 0.4% (186)
- Asian: 2.6% (1,340)
- Native Hawaiian and other Pacific Islander: 0.0% (0)
- 2 or more races: 1.7% (865)
- Some other Race: 0.4% (228)
- Total population: 50,725
- White: 93.6% (47,455)
- Black or African American: 1.3% (651)
- American Indian and Alaska Native: 0.4% (186)
- Asian: 2.6% (1,340)
- Native Hawaiian and other Pacific Islander: 0.0% (0)
- 2 or more races: 1.7% (865)
- Some other Race: 0.4% (228)
#47. Hubbard County
- Index: 0.126
- Total population: 21,019
- White: 93.4% (19,634)
- Black or African American: 0.6% (135)
- American Indian and Alaska Native: 2.2% (468)
- Asian: 0.7% (140)
- Native Hawaiian and other Pacific Islander: 0.0% (0)
- 2 or more races: 2.1% (431)
- Some other Race: 1.0% (211)
- Total population: 21,019
- White: 93.4% (19,634)
- Black or African American: 0.6% (135)
- American Indian and Alaska Native: 2.2% (468)
- Asian: 0.7% (140)
- Native Hawaiian and other Pacific Islander: 0.0% (0)
- 2 or more races: 2.1% (431)
- Some other Race: 1.0% (211)
#46. Norman County
- Index: 0.129
- Total population: 6,520
- White: 93.3% (6,080)
- Black or African American: 1.0% (65)
- American Indian and Alaska Native: 2.2% (145)
- Asian: 0.4% (26)
- Native Hawaiian and other Pacific Islander: 0.0% (0)
- 2 or more races: 2.5% (160)
- Some other Race: 0.7% (44)
- Total population: 6,520
- White: 93.3% (6,080)
- Black or African American: 1.0% (65)
- American Indian and Alaska Native: 2.2% (145)
- Asian: 0.4% (26)
- Native Hawaiian and other Pacific Islander: 0.0% (0)
- 2 or more races: 2.5% (160)
- Some other Race: 0.7% (44)
#45. Lake of the Woods County
- Index: 0.131
- Total population: 3,771
- White: 93.0% (3,508)
- Black or African American: 0.1% (2)
- American Indian and Alaska Native: 1.3% (49)
- Asian: 0.1% (3)
- Native Hawaiian and other Pacific Islander: 0.0% (0)
- 2 or more races: 5.5% (208)
- Some other Race: 0.0% (1)
- Total population: 3,771
- White: 93.0% (3,508)
- Black or African American: 0.1% (2)
- American Indian and Alaska Native: 1.3% (49)
- Asian: 0.1% (3)
- Native Hawaiian and other Pacific Islander: 0.0% (0)
- 2 or more races: 5.5% (208)
- Some other Race: 0.0% (1)
#44. Waseca County
- Index: 0.136
- Total population: 18,740
- White: 92.9% (17,409)
- Black or African American: 2.4% (444)
- American Indian and Alaska Native: 0.7% (131)
- Asian: 0.6% (113)
- Native Hawaiian and other Pacific Islander: 0.0% (4)
- 2 or more races: 1.7% (325)
- Some other Race: 1.7% (314)
- Total population: 18,740
- White: 92.9% (17,409)
- Black or African American: 2.4% (444)
- American Indian and Alaska Native: 0.7% (131)
- Asian: 0.6% (113)
- Native Hawaiian and other Pacific Islander: 0.0% (4)
- 2 or more races: 1.7% (325)
- Some other Race: 1.7% (314)
#43. Itasca County
- Index: 0.137
- Total population: 45,141
- White: 92.8% (41,877)
- Black or African American: 0.5% (222)
- American Indian and Alaska Native: 3.7% (1,673)
- Asian: 0.4% (192)
- Native Hawaiian and other Pacific Islander: 0.0% (3)
- 2 or more races: 2.4% (1,093)
- Some other Race: 0.2% (81)
- Total population: 45,141
- White: 92.8% (41,877)
- Black or African American: 0.5% (222)
- American Indian and Alaska Native: 3.7% (1,673)
- Asian: 0.4% (192)
- Native Hawaiian and other Pacific Islander: 0.0% (3)
- 2 or more races: 2.4% (1,093)
- Some other Race: 0.2% (81)
#42. Yellow Medicine County
- Index: 0.141
- Total population: 9,814
- White: 92.6% (9,090)
- Black or African American: 0.7% (68)
- American Indian and Alaska Native: 2.5% (249)
- Asian: 0.6% (60)
- Native Hawaiian and other Pacific Islander: 0.0% (0)
- 2 or more races: 2.0% (201)
- Some other Race: 1.5% (146)
- Total population: 9,814
- White: 92.6% (9,090)
- Black or African American: 0.7% (68)
- American Indian and Alaska Native: 2.5% (249)
- Asian: 0.6% (60)
- Native Hawaiian and other Pacific Islander: 0.0% (0)
- 2 or more races: 2.0% (201)
- Some other Race: 1.5% (146)
#41. Roseau County
- Index: 0.142
- Total population: 15,361
- White: 92.5% (14,214)
- Black or African American: 1.0% (146)
- American Indian and Alaska Native: 1.8% (281)
- Asian: 2.7% (416)
- Native Hawaiian and other Pacific Islander: 0.1% (9)
- 2 or more races: 1.7% (263)
- Some other Race: 0.2% (32)
- Total population: 15,361
- White: 92.5% (14,214)
- Black or African American: 1.0% (146)
- American Indian and Alaska Native: 1.8% (281)
- Asian: 2.7% (416)
- Native Hawaiian and other Pacific Islander: 0.1% (9)
- 2 or more races: 1.7% (263)
- Some other Race: 0.2% (32)
#40. Sherburne County
- Index: 0.145
- Total population: 94,463
- White: 92.4% (87,265)
- Black or African American: 2.5% (2,335)
- American Indian and Alaska Native: 0.6% (556)
- Asian: 1.3% (1,213)
- Native Hawaiian and other Pacific Islander: 0.0% (0)
- 2 or more races: 2.0% (1,888)
- Some other Race: 1.3% (1,206)
- Total population: 94,463
- White: 92.4% (87,265)
- Black or African American: 2.5% (2,335)
- American Indian and Alaska Native: 0.6% (556)
- Asian: 1.3% (1,213)
- Native Hawaiian and other Pacific Islander: 0.0% (0)
- 2 or more races: 2.0% (1,888)
- Some other Race: 1.3% (1,206)
#39. St. Louis County
- Index: 0.151
- Total population: 199,759
- White: 92.1% (183,938)
- Black or African American: 1.6% (3,154)
- American Indian and Alaska Native: 1.8% (3,655)
- Asian: 1.0% (2,060)
- Native Hawaiian and other Pacific Islander: 0.0% (91)
- 2 or more races: 3.0% (5,954)
- Some other Race: 0.5% (907)
- Total population: 199,759
- White: 92.1% (183,938)
- Black or African American: 1.6% (3,154)
- American Indian and Alaska Native: 1.8% (3,655)
- Asian: 1.0% (2,060)
- Native Hawaiian and other Pacific Islander: 0.0% (91)
- 2 or more races: 3.0% (5,954)
- Some other Race: 0.5% (907)
#38. Pipestone County
- Index: 0.151
- Total population: 9,191
- White: 92.0% (8,460)
- Black or African American: 1.3% (120)
- American Indian and Alaska Native: 1.9% (173)
- Asian: 0.2% (15)
- Native Hawaiian and other Pacific Islander: 0.0% (0)
- 2 or more races: 2.9% (271)
- Some other Race: 1.7% (152)
- Total population: 9,191
- White: 92.0% (8,460)
- Black or African American: 1.3% (120)
- American Indian and Alaska Native: 1.9% (173)
- Asian: 0.2% (15)
- Native Hawaiian and other Pacific Islander: 0.0% (0)
- 2 or more races: 2.9% (271)
- Some other Race: 1.7% (152)
#37. Nicollet County
- Index: 0.152
- Total population: 33,954
- White: 92.0% (31,228)
- Black or African American: 2.8% (958)
- American Indian and Alaska Native: 0.0% (13)
- Asian: 1.7% (592)
- Native Hawaiian and other Pacific Islander: 0.0% (0)
- 2 or more races: 2.6% (875)
- Some other Race: 0.8% (288)
- Total population: 33,954
- White: 92.0% (31,228)
- Black or African American: 2.8% (958)
- American Indian and Alaska Native: 0.0% (13)
- Asian: 1.7% (592)
- Native Hawaiian and other Pacific Islander: 0.0% (0)
- 2 or more races: 2.6% (875)
- Some other Race: 0.8% (288)
#36. Carver County
- Index: 0.153
- Total population: 101,949
- White: 92.0% (93,751)
- Black or African American: 1.8% (1,864)
- American Indian and Alaska Native: 0.2% (217)
- Asian: 2.8% (2,893)
- Native Hawaiian and other Pacific Islander: 0.0% (11)
- 2 or more races: 2.5% (2,498)
- Some other Race: 0.7% (715)
- Total population: 101,949
- White: 92.0% (93,751)
- Black or African American: 1.8% (1,864)
- American Indian and Alaska Native: 0.2% (217)
- Asian: 2.8% (2,893)
- Native Hawaiian and other Pacific Islander: 0.0% (11)
- 2 or more races: 2.5% (2,498)
- Some other Race: 0.7% (715)
#35. Polk County
- Index: 0.158
- Total population: 31,521
- White: 91.7% (28,896)
- Black or African American: 2.2% (686)
- American Indian and Alaska Native: 1.7% (549)
- Asian: 1.0% (312)
- Native Hawaiian and other Pacific Islander: 0.1% (16)
- 2 or more races: 2.2% (693)
- Some other Race: 1.2% (369)
- Total population: 31,521
- White: 91.7% (28,896)
- Black or African American: 2.2% (686)
- American Indian and Alaska Native: 1.7% (549)
- Asian: 1.0% (312)
- Native Hawaiian and other Pacific Islander: 0.1% (16)
- 2 or more races: 2.2% (693)
- Some other Race: 1.2% (369)
#34. Freeborn County
- Index: 0.160
- Total population: 30,463
- White: 91.6% (27,894)
- Black or African American: 1.1% (330)
- American Indian and Alaska Native: 0.5% (150)
- Asian: 2.6% (777)
- Native Hawaiian and other Pacific Islander: 0.0% (0)
- 2 or more races: 1.9% (583)
- Some other Race: 2.4% (729)
- Total population: 30,463
- White: 91.6% (27,894)
- Black or African American: 1.1% (330)
- American Indian and Alaska Native: 0.5% (150)
- Asian: 2.6% (777)
- Native Hawaiian and other Pacific Islander: 0.0% (0)
- 2 or more races: 1.9% (583)
- Some other Race: 2.4% (729)
#33. Pine County
- Index: 0.163
- Total population: 29,223
- White: 91.4% (26,701)
- Black or African American: 2.3% (658)
- American Indian and Alaska Native: 2.4% (711)
- Asian: 0.6% (164)
- Native Hawaiian and other Pacific Islander: 0.0% (9)
- 2 or more races: 2.9% (836)
- Some other Race: 0.5% (144)
- Total population: 29,223
- White: 91.4% (26,701)
- Black or African American: 2.3% (658)
- American Indian and Alaska Native: 2.4% (711)
- Asian: 0.6% (164)
- Native Hawaiian and other Pacific Islander: 0.0% (9)
- 2 or more races: 2.9% (836)
- Some other Race: 0.5% (144)
#32. Benton County
- Index: 0.164
- Total population: 40,129
- White: 91.3% (36,637)
- Black or African American: 4.0% (1,601)
- American Indian and Alaska Native: 0.2% (78)
- Asian: 1.0% (408)
- Native Hawaiian and other Pacific Islander: 0.0% (0)
- 2 or more races: 2.7% (1,079)
- Some other Race: 0.8% (326)
- Total population: 40,129
- White: 91.3% (36,637)
- Black or African American: 4.0% (1,601)
- American Indian and Alaska Native: 0.2% (78)
- Asian: 1.0% (408)
- Native Hawaiian and other Pacific Islander: 0.0% (0)
- 2 or more races: 2.7% (1,079)
- Some other Race: 0.8% (326)
#31. Traverse County
- Index: 0.174
- Total population: 3,311
- White: 90.7% (3,003)
- Black or African American: 0.5% (17)
- American Indian and Alaska Native: 5.0% (164)
- Asian: 0.2% (6)
- Native Hawaiian and other Pacific Islander: 0.0% (0)
- 2 or more races: 2.6% (85)
- Some other Race: 1.1% (36)
- Total population: 3,311
- White: 90.7% (3,003)
- Black or African American: 0.5% (17)
- American Indian and Alaska Native: 5.0% (164)
- Asian: 0.2% (6)
- Native Hawaiian and other Pacific Islander: 0.0% (0)
- 2 or more races: 2.6% (85)
- Some other Race: 1.1% (36)
#30. Blue Earth County
- Index: 0.174
- Total population: 66,795
- White: 90.7% (60,604)
- Black or African American: 3.9% (2,578)
- American Indian and Alaska Native: 0.3% (177)
- Asian: 2.2% (1,443)
- Native Hawaiian and other Pacific Islander: 0.0% (11)
- 2 or more races: 2.5% (1,641)
- Some other Race: 0.5% (341)
- Total population: 66,795
- White: 90.7% (60,604)
- Black or African American: 3.9% (2,578)
- American Indian and Alaska Native: 0.3% (177)
- Asian: 2.2% (1,443)
- Native Hawaiian and other Pacific Islander: 0.0% (11)
- 2 or more races: 2.5% (1,641)
- Some other Race: 0.5% (341)
#29. Clay County
- Index: 0.177
- Total population: 63,446
- White: 90.6% (57,471)
- Black or African American: 3.7% (2,332)
- American Indian and Alaska Native: 1.8% (1,125)
- Asian: 1.3% (803)
- Native Hawaiian and other Pacific Islander: 0.1% (77)
- 2 or more races: 2.0% (1,297)
- Some other Race: 0.5% (341)
- Total population: 63,446
- White: 90.6% (57,471)
- Black or African American: 3.7% (2,332)
- American Indian and Alaska Native: 1.8% (1,125)
- Asian: 1.3% (803)
- Native Hawaiian and other Pacific Islander: 0.1% (77)
- 2 or more races: 2.0% (1,297)
- Some other Race: 0.5% (341)
#28. Steele County
- Index: 0.179
- Total population: 36,683
- White: 90.5% (33,193)
- Black or African American: 3.2% (1,158)
- American Indian and Alaska Native: 0.4% (132)
- Asian: 1.5% (547)
- Native Hawaiian and other Pacific Islander: 0.1% (29)
- 2 or more races: 1.1% (402)
- Some other Race: 3.3% (1,222)
- Total population: 36,683
- White: 90.5% (33,193)
- Black or African American: 3.2% (1,158)
- American Indian and Alaska Native: 0.4% (132)
- Asian: 1.5% (547)
- Native Hawaiian and other Pacific Islander: 0.1% (29)
- 2 or more races: 1.1% (402)
- Some other Race: 3.3% (1,222)
#27. Stevens County
- Index: 0.181
- Total population: 9,789
- White: 90.4% (8,846)
- Black or African American: 2.0% (195)
- American Indian and Alaska Native: 1.7% (163)
- Asian: 2.4% (232)
- Native Hawaiian and other Pacific Islander: 0.2% (15)
- 2 or more races: 1.1% (109)
- Some other Race: 2.3% (229)
- Total population: 9,789
- White: 90.4% (8,846)
- Black or African American: 2.0% (195)
- American Indian and Alaska Native: 1.7% (163)
- Asian: 2.4% (232)
- Native Hawaiian and other Pacific Islander: 0.2% (15)
- 2 or more races: 1.1% (109)
- Some other Race: 2.3% (229)
#26. Mille Lacs County
- Index: 0.183
- Total population: 25,865
- White: 90.2% (23,321)
- Black or African American: 0.5% (120)
- American Indian and Alaska Native: 5.0% (1,298)
- Asian: 0.7% (175)
- Native Hawaiian and other Pacific Islander: 0.1% (19)
- 2 or more races: 3.2% (815)
- Some other Race: 0.5% (117)
- Total population: 25,865
- White: 90.2% (23,321)
- Black or African American: 0.5% (120)
- American Indian and Alaska Native: 5.0% (1,298)
- Asian: 0.7% (175)
- Native Hawaiian and other Pacific Islander: 0.1% (19)
- 2 or more races: 3.2% (815)
- Some other Race: 0.5% (117)
#25. Chippewa County
- Index: 0.185
- Total population: 11,953
- White: 90.1% (10,775)
- Black or African American: 0.9% (103)
- American Indian and Alaska Native: 2.0% (238)
- Asian: 0.9% (105)
- Native Hawaiian and other Pacific Islander: 1.1% (137)
- 2 or more races: 0.8% (98)
- Some other Race: 4.2% (497)
- Total population: 11,953
- White: 90.1% (10,775)
- Black or African American: 0.9% (103)
- American Indian and Alaska Native: 2.0% (238)
- Asian: 0.9% (105)
- Native Hawaiian and other Pacific Islander: 1.1% (137)
- 2 or more races: 0.8% (98)
- Some other Race: 4.2% (497)
#24. Renville County
- Index: 0.196
- Total population: 14,652
- White: 89.4% (13,095)
- Black or African American: 0.4% (56)
- American Indian and Alaska Native: 1.5% (217)
- Asian: 0.7% (100)
- Native Hawaiian and other Pacific Islander: 0.0% (0)
- 2 or more races: 1.4% (203)
- Some other Race: 6.7% (981)
- Total population: 14,652
- White: 89.4% (13,095)
- Black or African American: 0.4% (56)
- American Indian and Alaska Native: 1.5% (217)
- Asian: 0.7% (100)
- Native Hawaiian and other Pacific Islander: 0.0% (0)
- 2 or more races: 1.4% (203)
- Some other Race: 6.7% (981)
#23. Carlton County
- Index: 0.197
- Total population: 35,633
- White: 89.4% (31,849)
- Black or African American: 1.9% (670)
- American Indian and Alaska Native: 5.1% (1,802)
- Asian: 0.6% (205)
- Native Hawaiian and other Pacific Islander: 0.0% (0)
- 2 or more races: 3.0% (1,085)
- Some other Race: 0.1% (22)
- Total population: 35,633
- White: 89.4% (31,849)
- Black or African American: 1.9% (670)
- American Indian and Alaska Native: 5.1% (1,802)
- Asian: 0.6% (205)
- Native Hawaiian and other Pacific Islander: 0.0% (0)
- 2 or more races: 3.0% (1,085)
- Some other Race: 0.1% (22)
#22. Cottonwood County
- Index: 0.197
- Total population: 11,299
- White: 89.4% (10,101)
- Black or African American: 0.9% (107)
- American Indian and Alaska Native: 0.1% (14)
- Asian: 4.0% (450)
- Native Hawaiian and other Pacific Islander: 0.2% (18)
- 2 or more races: 1.4% (156)
- Some other Race: 4.0% (453)
- Total population: 11,299
- White: 89.4% (10,101)
- Black or African American: 0.9% (107)
- American Indian and Alaska Native: 0.1% (14)
- Asian: 4.0% (450)
- Native Hawaiian and other Pacific Islander: 0.2% (18)
- 2 or more races: 1.4% (156)
- Some other Race: 4.0% (453)
#21. Kandiyohi County
- Index: 0.216
- Total population: 42,841
- White: 88.3% (37,829)
- Black or African American: 5.3% (2,285)
- American Indian and Alaska Native: 0.3% (142)
- Asian: 1.0% (444)
- Native Hawaiian and other Pacific Islander: 0.0% (0)
- 2 or more races: 1.8% (764)
- Some other Race: 3.2% (1,377)
- Total population: 42,841
- White: 88.3% (37,829)
- Black or African American: 5.3% (2,285)
- American Indian and Alaska Native: 0.3% (142)
- Asian: 1.0% (444)
- Native Hawaiian and other Pacific Islander: 0.0% (0)
- 2 or more races: 1.8% (764)
- Some other Race: 3.2% (1,377)
#20. Redwood County
- Index: 0.222
- Total population: 15,261
- White: 88.0% (13,428)
- Black or African American: 0.8% (119)
- American Indian and Alaska Native: 5.0% (765)
- Asian: 2.7% (409)
- Native Hawaiian and other Pacific Islander: 0.0% (0)
- 2 or more races: 1.7% (263)
- Some other Race: 1.8% (277)
- Total population: 15,261
- White: 88.0% (13,428)
- Black or African American: 0.8% (119)
- American Indian and Alaska Native: 5.0% (765)
- Asian: 2.7% (409)
- Native Hawaiian and other Pacific Islander: 0.0% (0)
- 2 or more races: 1.7% (263)
- Some other Race: 1.8% (277)
#19. Stearns County
- Index: 0.223
- Total population: 158,452
- White: 87.8% (139,188)
- Black or African American: 6.4% (10,217)
- American Indian and Alaska Native: 0.2% (330)
- Asian: 2.1% (3,304)
- Native Hawaiian and other Pacific Islander: 0.0% (11)
- 2 or more races: 2.1% (3,283)
- Some other Race: 1.3% (2,119)
- Total population: 158,452
- White: 87.8% (139,188)
- Black or African American: 6.4% (10,217)
- American Indian and Alaska Native: 0.2% (330)
- Asian: 2.1% (3,304)
- Native Hawaiian and other Pacific Islander: 0.0% (11)
- 2 or more races: 2.1% (3,283)
- Some other Race: 1.3% (2,119)
#18. Becker County
- Index: 0.226
- Total population: 34,011
- White: 87.6% (29,783)
- Black or African American: 0.5% (167)
- American Indian and Alaska Native: 7.4% (2,513)
- Asian: 0.6% (219)
- Native Hawaiian and other Pacific Islander: 0.0% (10)
- 2 or more races: 3.5% (1,201)
- Some other Race: 0.3% (118)
- Total population: 34,011
- White: 87.6% (29,783)
- Black or African American: 0.5% (167)
- American Indian and Alaska Native: 7.4% (2,513)
- Asian: 0.6% (219)
- Native Hawaiian and other Pacific Islander: 0.0% (10)
- 2 or more races: 3.5% (1,201)
- Some other Race: 0.3% (118)
#17. Mower County
- Index: 0.243
- Total population: 39,807
- White: 86.8% (34,533)
- Black or African American: 3.9% (1,570)
- American Indian and Alaska Native: 0.1% (54)
- Asian: 3.7% (1,468)
- Native Hawaiian and other Pacific Islander: 0.6% (248)
- 2 or more races: 2.1% (843)
- Some other Race: 2.7% (1,091)
- Total population: 39,807
- White: 86.8% (34,533)
- Black or African American: 3.9% (1,570)
- American Indian and Alaska Native: 0.1% (54)
- Asian: 3.7% (1,468)
- Native Hawaiian and other Pacific Islander: 0.6% (248)
- 2 or more races: 2.1% (843)
- Some other Race: 2.7% (1,091)
#16. Cook County
- Index: 0.248
- Total population: 5,376
- White: 86.2% (4,634)
- Black or African American: 0.1% (4)
- American Indian and Alaska Native: 8.8% (474)
- Asian: 0.9% (50)
- Native Hawaiian and other Pacific Islander: 0.0% (0)
- 2 or more races: 2.5% (136)
- Some other Race: 1.5% (78)
- Total population: 5,376
- White: 86.2% (4,634)
- Black or African American: 0.1% (4)
- American Indian and Alaska Native: 8.8% (474)
- Asian: 0.9% (50)
- Native Hawaiian and other Pacific Islander: 0.0% (0)
- 2 or more races: 2.5% (136)
- Some other Race: 1.5% (78)
#15. Watonwan County
- Index: 0.252
- Total population: 10,972
- White: 85.8% (9,411)
- Black or African American: 0.9% (102)
- American Indian and Alaska Native: 0.1% (9)
- Asian: 1.2% (129)
- Native Hawaiian and other Pacific Islander: 0.0% (0)
- 2 or more races: 1.1% (124)
- Some other Race: 10.9% (1,197)
- Total population: 10,972
- White: 85.8% (9,411)
- Black or African American: 0.9% (102)
- American Indian and Alaska Native: 0.1% (9)
- Asian: 1.2% (129)
- Native Hawaiian and other Pacific Islander: 0.0% (0)
- 2 or more races: 1.1% (124)
- Some other Race: 10.9% (1,197)
#14. Lyon County
- Index: 0.252
- Total population: 25,758
- White: 86.2% (22,201)
- Black or African American: 3.5% (891)
- American Indian and Alaska Native: 0.4% (93)
- Asian: 4.3% (1,117)
- Native Hawaiian and other Pacific Islander: 0.0% (2)
- 2 or more races: 1.8% (458)
- Some other Race: 3.9% (996)
- Total population: 25,758
- White: 86.2% (22,201)
- Black or African American: 3.5% (891)
- American Indian and Alaska Native: 0.4% (93)
- Asian: 4.3% (1,117)
- Native Hawaiian and other Pacific Islander: 0.0% (2)
- 2 or more races: 1.8% (458)
- Some other Race: 3.9% (996)
#13. Clearwater County
- Index: 0.254
- Total population: 8,821
- White: 85.8% (7,568)
- Black or African American: 0.2% (16)
- American Indian and Alaska Native: 8.3% (734)
- Asian: 0.5% (42)
- Native Hawaiian and other Pacific Islander: 0.0% (2)
- 2 or more races: 5.0% (441)
- Some other Race: 0.2% (18)
- Total population: 8,821
- White: 85.8% (7,568)
- Black or African American: 0.2% (16)
- American Indian and Alaska Native: 8.3% (734)
- Asian: 0.5% (42)
- Native Hawaiian and other Pacific Islander: 0.0% (2)
- 2 or more races: 5.0% (441)
- Some other Race: 0.2% (18)
#12. Rice County
- Index: 0.261
- Total population: 66,185
- White: 85.6% (56,681)
- Black or African American: 5.7% (3,765)
- American Indian and Alaska Native: 0.4% (265)
- Asian: 2.1% (1,411)
- Native Hawaiian and other Pacific Islander: 0.1% (56)
- 2 or more races: 2.4% (1,603)
- Some other Race: 3.6% (2,404)
- Total population: 66,185
- White: 85.6% (56,681)
- Black or African American: 5.7% (3,765)
- American Indian and Alaska Native: 0.4% (265)
- Asian: 2.1% (1,411)
- Native Hawaiian and other Pacific Islander: 0.1% (56)
- 2 or more races: 2.4% (1,603)
- Some other Race: 3.6% (2,404)
#11. Washington County
- Index: 0.265
- Total population: 255,938
- White: 85.4% (218,513)
- Black or African American: 4.6% (11,757)
- American Indian and Alaska Native: 0.4% (971)
- Asian: 5.8% (14,773)
- Native Hawaiian and other Pacific Islander: 0.1% (135)
- 2 or more races: 3.0% (7,712)
- Some other Race: 0.8% (2,077)
- Total population: 255,938
- White: 85.4% (218,513)
- Black or African American: 4.6% (11,757)
- American Indian and Alaska Native: 0.4% (971)
- Asian: 5.8% (14,773)
- Native Hawaiian and other Pacific Islander: 0.1% (135)
- 2 or more races: 3.0% (7,712)
- Some other Race: 0.8% (2,077)
#10. Cass County
- Index: 0.272
- Total population: 29,268
- White: 84.5% (24,720)
- Black or African American: 0.4% (122)
- American Indian and Alaska Native: 11.8% (3,450)
- Asian: 0.6% (187)
- Native Hawaiian and other Pacific Islander: 0.0% (4)
- 2 or more races: 2.4% (717)
- Some other Race: 0.2% (68)
- Total population: 29,268
- White: 84.5% (24,720)
- Black or African American: 0.4% (122)
- American Indian and Alaska Native: 11.8% (3,450)
- Asian: 0.6% (187)
- Native Hawaiian and other Pacific Islander: 0.0% (4)
- 2 or more races: 2.4% (717)
- Some other Race: 0.2% (68)
#9. Scott County
- Index: 0.288
- Total population: 145,275
- White: 84.0% (121,973)
- Black or African American: 4.3% (6,199)
- American Indian and Alaska Native: 0.5% (732)
- Asian: 6.1% (8,845)
- Native Hawaiian and other Pacific Islander: 0.0% (14)
- 2 or more races: 2.9% (4,165)
- Some other Race: 2.3% (3,347)
- Total population: 145,275
- White: 84.0% (121,973)
- Black or African American: 4.3% (6,199)
- American Indian and Alaska Native: 0.5% (732)
- Asian: 6.1% (8,845)
- Native Hawaiian and other Pacific Islander: 0.0% (14)
- 2 or more races: 2.9% (4,165)
- Some other Race: 2.3% (3,347)
#8. Olmsted County
- Index: 0.291
- Total population: 154,809
- White: 83.7% (129,616)
- Black or African American: 6.2% (9,566)
- American Indian and Alaska Native: 0.4% (554)
- Asian: 5.8% (9,028)
- Native Hawaiian and other Pacific Islander: 0.1% (128)
- 2 or more races: 2.8% (4,404)
- Some other Race: 1.0% (1,513)
- Total population: 154,809
- White: 83.7% (129,616)
- Black or African American: 6.2% (9,566)
- American Indian and Alaska Native: 0.4% (554)
- Asian: 5.8% (9,028)
- Native Hawaiian and other Pacific Islander: 0.1% (128)
- 2 or more races: 2.8% (4,404)
- Some other Race: 1.0% (1,513)
#7. Anoka County
- Index: 0.294
- Total population: 350,253
- White: 83.6% (292,866)
- Black or African American: 6.2% (21,877)
- American Indian and Alaska Native: 0.7% (2,373)
- Asian: 4.5% (15,645)
- Native Hawaiian and other Pacific Islander: 0.0% (92)
- 2 or more races: 3.3% (11,712)
- Some other Race: 1.6% (5,688)
- Total population: 350,253
- White: 83.6% (292,866)
- Black or African American: 6.2% (21,877)
- American Indian and Alaska Native: 0.7% (2,373)
- Asian: 4.5% (15,645)
- Native Hawaiian and other Pacific Islander: 0.0% (92)
- 2 or more races: 3.3% (11,712)
- Some other Race: 1.6% (5,688)
#6. Dakota County
- Index: 0.318
- Total population: 421,453
- White: 82.1% (345,909)
- Black or African American: 6.3% (26,362)
- American Indian and Alaska Native: 0.3% (1,337)
- Asian: 4.8% (20,348)
- Native Hawaiian and other Pacific Islander: 0.1% (212)
- 2 or more races: 3.7% (15,440)
- Some other Race: 2.8% (11,845)
- Total population: 421,453
- White: 82.1% (345,909)
- Black or African American: 6.3% (26,362)
- American Indian and Alaska Native: 0.3% (1,337)
- Asian: 4.8% (20,348)
- Native Hawaiian and other Pacific Islander: 0.1% (212)
- 2 or more races: 3.7% (15,440)
- Some other Race: 2.8% (11,845)
#5. Nobles County
- Index: 0.382
- Total population: 21,734
- White: 77.8% (16,901)
- Black or African American: 4.3% (928)
- American Indian and Alaska Native: 0.7% (145)
- Asian: 6.9% (1,508)
- Native Hawaiian and other Pacific Islander: 0.0% (2)
- 2 or more races: 2.6% (566)
- Some other Race: 7.7% (1,684)
- Total population: 21,734
- White: 77.8% (16,901)
- Black or African American: 4.3% (928)
- American Indian and Alaska Native: 0.7% (145)
- Asian: 6.9% (1,508)
- Native Hawaiian and other Pacific Islander: 0.0% (2)
- 2 or more races: 2.6% (566)
- Some other Race: 7.7% (1,684)
#4. Beltrami County
- Index: 0.426
- Total population: 46,403
- White: 72.9% (33,818)
- Black or African American: 1.6% (729)
- American Indian and Alaska Native: 20.2% (9,395)
- Asian: 0.7% (348)
- Native Hawaiian and other Pacific Islander: 0.1% (32)
- 2 or more races: 4.5% (2,078)
- Some other Race: 0.0% (3)
- Total population: 46,403
- White: 72.9% (33,818)
- Black or African American: 1.6% (729)
- American Indian and Alaska Native: 20.2% (9,395)
- Asian: 0.7% (348)
- Native Hawaiian and other Pacific Islander: 0.1% (32)
- 2 or more races: 4.5% (2,078)
- Some other Race: 0.0% (3)
#3. Hennepin County
- Index: 0.456
- Total population: 1.2 million
- White: 72.1% (897,639)
- Black or African American: 13.3% (165,152)
- American Indian and Alaska Native: 0.7% (8,962)
- Asian: 7.1% (89,004)
- Native Hawaiian and other Pacific Islander: 0.0% (415)
- 2 or more races: 3.7% (46,718)
- Some other Race: 3.0% (37,947)
- Total population: 1.2 million
- White: 72.1% (897,639)
- Black or African American: 13.3% (165,152)
- American Indian and Alaska Native: 0.7% (8,962)
- Asian: 7.1% (89,004)
- Native Hawaiian and other Pacific Islander: 0.0% (415)
- 2 or more races: 3.7% (46,718)
- Some other Race: 3.0% (37,947)
#2. Ramsey County
- Index: 0.522
- Total population: 544,442
- White: 66.3% (361,226)
- Black or African American: 12.1% (65,848)
- American Indian and Alaska Native: 0.6% (3,398)
- Asian: 14.4% (78,585)
- Native Hawaiian and other Pacific Islander: 0.0% (182)
- 2 or more races: 4.3% (23,611)
- Some other Race: 2.1% (11,592)
- Total population: 544,442
- White: 66.3% (361,226)
- Black or African American: 12.1% (65,848)
- American Indian and Alaska Native: 0.6% (3,398)
- Asian: 14.4% (78,585)
- Native Hawaiian and other Pacific Islander: 0.0% (182)
- 2 or more races: 4.3% (23,611)
- Some other Race: 2.1% (11,592)
#1. Mahnomen County
- Index: 0.608
- Total population: 5,501
- White: 46.8% (2,572)
- Black or African American: 0.5% (29)
- American Indian and Alaska Native: 39.9% (2,194)
- Asian: 0.3% (19)
- Native Hawaiian and other Pacific Islander: 0.2% (11)
- 2 or more races: 12.1% (664)
- Some other Race: 0.2% (12)
- Total population: 5,501
- White: 46.8% (2,572)
- Black or African American: 0.5% (29)
- American Indian and Alaska Native: 39.9% (2,194)
- Asian: 0.3% (19)
- Native Hawaiian and other Pacific Islander: 0.2% (11)
- 2 or more races: 12.1% (664)
- Some other Race: 0.2% (12)