Canva
Most diverse parishes in Louisiana
The United States has a longstanding reputation as being a melting pot (or salad bowl), with its diversity manifesting itself across many different demographics. However, some places across the country are notably more heterogeneous than others.
Stacker compiled a list of the most diverse parishes in Louisiana using data from using data from the U.S. Census Bureau. Parishes are ranked by the highest Simpson's diversity index score. Simpson's diversity index measures community diversity on a scale of 0 (least diverse) to 1 (most diverse), more on the calculation can be read here.
Think you know which parishes in your home state might be the most diverse? Keep reading to see if your predictions are correct.
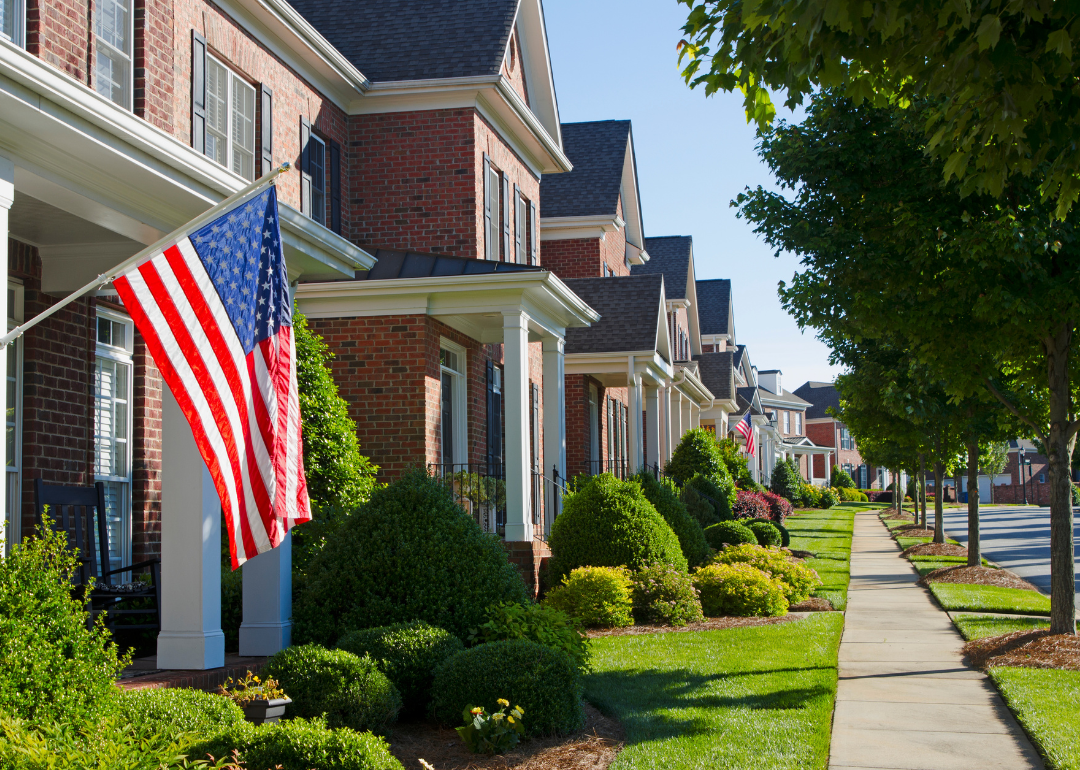
#50. Union Parish
- Index: 0.427
- Total population: 22,353
- White: 71.5% (15,986)
- Black or African American: 24.8% (5,533)
- American Indian and Alaska Native: 0.3% (62)
- Asian: 0.1% (33)
- Native Hawaiian and other Pacific Islander: 0.0% (6)
- 2 or more races: 1.7% (381)
- Some other Race: 1.6% (352)
- Total population: 22,353
- White: 71.5% (15,986)
- Black or African American: 24.8% (5,533)
- American Indian and Alaska Native: 0.3% (62)
- Asian: 0.1% (33)
- Native Hawaiian and other Pacific Islander: 0.0% (6)
- 2 or more races: 1.7% (381)
- Some other Race: 1.6% (352)
#49. East Carroll Parish
- Index: 0.428
- Total population: 7,096
- White: 29.4% (2,084)
- Black or African American: 69.7% (4,945)
- American Indian and Alaska Native: 0.0% (0)
- Asian: 0.0% (0)
- Native Hawaiian and other Pacific Islander: 0.0% (0)
- 2 or more races: 0.8% (54)
- Some other Race: 0.2% (13)
- Total population: 7,096
- White: 29.4% (2,084)
- Black or African American: 69.7% (4,945)
- American Indian and Alaska Native: 0.0% (0)
- Asian: 0.0% (0)
- Native Hawaiian and other Pacific Islander: 0.0% (0)
- 2 or more races: 0.8% (54)
- Some other Race: 0.2% (13)
#48. Ascension Parish
- Index: 0.431
- Total population: 123,114
- White: 72.2% (88,833)
- Black or African American: 21.8% (26,779)
- American Indian and Alaska Native: 0.1% (96)
- Asian: 1.1% (1,297)
- Native Hawaiian and other Pacific Islander: 0.0% (43)
- 2 or more races: 3.1% (3,837)
- Some other Race: 1.8% (2,229)
- Total population: 123,114
- White: 72.2% (88,833)
- Black or African American: 21.8% (26,779)
- American Indian and Alaska Native: 0.1% (96)
- Asian: 1.1% (1,297)
- Native Hawaiian and other Pacific Islander: 0.0% (43)
- 2 or more races: 3.1% (3,837)
- Some other Race: 1.8% (2,229)
#47. Bossier Parish
- Index: 0.431
- Total population: 126,499
- White: 71.9% (90,919)
- Black or African American: 22.8% (28,793)
- American Indian and Alaska Native: 0.5% (643)
- Asian: 1.9% (2,395)
- Native Hawaiian and other Pacific Islander: 0.1% (121)
- 2 or more races: 1.9% (2,431)
- Some other Race: 0.9% (1,197)
- Total population: 126,499
- White: 71.9% (90,919)
- Black or African American: 22.8% (28,793)
- American Indian and Alaska Native: 0.5% (643)
- Asian: 1.9% (2,395)
- Native Hawaiian and other Pacific Islander: 0.1% (121)
- 2 or more races: 1.9% (2,431)
- Some other Race: 0.9% (1,197)
#46. Calcasieu Parish
- Index: 0.448
- Total population: 201,619
- White: 70.0% (141,058)
- Black or African American: 24.9% (50,148)
- American Indian and Alaska Native: 0.3% (636)
- Asian: 1.4% (2,842)
- Native Hawaiian and other Pacific Islander: 0.0% (13)
- 2 or more races: 2.4% (4,877)
- Some other Race: 1.0% (2,045)
- Total population: 201,619
- White: 70.0% (141,058)
- Black or African American: 24.9% (50,148)
- American Indian and Alaska Native: 0.3% (636)
- Asian: 1.4% (2,842)
- Native Hawaiian and other Pacific Islander: 0.0% (13)
- 2 or more races: 2.4% (4,877)
- Some other Race: 1.0% (2,045)
#45. St. Charles Parish
- Index: 0.449
- Total population: 52,773
- White: 69.2% (36,542)
- Black or African American: 26.6% (14,059)
- American Indian and Alaska Native: 0.4% (191)
- Asian: 1.0% (528)
- Native Hawaiian and other Pacific Islander: 0.0% (0)
- 2 or more races: 1.0% (554)
- Some other Race: 1.7% (899)
- Total population: 52,773
- White: 69.2% (36,542)
- Black or African American: 26.6% (14,059)
- American Indian and Alaska Native: 0.4% (191)
- Asian: 1.0% (528)
- Native Hawaiian and other Pacific Islander: 0.0% (0)
- 2 or more races: 1.0% (554)
- Some other Race: 1.7% (899)
#44. Catahoula Parish
- Index: 0.451
- Total population: 9,766
- White: 66.7% (6,513)
- Black or African American: 32.3% (3,159)
- American Indian and Alaska Native: 0.1% (10)
- Asian: 0.2% (16)
- Native Hawaiian and other Pacific Islander: 0.0% (0)
- 2 or more races: 0.2% (15)
- Some other Race: 0.5% (53)
- Total population: 9,766
- White: 66.7% (6,513)
- Black or African American: 32.3% (3,159)
- American Indian and Alaska Native: 0.1% (10)
- Asian: 0.2% (16)
- Native Hawaiian and other Pacific Islander: 0.0% (0)
- 2 or more races: 0.2% (15)
- Some other Race: 0.5% (53)
#43. Lafayette Parish
- Index: 0.451
- Total population: 241,973
- White: 69.4% (167,836)
- Black or African American: 25.9% (62,785)
- American Indian and Alaska Native: 0.3% (637)
- Asian: 1.9% (4,529)
- Native Hawaiian and other Pacific Islander: 0.0% (0)
- 2 or more races: 1.7% (4,190)
- Some other Race: 0.8% (1,996)
- Total population: 241,973
- White: 69.4% (167,836)
- Black or African American: 25.9% (62,785)
- American Indian and Alaska Native: 0.3% (637)
- Asian: 1.9% (4,529)
- Native Hawaiian and other Pacific Islander: 0.0% (0)
- 2 or more races: 1.7% (4,190)
- Some other Race: 0.8% (1,996)
#42. Jackson Parish
- Index: 0.451
- Total population: 15,879
- White: 67.8% (10,770)
- Black or African American: 29.7% (4,719)
- American Indian and Alaska Native: 0.1% (16)
- Asian: 0.6% (92)
- Native Hawaiian and other Pacific Islander: 0.0% (0)
- 2 or more races: 0.4% (68)
- Some other Race: 1.3% (214)
- Total population: 15,879
- White: 67.8% (10,770)
- Black or African American: 29.7% (4,719)
- American Indian and Alaska Native: 0.1% (16)
- Asian: 0.6% (92)
- Native Hawaiian and other Pacific Islander: 0.0% (0)
- 2 or more races: 0.4% (68)
- Some other Race: 1.3% (214)
#41. Assumption Parish
- Index: 0.453
- Total population: 22,478
- White: 67.4% (15,158)
- Black or African American: 30.3% (6,819)
- American Indian and Alaska Native: 0.4% (93)
- Asian: 0.1% (17)
- Native Hawaiian and other Pacific Islander: 0.0% (0)
- 2 or more races: 1.1% (241)
- Some other Race: 0.7% (150)
- Total population: 22,478
- White: 67.4% (15,158)
- Black or African American: 30.3% (6,819)
- American Indian and Alaska Native: 0.4% (93)
- Asian: 0.1% (17)
- Native Hawaiian and other Pacific Islander: 0.0% (0)
- 2 or more races: 1.1% (241)
- Some other Race: 0.7% (150)
#40. Franklin Parish
- Index: 0.457
- Total population: 20,238
- White: 65.4% (13,233)
- Black or African American: 33.9% (6,862)
- American Indian and Alaska Native: 0.1% (12)
- Asian: 0.0% (0)
- Native Hawaiian and other Pacific Islander: 0.0% (9)
- 2 or more races: 0.6% (113)
- Some other Race: 0.0% (9)
- Total population: 20,238
- White: 65.4% (13,233)
- Black or African American: 33.9% (6,862)
- American Indian and Alaska Native: 0.1% (12)
- Asian: 0.0% (0)
- Native Hawaiian and other Pacific Islander: 0.0% (9)
- 2 or more races: 0.6% (113)
- Some other Race: 0.0% (9)
#39. Washington Parish
- Index: 0.460
- Total population: 46,435
- White: 66.9% (31,086)
- Black or African American: 30.2% (14,032)
- American Indian and Alaska Native: 0.2% (107)
- Asian: 0.1% (52)
- Native Hawaiian and other Pacific Islander: 0.0% (0)
- 2 or more races: 1.7% (777)
- Some other Race: 0.8% (381)
- Total population: 46,435
- White: 66.9% (31,086)
- Black or African American: 30.2% (14,032)
- American Indian and Alaska Native: 0.2% (107)
- Asian: 0.1% (52)
- Native Hawaiian and other Pacific Islander: 0.0% (0)
- 2 or more races: 1.7% (777)
- Some other Race: 0.8% (381)
#38. Winn Parish
- Index: 0.462
- Total population: 14,313
- White: 66.2% (9,471)
- Black or African American: 31.7% (4,533)
- American Indian and Alaska Native: 0.5% (76)
- Asian: 0.0% (0)
- Native Hawaiian and other Pacific Islander: 0.0% (0)
- 2 or more races: 0.8% (117)
- Some other Race: 0.8% (116)
- Total population: 14,313
- White: 66.2% (9,471)
- Black or African American: 31.7% (4,533)
- American Indian and Alaska Native: 0.5% (76)
- Asian: 0.0% (0)
- Native Hawaiian and other Pacific Islander: 0.0% (0)
- 2 or more races: 0.8% (117)
- Some other Race: 0.8% (116)
#37. Tangipahoa Parish
- Index: 0.462
- Total population: 132,057
- White: 67.1% (88,627)
- Black or African American: 29.5% (38,910)
- American Indian and Alaska Native: 0.3% (341)
- Asian: 0.7% (989)
- Native Hawaiian and other Pacific Islander: 0.0% (0)
- 2 or more races: 2.1% (2,815)
- Some other Race: 0.3% (375)
- Total population: 132,057
- White: 67.1% (88,627)
- Black or African American: 29.5% (38,910)
- American Indian and Alaska Native: 0.3% (341)
- Asian: 0.7% (989)
- Native Hawaiian and other Pacific Islander: 0.0% (0)
- 2 or more races: 2.1% (2,815)
- Some other Race: 0.3% (375)
#36. Evangeline Parish
- Index: 0.463
- Total population: 33,589
- White: 67.9% (22,794)
- Black or African American: 27.6% (9,273)
- American Indian and Alaska Native: 0.3% (116)
- Asian: 0.5% (158)
- Native Hawaiian and other Pacific Islander: 0.1% (21)
- 2 or more races: 1.5% (501)
- Some other Race: 2.2% (726)
- Total population: 33,589
- White: 67.9% (22,794)
- Black or African American: 27.6% (9,273)
- American Indian and Alaska Native: 0.3% (116)
- Asian: 0.5% (158)
- Native Hawaiian and other Pacific Islander: 0.1% (21)
- 2 or more races: 1.5% (501)
- Some other Race: 2.2% (726)
#35. St. Bernard Parish
- Index: 0.463
- Total population: 46,266
- White: 69.4% (32,097)
- Black or African American: 23.3% (10,757)
- American Indian and Alaska Native: 0.4% (169)
- Asian: 2.5% (1,170)
- Native Hawaiian and other Pacific Islander: 0.1% (35)
- 2 or more races: 2.4% (1,132)
- Some other Race: 2.0% (906)
- Total population: 46,266
- White: 69.4% (32,097)
- Black or African American: 23.3% (10,757)
- American Indian and Alaska Native: 0.4% (169)
- Asian: 2.5% (1,170)
- Native Hawaiian and other Pacific Islander: 0.1% (35)
- 2 or more races: 2.4% (1,132)
- Some other Race: 2.0% (906)
#34. Terrebonne Parish
- Index: 0.466
- Total population: 112,054
- White: 70.2% (78,715)
- Black or African American: 19.0% (21,311)
- American Indian and Alaska Native: 5.7% (6,337)
- Asian: 1.0% (1,111)
- Native Hawaiian and other Pacific Islander: 0.1% (64)
- 2 or more races: 2.7% (2,991)
- Some other Race: 1.4% (1,525)
- Total population: 112,054
- White: 70.2% (78,715)
- Black or African American: 19.0% (21,311)
- American Indian and Alaska Native: 5.7% (6,337)
- Asian: 1.0% (1,111)
- Native Hawaiian and other Pacific Islander: 0.1% (64)
- 2 or more races: 2.7% (2,991)
- Some other Race: 1.4% (1,525)
#33. St. Martin Parish
- Index: 0.469
- Total population: 53,732
- White: 66.8% (35,874)
- Black or African American: 29.1% (15,629)
- American Indian and Alaska Native: 0.6% (314)
- Asian: 1.0% (536)
- Native Hawaiian and other Pacific Islander: 0.0% (0)
- 2 or more races: 2.1% (1,123)
- Some other Race: 0.5% (256)
- Total population: 53,732
- White: 66.8% (35,874)
- Black or African American: 29.1% (15,629)
- American Indian and Alaska Native: 0.6% (314)
- Asian: 1.0% (536)
- Native Hawaiian and other Pacific Islander: 0.0% (0)
- 2 or more races: 2.1% (1,123)
- Some other Race: 0.5% (256)
#32. Madison Parish
- Index: 0.469
- Total population: 11,306
- White: 35.3% (3,995)
- Black or African American: 63.7% (7,202)
- American Indian and Alaska Native: 0.2% (17)
- Asian: 0.0% (0)
- Native Hawaiian and other Pacific Islander: 0.0% (0)
- 2 or more races: 0.3% (34)
- Some other Race: 0.5% (58)
- Total population: 11,306
- White: 35.3% (3,995)
- Black or African American: 63.7% (7,202)
- American Indian and Alaska Native: 0.2% (17)
- Asian: 0.0% (0)
- Native Hawaiian and other Pacific Islander: 0.0% (0)
- 2 or more races: 0.3% (34)
- Some other Race: 0.5% (58)
#31. Webster Parish
- Index: 0.478
- Total population: 39,242
- White: 63.7% (24,993)
- Black or African American: 34.0% (13,346)
- American Indian and Alaska Native: 0.4% (164)
- Asian: 0.3% (106)
- Native Hawaiian and other Pacific Islander: 0.1% (51)
- 2 or more races: 1.4% (557)
- Some other Race: 0.1% (25)
- Total population: 39,242
- White: 63.7% (24,993)
- Black or African American: 34.0% (13,346)
- American Indian and Alaska Native: 0.4% (164)
- Asian: 0.3% (106)
- Native Hawaiian and other Pacific Islander: 0.1% (51)
- 2 or more races: 1.4% (557)
- Some other Race: 0.1% (25)
#30. Sabine Parish
- Index: 0.485
- Total population: 23,991
- White: 69.3% (16,626)
- Black or African American: 16.0% (3,834)
- American Indian and Alaska Native: 6.6% (1,590)
- Asian: 0.4% (86)
- Native Hawaiian and other Pacific Islander: 0.0% (8)
- 2 or more races: 7.1% (1,701)
- Some other Race: 0.6% (146)
- Total population: 23,991
- White: 69.3% (16,626)
- Black or African American: 16.0% (3,834)
- American Indian and Alaska Native: 6.6% (1,590)
- Asian: 0.4% (86)
- Native Hawaiian and other Pacific Islander: 0.0% (8)
- 2 or more races: 7.1% (1,701)
- Some other Race: 0.6% (146)
#29. Avoyelles Parish
- Index: 0.485
- Total population: 40,669
- White: 66.3% (26,967)
- Black or African American: 26.9% (10,942)
- American Indian and Alaska Native: 0.9% (362)
- Asian: 0.5% (214)
- Native Hawaiian and other Pacific Islander: 0.2% (81)
- 2 or more races: 4.9% (1,973)
- Some other Race: 0.3% (130)
- Total population: 40,669
- White: 66.3% (26,967)
- Black or African American: 26.9% (10,942)
- American Indian and Alaska Native: 0.9% (362)
- Asian: 0.5% (214)
- Native Hawaiian and other Pacific Islander: 0.2% (81)
- 2 or more races: 4.9% (1,973)
- Some other Race: 0.3% (130)
#28. Richland Parish
- Index: 0.486
- Total population: 20,350
- White: 61.9% (12,604)
- Black or African American: 36.1% (7,339)
- American Indian and Alaska Native: 0.0% (3)
- Asian: 0.4% (78)
- Native Hawaiian and other Pacific Islander: 0.0% (0)
- 2 or more races: 1.3% (264)
- Some other Race: 0.3% (62)
- Total population: 20,350
- White: 61.9% (12,604)
- Black or African American: 36.1% (7,339)
- American Indian and Alaska Native: 0.0% (3)
- Asian: 0.4% (78)
- Native Hawaiian and other Pacific Islander: 0.0% (0)
- 2 or more races: 1.3% (264)
- Some other Race: 0.3% (62)
#27. Pointe Coupee Parish
- Index: 0.488
- Total population: 22,016
- White: 61.9% (13,636)
- Black or African American: 35.8% (7,873)
- American Indian and Alaska Native: 0.0% (0)
- Asian: 0.3% (56)
- Native Hawaiian and other Pacific Islander: 0.0% (0)
- 2 or more races: 0.9% (209)
- Some other Race: 1.1% (242)
- Total population: 22,016
- White: 61.9% (13,636)
- Black or African American: 35.8% (7,873)
- American Indian and Alaska Native: 0.0% (0)
- Asian: 0.3% (56)
- Native Hawaiian and other Pacific Islander: 0.0% (0)
- 2 or more races: 0.9% (209)
- Some other Race: 1.1% (242)
#26. Plaquemines Parish
- Index: 0.493
- Total population: 23,338
- White: 67.9% (15,858)
- Black or African American: 20.3% (4,733)
- American Indian and Alaska Native: 1.1% (256)
- Asian: 3.9% (901)
- Native Hawaiian and other Pacific Islander: 0.0% (8)
- 2 or more races: 5.0% (1,156)
- Some other Race: 1.8% (426)
- Total population: 23,338
- White: 67.9% (15,858)
- Black or African American: 20.3% (4,733)
- American Indian and Alaska Native: 1.1% (256)
- Asian: 3.9% (901)
- Native Hawaiian and other Pacific Islander: 0.0% (8)
- 2 or more races: 5.0% (1,156)
- Some other Race: 1.8% (426)
#25. De Soto Parish
- Index: 0.497
- Total population: 27,289
- White: 61.5% (16,770)
- Black or African American: 35.4% (9,663)
- American Indian and Alaska Native: 0.9% (254)
- Asian: 0.1% (27)
- Native Hawaiian and other Pacific Islander: 0.0% (11)
- 2 or more races: 2.0% (538)
- Some other Race: 0.1% (26)
- Total population: 27,289
- White: 61.5% (16,770)
- Black or African American: 35.4% (9,663)
- American Indian and Alaska Native: 0.9% (254)
- Asian: 0.1% (27)
- Native Hawaiian and other Pacific Islander: 0.0% (11)
- 2 or more races: 2.0% (538)
- Some other Race: 0.1% (26)
#24. Concordia Parish
- Index: 0.497
- Total population: 19,778
- White: 57.8% (11,433)
- Black or African American: 41.1% (8,133)
- American Indian and Alaska Native: 0.0% (1)
- Asian: 0.1% (29)
- Native Hawaiian and other Pacific Islander: 0.0% (0)
- 2 or more races: 0.2% (48)
- Some other Race: 0.7% (134)
- Total population: 19,778
- White: 57.8% (11,433)
- Black or African American: 41.1% (8,133)
- American Indian and Alaska Native: 0.0% (1)
- Asian: 0.1% (29)
- Native Hawaiian and other Pacific Islander: 0.0% (0)
- 2 or more races: 0.2% (48)
- Some other Race: 0.7% (134)
#23. Rapides Parish
- Index: 0.497
- Total population: 130,970
- White: 63.5% (83,120)
- Black or African American: 31.6% (41,341)
- American Indian and Alaska Native: 0.8% (999)
- Asian: 1.3% (1,721)
- Native Hawaiian and other Pacific Islander: 0.0% (10)
- 2 or more races: 2.3% (2,996)
- Some other Race: 0.6% (783)
- Total population: 130,970
- White: 63.5% (83,120)
- Black or African American: 31.6% (41,341)
- American Indian and Alaska Native: 0.8% (999)
- Asian: 1.3% (1,721)
- Native Hawaiian and other Pacific Islander: 0.0% (10)
- 2 or more races: 2.3% (2,996)
- Some other Race: 0.6% (783)
#22. West Baton Rouge Parish
- Index: 0.499
- Total population: 26,101
- White: 58.3% (15,222)
- Black or African American: 40.1% (10,458)
- American Indian and Alaska Native: 0.1% (21)
- Asian: 0.1% (16)
- Native Hawaiian and other Pacific Islander: 0.0% (0)
- 2 or more races: 1.2% (302)
- Some other Race: 0.3% (82)
- Total population: 26,101
- White: 58.3% (15,222)
- Black or African American: 40.1% (10,458)
- American Indian and Alaska Native: 0.1% (21)
- Asian: 0.1% (16)
- Native Hawaiian and other Pacific Islander: 0.0% (0)
- 2 or more races: 1.2% (302)
- Some other Race: 0.3% (82)
#21. Tensas Parish
- Index: 0.505
- Total population: 4,561
- White: 43.4% (1,979)
- Black or African American: 55.4% (2,525)
- American Indian and Alaska Native: 0.0% (0)
- Asian: 0.1% (5)
- Native Hawaiian and other Pacific Islander: 0.0% (0)
- 2 or more races: 0.0% (2)
- Some other Race: 1.1% (50)
- Total population: 4,561
- White: 43.4% (1,979)
- Black or African American: 55.4% (2,525)
- American Indian and Alaska Native: 0.0% (0)
- Asian: 0.1% (5)
- Native Hawaiian and other Pacific Islander: 0.0% (0)
- 2 or more races: 0.0% (2)
- Some other Race: 1.1% (50)
#20. Ouachita Parish
- Index: 0.510
- Total population: 155,494
- White: 59.1% (91,884)
- Black or African American: 37.4% (58,219)
- American Indian and Alaska Native: 0.2% (246)
- Asian: 1.0% (1,558)
- Native Hawaiian and other Pacific Islander: 0.0% (68)
- 2 or more races: 1.2% (1,939)
- Some other Race: 1.0% (1,580)
- Total population: 155,494
- White: 59.1% (91,884)
- Black or African American: 37.4% (58,219)
- American Indian and Alaska Native: 0.2% (246)
- Asian: 1.0% (1,558)
- Native Hawaiian and other Pacific Islander: 0.0% (68)
- 2 or more races: 1.2% (1,939)
- Some other Race: 1.0% (1,580)
#19. Red River Parish
- Index: 0.513
- Total population: 8,565
- White: 57.7% (4,945)
- Black or African American: 39.1% (3,350)
- American Indian and Alaska Native: 0.0% (0)
- Asian: 0.0% (0)
- Native Hawaiian and other Pacific Islander: 0.0% (0)
- 2 or more races: 3.0% (258)
- Some other Race: 0.1% (12)
- Total population: 8,565
- White: 57.7% (4,945)
- Black or African American: 39.1% (3,350)
- American Indian and Alaska Native: 0.0% (0)
- Asian: 0.0% (0)
- Native Hawaiian and other Pacific Islander: 0.0% (0)
- 2 or more races: 3.0% (258)
- Some other Race: 0.1% (12)
#18. East Feliciana Parish
- Index: 0.513
- Total population: 19,371
- White: 54.5% (10,556)
- Black or African American: 43.6% (8,441)
- American Indian and Alaska Native: 0.5% (98)
- Asian: 0.3% (66)
- Native Hawaiian and other Pacific Islander: 0.0% (0)
- 2 or more races: 0.9% (171)
- Some other Race: 0.2% (39)
- Total population: 19,371
- White: 54.5% (10,556)
- Black or African American: 43.6% (8,441)
- American Indian and Alaska Native: 0.5% (98)
- Asian: 0.3% (66)
- Native Hawaiian and other Pacific Islander: 0.0% (0)
- 2 or more races: 0.9% (171)
- Some other Race: 0.2% (39)
#17. St. Landry Parish
- Index: 0.513
- Total population: 83,172
- White: 56.0% (46,586)
- Black or African American: 41.5% (34,551)
- American Indian and Alaska Native: 0.2% (172)
- Asian: 0.1% (60)
- Native Hawaiian and other Pacific Islander: 0.0% (0)
- 2 or more races: 1.6% (1,309)
- Some other Race: 0.6% (494)
- Total population: 83,172
- White: 56.0% (46,586)
- Black or African American: 41.5% (34,551)
- American Indian and Alaska Native: 0.2% (172)
- Asian: 0.1% (60)
- Native Hawaiian and other Pacific Islander: 0.0% (0)
- 2 or more races: 1.6% (1,309)
- Some other Race: 0.6% (494)
#16. Bienville Parish
- Index: 0.513
- Total population: 13,564
- White: 54.8% (7,428)
- Black or African American: 43.2% (5,858)
- American Indian and Alaska Native: 0.0% (6)
- Asian: 0.0% (5)
- Native Hawaiian and other Pacific Islander: 0.0% (0)
- 2 or more races: 0.9% (121)
- Some other Race: 1.1% (146)
- Total population: 13,564
- White: 54.8% (7,428)
- Black or African American: 43.2% (5,858)
- American Indian and Alaska Native: 0.0% (6)
- Asian: 0.0% (5)
- Native Hawaiian and other Pacific Islander: 0.0% (0)
- 2 or more races: 0.9% (121)
- Some other Race: 1.1% (146)
#15. Morehouse Parish
- Index: 0.514
- Total population: 25,610
- White: 49.4% (12,664)
- Black or African American: 49.1% (12,583)
- American Indian and Alaska Native: 0.1% (29)
- Asian: 0.5% (129)
- Native Hawaiian and other Pacific Islander: 0.0% (0)
- 2 or more races: 0.5% (132)
- Some other Race: 0.3% (73)
- Total population: 25,610
- White: 49.4% (12,664)
- Black or African American: 49.1% (12,583)
- American Indian and Alaska Native: 0.1% (29)
- Asian: 0.5% (129)
- Native Hawaiian and other Pacific Islander: 0.0% (0)
- 2 or more races: 0.5% (132)
- Some other Race: 0.3% (73)
#14. St. Helena Parish
- Index: 0.515
- Total population: 10,297
- White: 45.7% (4,709)
- Black or African American: 52.5% (5,409)
- American Indian and Alaska Native: 1.1% (114)
- Asian: 0.3% (26)
- Native Hawaiian and other Pacific Islander: 0.0% (0)
- 2 or more races: 0.2% (18)
- Some other Race: 0.2% (21)
- Total population: 10,297
- White: 45.7% (4,709)
- Black or African American: 52.5% (5,409)
- American Indian and Alaska Native: 1.1% (114)
- Asian: 0.3% (26)
- Native Hawaiian and other Pacific Islander: 0.0% (0)
- 2 or more races: 0.2% (18)
- Some other Race: 0.2% (21)
#13. West Feliciana Parish
- Index: 0.516
- Total population: 15,428
- White: 53.5% (8,250)
- Black or African American: 44.5% (6,861)
- American Indian and Alaska Native: 0.2% (30)
- Asian: 0.6% (94)
- Native Hawaiian and other Pacific Islander: 0.0% (0)
- 2 or more races: 1.1% (174)
- Some other Race: 0.1% (19)
- Total population: 15,428
- White: 53.5% (8,250)
- Black or African American: 44.5% (6,861)
- American Indian and Alaska Native: 0.2% (30)
- Asian: 0.6% (94)
- Native Hawaiian and other Pacific Islander: 0.0% (0)
- 2 or more races: 1.1% (174)
- Some other Race: 0.1% (19)
#12. St. James Parish
- Index: 0.517
- Total population: 21,308
- White: 48.6% (10,366)
- Black or African American: 49.6% (10,565)
- American Indian and Alaska Native: 0.0% (0)
- Asian: 0.2% (35)
- Native Hawaiian and other Pacific Islander: 0.2% (43)
- 2 or more races: 0.5% (117)
- Some other Race: 0.9% (182)
- Total population: 21,308
- White: 48.6% (10,366)
- Black or African American: 49.6% (10,565)
- American Indian and Alaska Native: 0.0% (0)
- Asian: 0.2% (35)
- Native Hawaiian and other Pacific Islander: 0.2% (43)
- 2 or more races: 0.5% (117)
- Some other Race: 0.9% (182)
#11. Iberville Parish
- Index: 0.521
- Total population: 32,822
- White: 49.6% (16,282)
- Black or African American: 48.2% (15,833)
- American Indian and Alaska Native: 0.1% (26)
- Asian: 0.0% (14)
- Native Hawaiian and other Pacific Islander: 0.0% (0)
- 2 or more races: 1.5% (500)
- Some other Race: 0.5% (167)
- Total population: 32,822
- White: 49.6% (16,282)
- Black or African American: 48.2% (15,833)
- American Indian and Alaska Native: 0.1% (26)
- Asian: 0.0% (14)
- Native Hawaiian and other Pacific Islander: 0.0% (0)
- 2 or more races: 1.5% (500)
- Some other Race: 0.5% (167)
#10. Claiborne Parish
- Index: 0.522
- Total population: 15,985
- White: 45.5% (7,279)
- Black or African American: 52.0% (8,314)
- American Indian and Alaska Native: 0.3% (46)
- Asian: 0.1% (22)
- Native Hawaiian and other Pacific Islander: 0.0% (0)
- 2 or more races: 1.2% (198)
- Some other Race: 0.8% (126)
- Total population: 15,985
- White: 45.5% (7,279)
- Black or African American: 52.0% (8,314)
- American Indian and Alaska Native: 0.3% (46)
- Asian: 0.1% (22)
- Native Hawaiian and other Pacific Islander: 0.0% (0)
- 2 or more races: 1.2% (198)
- Some other Race: 0.8% (126)
#9. Orleans Parish
- Index: 0.529
- Total population: 390,845
- White: 33.9% (132,643)
- Black or African American: 59.5% (232,660)
- American Indian and Alaska Native: 0.2% (763)
- Asian: 2.9% (11,361)
- Native Hawaiian and other Pacific Islander: 0.0% (62)
- 2 or more races: 1.9% (7,500)
- Some other Race: 1.5% (5,856)
- Total population: 390,845
- White: 33.9% (132,643)
- Black or African American: 59.5% (232,660)
- American Indian and Alaska Native: 0.2% (763)
- Asian: 2.9% (11,361)
- Native Hawaiian and other Pacific Islander: 0.0% (62)
- 2 or more races: 1.9% (7,500)
- Some other Race: 1.5% (5,856)
#8. Iberia Parish
- Index: 0.529
- Total population: 71,887
- White: 60.7% (43,640)
- Black or African American: 31.7% (22,780)
- American Indian and Alaska Native: 0.1% (75)
- Asian: 2.7% (1,967)
- Native Hawaiian and other Pacific Islander: 0.0% (0)
- 2 or more races: 3.0% (2,173)
- Some other Race: 1.7% (1,252)
- Total population: 71,887
- White: 60.7% (43,640)
- Black or African American: 31.7% (22,780)
- American Indian and Alaska Native: 0.1% (75)
- Asian: 2.7% (1,967)
- Native Hawaiian and other Pacific Islander: 0.0% (0)
- 2 or more races: 3.0% (2,173)
- Some other Race: 1.7% (1,252)
#7. St. John the Baptist Parish
- Index: 0.534
- Total population: 43,242
- White: 38.2% (16,501)
- Black or African American: 56.5% (24,433)
- American Indian and Alaska Native: 0.0% (0)
- Asian: 1.1% (482)
- Native Hawaiian and other Pacific Islander: 0.0% (0)
- 2 or more races: 1.5% (663)
- Some other Race: 2.7% (1,163)
- Total population: 43,242
- White: 38.2% (16,501)
- Black or African American: 56.5% (24,433)
- American Indian and Alaska Native: 0.0% (0)
- Asian: 1.1% (482)
- Native Hawaiian and other Pacific Islander: 0.0% (0)
- 2 or more races: 1.5% (663)
- Some other Race: 2.7% (1,163)
#6. Jefferson Parish
- Index: 0.534
- Total population: 434,850
- White: 62.4% (271,300)
- Black or African American: 27.0% (117,314)
- American Indian and Alaska Native: 0.4% (1,753)
- Asian: 4.2% (18,260)
- Native Hawaiian and other Pacific Islander: 0.0% (43)
- 2 or more races: 2.2% (9,702)
- Some other Race: 3.8% (16,478)
- Total population: 434,850
- White: 62.4% (271,300)
- Black or African American: 27.0% (117,314)
- American Indian and Alaska Native: 0.4% (1,753)
- Asian: 4.2% (18,260)
- Native Hawaiian and other Pacific Islander: 0.0% (43)
- 2 or more races: 2.2% (9,702)
- Some other Race: 3.8% (16,478)
#5. Lincoln Parish
- Index: 0.538
- Total population: 47,246
- White: 54.2% (25,624)
- Black or African American: 40.9% (19,307)
- American Indian and Alaska Native: 0.2% (117)
- Asian: 1.7% (789)
- Native Hawaiian and other Pacific Islander: 0.0% (1)
- 2 or more races: 1.1% (541)
- Some other Race: 1.8% (867)
- Total population: 47,246
- White: 54.2% (25,624)
- Black or African American: 40.9% (19,307)
- American Indian and Alaska Native: 0.2% (117)
- Asian: 1.7% (789)
- Native Hawaiian and other Pacific Islander: 0.0% (1)
- 2 or more races: 1.1% (541)
- Some other Race: 1.8% (867)
#4. Caddo Parish
- Index: 0.544
- Total population: 245,831
- White: 46.2% (113,489)
- Black or African American: 49.2% (120,925)
- American Indian and Alaska Native: 0.4% (933)
- Asian: 1.3% (3,166)
- Native Hawaiian and other Pacific Islander: 0.1% (123)
- 2 or more races: 2.0% (5,027)
- Some other Race: 0.9% (2,168)
- Total population: 245,831
- White: 46.2% (113,489)
- Black or African American: 49.2% (120,925)
- American Indian and Alaska Native: 0.4% (933)
- Asian: 1.3% (3,166)
- Native Hawaiian and other Pacific Islander: 0.1% (123)
- 2 or more races: 2.0% (5,027)
- Some other Race: 0.9% (2,168)
#3. Natchitoches Parish
- Index: 0.545
- Total population: 38,769
- White: 53.3% (20,665)
- Black or African American: 41.3% (15,996)
- American Indian and Alaska Native: 0.8% (317)
- Asian: 0.7% (285)
- Native Hawaiian and other Pacific Islander: 0.0% (0)
- 2 or more races: 1.8% (708)
- Some other Race: 2.1% (798)
- Total population: 38,769
- White: 53.3% (20,665)
- Black or African American: 41.3% (15,996)
- American Indian and Alaska Native: 0.8% (317)
- Asian: 0.7% (285)
- Native Hawaiian and other Pacific Islander: 0.0% (0)
- 2 or more races: 1.8% (708)
- Some other Race: 2.1% (798)
#2. St. Mary Parish
- Index: 0.557
- Total population: 50,968
- White: 58.9% (30,016)
- Black or African American: 30.5% (15,531)
- American Indian and Alaska Native: 1.6% (836)
- Asian: 1.4% (734)
- Native Hawaiian and other Pacific Islander: 0.0% (11)
- 2 or more races: 4.3% (2,191)
- Some other Race: 3.2% (1,649)
- Total population: 50,968
- White: 58.9% (30,016)
- Black or African American: 30.5% (15,531)
- American Indian and Alaska Native: 1.6% (836)
- Asian: 1.4% (734)
- Native Hawaiian and other Pacific Islander: 0.0% (11)
- 2 or more races: 4.3% (2,191)
- Some other Race: 3.2% (1,649)
#1. East Baton Rouge Parish
- Index: 0.566
- Total population: 443,763
- White: 46.8% (207,835)
- Black or African American: 46.1% (204,562)
- American Indian and Alaska Native: 0.2% (795)
- Asian: 3.2% (14,125)
- Native Hawaiian and other Pacific Islander: 0.0% (205)
- 2 or more races: 1.9% (8,240)
- Some other Race: 1.8% (8,001)
- Total population: 443,763
- White: 46.8% (207,835)
- Black or African American: 46.1% (204,562)
- American Indian and Alaska Native: 0.2% (795)
- Asian: 3.2% (14,125)
- Native Hawaiian and other Pacific Islander: 0.0% (205)
- 2 or more races: 1.9% (8,240)
- Some other Race: 1.8% (8,001)


