Counties in California where people spend most of their paycheck on housing
Counties in California where people spend most of their paycheck on housing
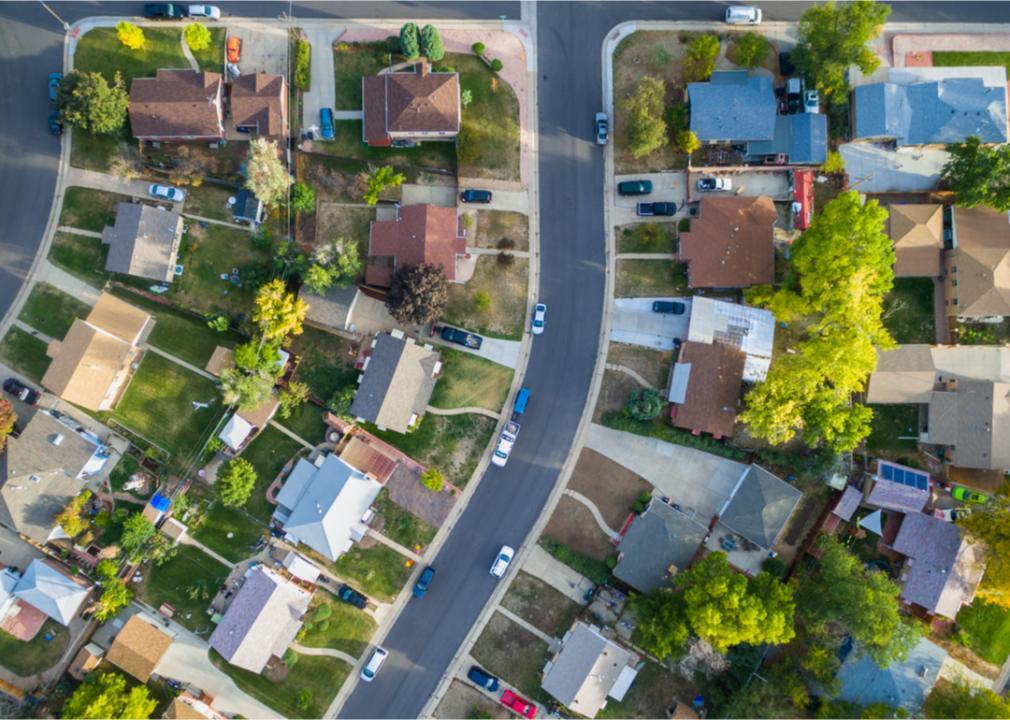
It's no secret that many Americans are forgoing homeownership in favor of renting. In 2020, renters in the U.S. occupied 43 million housing units.
The Stacker team looked at data from a United States Census survey that revealed an estimated 43,378,800 renter-occupied homes in the United States as of 2017, which makes up 36.1% of all households in the country. In 2019, renting was more affordable than buying a median-priced home in 59% of the counties; in 2021, the opposite was true: Owning was more affordable than renting in 63% of U.S. counties.
Stacker compiled a list of counties in California where people spend the highest percent of income on rent using data from the U.S. Census Bureau. Of course, saving money by owning a home is unattainable for many Americans who don't have savings that could cover a down payment, those who are denied a mortgage, or both. Keep reading to see where in your home state most of people's take-home pay goes to their monthly rent.
You may also like: States sending the most people to California
#50. Glenn County
- Median percent of income spent on housing: 21.2%
--- Percent of households spending <20% of income on housing: 39.6%
--- Percent of households spending >30% of income on housing: 32.1%
- Total occupied households: 10,085
- Median household income: $49,633
- Median monthly housing cost: $876
#49. Siskiyou County
- Median percent of income spent on housing: 21.4%
--- Percent of households spending <20% of income on housing: 44.7%
--- Percent of households spending >30% of income on housing: 33.2%
- Total occupied households: 19,240
- Median household income: $45,241
- Median monthly housing cost: $806
#48. Del Norte County
- Median percent of income spent on housing: 21.5%
--- Percent of households spending <20% of income on housing: 43.7%
--- Percent of households spending >30% of income on housing: 34.3%
- Total occupied households: 9,945
- Median household income: $45,283
- Median monthly housing cost: $813
#47. Mariposa County
- Median percent of income spent on housing: 21.7%
--- Percent of households spending <20% of income on housing: 40.8%
--- Percent of households spending >30% of income on housing: 34.4%
- Total occupied households: 7,643
- Median household income: $48,820
- Median monthly housing cost: $882
#46. Kings County
- Median percent of income spent on housing: 21.9%
--- Percent of households spending <20% of income on housing: 40.7%
--- Percent of households spending >30% of income on housing: 33.8%
- Total occupied households: 43,452
- Median household income: $57,848
- Median monthly housing cost: $1,057
You may also like: Most popular girl names in the 80s in California
#45. Amador County
- Median percent of income spent on housing: 21.9%
--- Percent of households spending <20% of income on housing: 41.4%
--- Percent of households spending >30% of income on housing: 33.4%
- Total occupied households: 14,594
- Median household income: $62,772
- Median monthly housing cost: $1,147
#44. San Francisco County
- Median percent of income spent on housing: 22.2%
--- Percent of households spending <20% of income on housing: 42.6%
--- Percent of households spending >30% of income on housing: 33.0%
- Total occupied households: 362,354
- Median household income: $112,449
- Median monthly housing cost: $2,081
#43. Tuolumne County
- Median percent of income spent on housing: 22.5%
--- Percent of households spending <20% of income on housing: 39.0%
--- Percent of households spending >30% of income on housing: 35.9%
- Total occupied households: 22,502
- Median household income: $60,108
- Median monthly housing cost: $1,129
#42. El Dorado County
- Median percent of income spent on housing: 22.9%
--- Percent of households spending <20% of income on housing: 39.6%
--- Percent of households spending >30% of income on housing: 34.6%
- Total occupied households: 70,974
- Median household income: $83,377
- Median monthly housing cost: $1,590
#41. Sutter County
- Median percent of income spent on housing: 23.0%
--- Percent of households spending <20% of income on housing: 38.9%
--- Percent of households spending >30% of income on housing: 35.4%
- Total occupied households: 32,636
- Median household income: $59,050
- Median monthly housing cost: $1,134
You may also like: Most popular boy names in the 80s in California
#40. Santa Clara County
- Median percent of income spent on housing: 23.3%
--- Percent of households spending <20% of income on housing: 39.6%
--- Percent of households spending >30% of income on housing: 35.2%
- Total occupied households: 640,215
- Median household income: $124,055
- Median monthly housing cost: $2,404
#39. Madera County
- Median percent of income spent on housing: 23.3%
--- Percent of households spending <20% of income on housing: 40.6%
--- Percent of households spending >30% of income on housing: 34.8%
- Total occupied households: 44,881
- Median household income: $57,585
- Median monthly housing cost: $1,117
#38. Yuba County
- Median percent of income spent on housing: 23.4%
--- Percent of households spending <20% of income on housing: 37.2%
--- Percent of households spending >30% of income on housing: 36.5%
- Total occupied households: 26,354
- Median household income: $58,054
- Median monthly housing cost: $1,134
#37. Placer County
- Median percent of income spent on housing: 23.5%
--- Percent of households spending <20% of income on housing: 38.2%
--- Percent of households spending >30% of income on housing: 34.5%
- Total occupied households: 142,855
- Median household income: $89,691
- Median monthly housing cost: $1,759
#36. Shasta County
- Median percent of income spent on housing: 23.6%
--- Percent of households spending <20% of income on housing: 39.7%
--- Percent of households spending >30% of income on housing: 36.6%
- Total occupied households: 71,181
- Median household income: $54,667
- Median monthly housing cost: $1,074
You may also like: Highest-earning counties in California
#35. Imperial County
- Median percent of income spent on housing: 23.6%
--- Percent of households spending <20% of income on housing: 37.6%
--- Percent of households spending >30% of income on housing: 37.9%
- Total occupied households: 44,829
- Median household income: $47,622
- Median monthly housing cost: $936
#34. Merced County
- Median percent of income spent on housing: 23.8%
--- Percent of households spending <20% of income on housing: 37.7%
--- Percent of households spending >30% of income on housing: 35.4%
- Total occupied households: 80,008
- Median household income: $53,672
- Median monthly housing cost: $1,066
#33. Contra Costa County
- Median percent of income spent on housing: 24.2%
--- Percent of households spending <20% of income on housing: 37.7%
--- Percent of households spending >30% of income on housing: 36.6%
- Total occupied households: 394,769
- Median household income: $99,716
- Median monthly housing cost: $2,013
#32. Butte County
- Median percent of income spent on housing: 24.2%
--- Percent of households spending <20% of income on housing: 37.1%
--- Percent of households spending >30% of income on housing: 38.6%
- Total occupied households: 85,320
- Median household income: $52,537
- Median monthly housing cost: $1,061
#31. Napa County
- Median percent of income spent on housing: 24.3%
--- Percent of households spending <20% of income on housing: 37.1%
--- Percent of households spending >30% of income on housing: 36.8%
- Total occupied households: 48,705
- Median household income: $88,596
- Median monthly housing cost: $1,791
You may also like: Fastest-growing counties in California
#30. Kern County
- Median percent of income spent on housing: 24.3%
--- Percent of households spending <20% of income on housing: 37.8%
--- Percent of households spending >30% of income on housing: 37.8%
- Total occupied households: 270,282
- Median household income: $53,350
- Median monthly housing cost: $1,080
#29. Lake County
- Median percent of income spent on housing: 24.3%
--- Percent of households spending <20% of income on housing: 35.8%
--- Percent of households spending >30% of income on housing: 36.1%
- Total occupied households: 25,660
- Median household income: $47,040
- Median monthly housing cost: $953
#28. San Mateo County
- Median percent of income spent on housing: 24.3%
--- Percent of households spending <20% of income on housing: 39.0%
--- Percent of households spending >30% of income on housing: 36.3%
- Total occupied households: 263,543
- Median household income: $122,641
- Median monthly housing cost: $2,486
#27. Alameda County
- Median percent of income spent on housing: 24.4%
--- Percent of households spending <20% of income on housing: 36.2%
--- Percent of households spending >30% of income on housing: 37.1%
- Total occupied households: 577,177
- Median household income: $99,406
- Median monthly housing cost: $2,018
#26. Stanislaus County
- Median percent of income spent on housing: 24.4%
--- Percent of households spending <20% of income on housing: 36.9%
--- Percent of households spending >30% of income on housing: 37.5%
- Total occupied households: 173,898
- Median household income: $60,704
- Median monthly housing cost: $1,235
You may also like: Highest-rated Class of 2021 football recruits from California
#25. Fresno County
- Median percent of income spent on housing: 24.6%
--- Percent of households spending <20% of income on housing: 36.0%
--- Percent of households spending >30% of income on housing: 38.7%
- Total occupied households: 307,906
- Median household income: $53,969
- Median monthly housing cost: $1,106
#24. Sacramento County
- Median percent of income spent on housing: 24.6%
--- Percent of households spending <20% of income on housing: 36.0%
--- Percent of households spending >30% of income on housing: 37.9%
- Total occupied households: 543,025
- Median household income: $67,151
- Median monthly housing cost: $1,379
#23. Yolo County
- Median percent of income spent on housing: 24.7%
--- Percent of households spending <20% of income on housing: 37.1%
--- Percent of households spending >30% of income on housing: 36.1%
- Total occupied households: 74,296
- Median household income: $70,228
- Median monthly housing cost: $1,444
#22. Tulare County
- Median percent of income spent on housing: 24.8%
--- Percent of households spending <20% of income on housing: 37.0%
--- Percent of households spending >30% of income on housing: 39.4%
- Total occupied households: 138,238
- Median household income: $49,687
- Median monthly housing cost: $1,026
#21. Mono County
- Median percent of income spent on housing: 24.9%
--- Percent of households spending <20% of income on housing: 35.7%
--- Percent of households spending >30% of income on housing: 29.8%
- Total occupied households: 4,765
- Median household income: $62,260
- Median monthly housing cost: $1,292
You may also like: Counties with the worst commutes in California
#20. Solano County
- Median percent of income spent on housing: 25.1%
--- Percent of households spending <20% of income on housing: 35.6%
--- Percent of households spending >30% of income on housing: 37.0%
- Total occupied households: 149,865
- Median household income: $81,472
- Median monthly housing cost: $1,701
#19. Marin County
- Median percent of income spent on housing: 25.1%
--- Percent of households spending <20% of income on housing: 37.0%
--- Percent of households spending >30% of income on housing: 39.0%
- Total occupied households: 105,432
- Median household income: $115,246
- Median monthly housing cost: $2,412
#18. Tehama County
- Median percent of income spent on housing: 25.2%
--- Percent of households spending <20% of income on housing: 35.8%
--- Percent of households spending >30% of income on housing: 38.4%
- Total occupied households: 24,189
- Median household income: $44,514
- Median monthly housing cost: $934
#17. San Joaquin County
- Median percent of income spent on housing: 25.2%
--- Percent of households spending <20% of income on housing: 35.1%
--- Percent of households spending >30% of income on housing: 38.4%
- Total occupied households: 228,567
- Median household income: $64,432
- Median monthly housing cost: $1,355
#16. San Benito County
- Median percent of income spent on housing: 25.4%
--- Percent of households spending <20% of income on housing: 33.3%
--- Percent of households spending >30% of income on housing: 38.2%
- Total occupied households: 18,135
- Median household income: $86,958
- Median monthly housing cost: $1,840
You may also like: Highest-rated things to do in California, according to Tripadvisor
#15. Sonoma County
- Median percent of income spent on housing: 25.4%
--- Percent of households spending <20% of income on housing: 35.8%
--- Percent of households spending >30% of income on housing: 38.9%
- Total occupied households: 189,374
- Median household income: $81,018
- Median monthly housing cost: $1,717
#14. Calaveras County
- Median percent of income spent on housing: 25.6%
--- Percent of households spending <20% of income on housing: 38.4%
--- Percent of households spending >30% of income on housing: 39.2%
- Total occupied households: 16,942
- Median household income: $63,158
- Median monthly housing cost: $1,349
#13. San Luis Obispo County
- Median percent of income spent on housing: 25.8%
--- Percent of households spending <20% of income on housing: 35.8%
--- Percent of households spending >30% of income on housing: 39.4%
- Total occupied households: 105,981
- Median household income: $73,518
- Median monthly housing cost: $1,578
#12. Humboldt County
- Median percent of income spent on housing: 25.8%
--- Percent of households spending <20% of income on housing: 34.9%
--- Percent of households spending >30% of income on housing: 42.0%
- Total occupied households: 54,679
- Median household income: $48,041
- Median monthly housing cost: $1,034
#11. San Bernardino County
- Median percent of income spent on housing: 25.9%
--- Percent of households spending <20% of income on housing: 34.3%
--- Percent of households spending >30% of income on housing: 40.5%
- Total occupied households: 636,041
- Median household income: $63,362
- Median monthly housing cost: $1,367
You may also like: Best counties to raise a family in California
#10. Nevada County
- Median percent of income spent on housing: 25.9%
--- Percent of households spending <20% of income on housing: 35.9%
--- Percent of households spending >30% of income on housing: 40.2%
- Total occupied households: 40,855
- Median household income: $66,096
- Median monthly housing cost: $1,428
#9. Mendocino County
- Median percent of income spent on housing: 26.1%
--- Percent of households spending <20% of income on housing: 36.9%
--- Percent of households spending >30% of income on housing: 39.3%
- Total occupied households: 34,408
- Median household income: $51,416
- Median monthly housing cost: $1,120
#8. Orange County
- Median percent of income spent on housing: 26.2%
--- Percent of households spending <20% of income on housing: 33.6%
--- Percent of households spending >30% of income on housing: 41.1%
- Total occupied households: 1,037,492
- Median household income: $90,234
- Median monthly housing cost: $1,973
#7. Ventura County
- Median percent of income spent on housing: 26.4%
--- Percent of households spending <20% of income on housing: 34.0%
--- Percent of households spending >30% of income on housing: 40.4%
- Total occupied households: 271,040
- Median household income: $88,131
- Median monthly housing cost: $1,941
#6. Monterey County
- Median percent of income spent on housing: 26.5%
--- Percent of households spending <20% of income on housing: 33.1%
--- Percent of households spending >30% of income on housing: 42.3%
- Total occupied households: 127,155
- Median household income: $71,015
- Median monthly housing cost: $1,569
You may also like: Biggest sources of immigrants to California
#5. Riverside County
- Median percent of income spent on housing: 26.9%
--- Percent of households spending <20% of income on housing: 33.6%
--- Percent of households spending >30% of income on housing: 40.7%
- Total occupied households: 724,893
- Median household income: $67,005
- Median monthly housing cost: $1,502
#4. Santa Barbara County
- Median percent of income spent on housing: 27.0%
--- Percent of households spending <20% of income on housing: 33.5%
--- Percent of households spending >30% of income on housing: 41.4%
- Total occupied households: 145,856
- Median household income: $74,624
- Median monthly housing cost: $1,676
#3. Santa Cruz County
- Median percent of income spent on housing: 27.2%
--- Percent of households spending <20% of income on housing: 34.5%
--- Percent of households spending >30% of income on housing: 41.5%
- Total occupied households: 95,818
- Median household income: $82,234
- Median monthly housing cost: $1,864
#2. San Diego County
- Median percent of income spent on housing: 27.3%
--- Percent of households spending <20% of income on housing: 31.4%
--- Percent of households spending >30% of income on housing: 42.6%
- Total occupied households: 1,125,286
- Median household income: $78,980
- Median monthly housing cost: $1,797
#1. Los Angeles County
- Median percent of income spent on housing: 28.6%
--- Percent of households spending <20% of income on housing: 29.3%
--- Percent of households spending >30% of income on housing: 45.9%
- Total occupied households: 3,316,795
- Median household income: $68,044
- Median monthly housing cost: $1,620
You may also like: Counties with the most college graduates in California