Counties in South Carolina where people spend most of their paycheck on housing
Counties in South Carolina where people spend most of their paycheck on housing
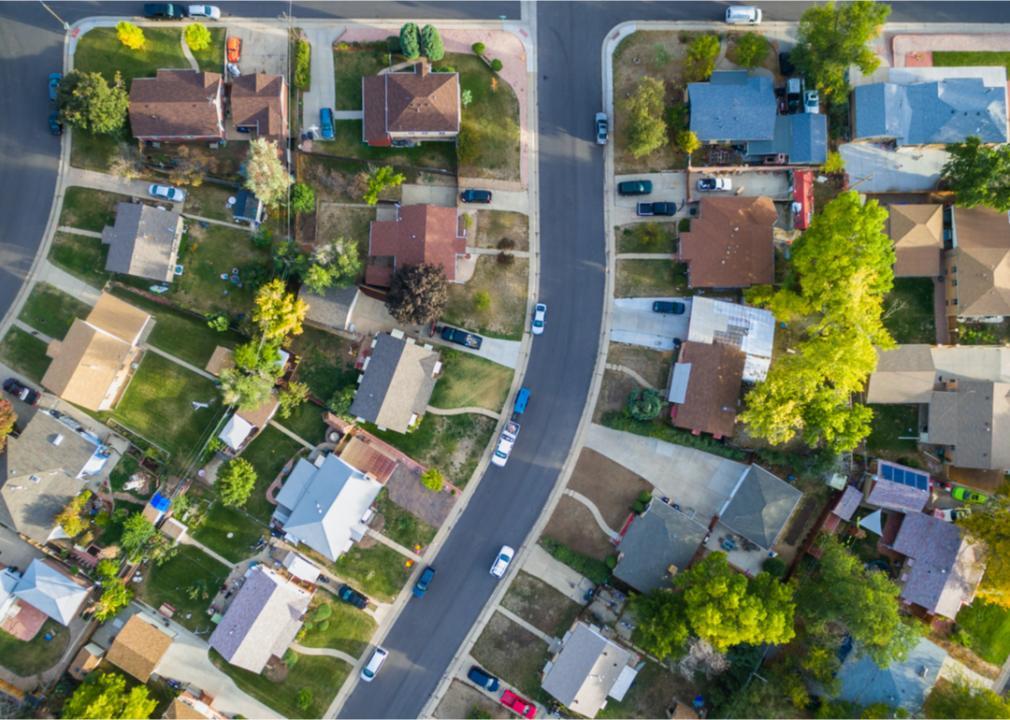
It's no secret that many Americans are forgoing homeownership in favor of renting. In 2020, renters in the U.S. occupied 43 million housing units.
The Stacker team looked at data from a United States Census survey that revealed an estimated 43,378,800 renter-occupied homes in the United States as of 2017, which makes up 36.1% of all households in the country. In 2019, renting was more affordable than buying a median-priced home in 59% of the counties; in 2021, the opposite was true: Owning was more affordable than renting in 63% of U.S. counties.
Stacker compiled a list of counties in South Carolina where people spend the highest percent of income on rent using data from the U.S. Census Bureau. Of course, saving money by owning a home is unattainable for many Americans who don't have savings that could cover a down payment, those who are denied a mortgage, or both. Keep reading to see where in your home state most of people's take-home pay goes to their monthly rent.
You may also like: Most popular girl names in the 70s in South Carolina
#46. Calhoun County
- Median percent of income spent on housing: 14.6%
--- Percent of households spending <20% of income on housing: 55.3%
--- Percent of households spending >30% of income on housing: 25.6%
- Total occupied households: 6,179
- Median household income: $46,339
- Median monthly housing cost: $562
#45. Chester County
- Median percent of income spent on housing: 15.1%
--- Percent of households spending <20% of income on housing: 56.6%
--- Percent of households spending >30% of income on housing: 21.6%
- Total occupied households: 12,653
- Median household income: $42,442
- Median monthly housing cost: $533
#44. Saluda County
- Median percent of income spent on housing: 15.1%
--- Percent of households spending <20% of income on housing: 53.5%
--- Percent of households spending >30% of income on housing: 22.8%
- Total occupied households: 7,094
- Median household income: $45,714
- Median monthly housing cost: $575
#43. Chesterfield County
- Median percent of income spent on housing: 15.1%
--- Percent of households spending <20% of income on housing: 58.9%
--- Percent of households spending >30% of income on housing: 20.2%
- Total occupied households: 17,900
- Median household income: $41,505
- Median monthly housing cost: $523
#42. Hampton County
- Median percent of income spent on housing: 15.5%
--- Percent of households spending <20% of income on housing: 59.2%
--- Percent of households spending >30% of income on housing: 16.5%
- Total occupied households: 6,993
- Median household income: $33,429
- Median monthly housing cost: $431
You may also like: States sending the most people to South Carolina
#41. Union County
- Median percent of income spent on housing: 16.1%
--- Percent of households spending <20% of income on housing: 52.1%
--- Percent of households spending >30% of income on housing: 22.9%
- Total occupied households: 11,432
- Median household income: $41,186
- Median monthly housing cost: $552
#40. Edgefield County
- Median percent of income spent on housing: 16.4%
--- Percent of households spending <20% of income on housing: 51.8%
--- Percent of households spending >30% of income on housing: 25.1%
- Total occupied households: 9,176
- Median household income: $49,127
- Median monthly housing cost: $672
#39. Oconee County
- Median percent of income spent on housing: 16.5%
--- Percent of households spending <20% of income on housing: 56.6%
--- Percent of households spending >30% of income on housing: 22.6%
- Total occupied households: 31,978
- Median household income: $49,134
- Median monthly housing cost: $675
#38. Lancaster County
- Median percent of income spent on housing: 16.9%
--- Percent of households spending <20% of income on housing: 56.0%
--- Percent of households spending >30% of income on housing: 22.1%
- Total occupied households: 33,899
- Median household income: $58,849
- Median monthly housing cost: $829
#37. Clarendon County
- Median percent of income spent on housing: 17.3%
--- Percent of households spending <20% of income on housing: 50.2%
--- Percent of households spending >30% of income on housing: 25.8%
- Total occupied households: 13,161
- Median household income: $40,900
- Median monthly housing cost: $591
You may also like: Most popular girl names in the 80s in South Carolina
#36. Anderson County
- Median percent of income spent on housing: 17.4%
--- Percent of households spending <20% of income on housing: 56.0%
--- Percent of households spending >30% of income on housing: 22.0%
- Total occupied households: 76,798
- Median household income: $50,865
- Median monthly housing cost: $737
#35. McCormick County
- Median percent of income spent on housing: 17.4%
--- Percent of households spending <20% of income on housing: 48.9%
--- Percent of households spending >30% of income on housing: 22.7%
- Total occupied households: 3,957
- Median household income: $43,633
- Median monthly housing cost: $633
#34. Kershaw County
- Median percent of income spent on housing: 17.5%
--- Percent of households spending <20% of income on housing: 53.9%
--- Percent of households spending >30% of income on housing: 24.8%
- Total occupied households: 24,980
- Median household income: $51,479
- Median monthly housing cost: $749
#33. Abbeville County
- Median percent of income spent on housing: 17.9%
--- Percent of households spending <20% of income on housing: 48.9%
--- Percent of households spending >30% of income on housing: 26.8%
- Total occupied households: 9,660
- Median household income: $38,741
- Median monthly housing cost: $577
#32. Spartanburg County
- Median percent of income spent on housing: 18.1%
--- Percent of households spending <20% of income on housing: 53.7%
--- Percent of households spending >30% of income on housing: 23.5%
- Total occupied households: 116,645
- Median household income: $52,332
- Median monthly housing cost: $788
You may also like: Most popular boy names in the 70s in South Carolina
#31. Aiken County
- Median percent of income spent on housing: 18.1%
--- Percent of households spending <20% of income on housing: 54.4%
--- Percent of households spending >30% of income on housing: 24.2%
- Total occupied households: 67,598
- Median household income: $51,399
- Median monthly housing cost: $774
#30. Lexington County
- Median percent of income spent on housing: 18.3%
--- Percent of households spending <20% of income on housing: 54.3%
--- Percent of households spending >30% of income on housing: 24.0%
- Total occupied households: 113,104
- Median household income: $61,173
- Median monthly housing cost: $931
#29. Newberry County
- Median percent of income spent on housing: 18.4%
--- Percent of households spending <20% of income on housing: 52.6%
--- Percent of households spending >30% of income on housing: 25.6%
- Total occupied households: 14,810
- Median household income: $44,226
- Median monthly housing cost: $678
#28. Lee County
- Median percent of income spent on housing: 18.4%
--- Percent of households spending <20% of income on housing: 51.8%
--- Percent of households spending >30% of income on housing: 29.6%
- Total occupied households: 6,423
- Median household income: $32,371
- Median monthly housing cost: $497
#27. Fairfield County
- Median percent of income spent on housing: 18.4%
--- Percent of households spending <20% of income on housing: 52.5%
--- Percent of households spending >30% of income on housing: 26.5%
- Total occupied households: 9,191
- Median household income: $38,213
- Median monthly housing cost: $587
You may also like: Best places to retire in South Carolina
#26. Pickens County
- Median percent of income spent on housing: 18.5%
--- Percent of households spending <20% of income on housing: 52.5%
--- Percent of households spending >30% of income on housing: 25.8%
- Total occupied households: 47,934
- Median household income: $49,573
- Median monthly housing cost: $763
#25. Greenville County
- Median percent of income spent on housing: 18.7%
--- Percent of households spending <20% of income on housing: 53.1%
--- Percent of households spending >30% of income on housing: 24.7%
- Total occupied households: 192,975
- Median household income: $60,351
- Median monthly housing cost: $938
#24. Orangeburg County
- Median percent of income spent on housing: 18.8%
--- Percent of households spending <20% of income on housing: 46.2%
--- Percent of households spending >30% of income on housing: 26.8%
- Total occupied households: 33,060
- Median household income: $37,955
- Median monthly housing cost: $596
#23. York County
- Median percent of income spent on housing: 18.9%
--- Percent of households spending <20% of income on housing: 53.2%
--- Percent of households spending >30% of income on housing: 24.0%
- Total occupied households: 101,211
- Median household income: $65,361
- Median monthly housing cost: $1,028
#22. Laurens County
- Median percent of income spent on housing: 18.9%
--- Percent of households spending <20% of income on housing: 50.1%
--- Percent of households spending >30% of income on housing: 27.3%
- Total occupied households: 25,563
- Median household income: $43,304
- Median monthly housing cost: $682
You may also like: Highest-rated Class of 2021 football recruits from South Carolina
#21. Darlington County
- Median percent of income spent on housing: 19.2%
--- Percent of households spending <20% of income on housing: 52.5%
--- Percent of households spending >30% of income on housing: 25.2%
- Total occupied households: 26,484
- Median household income: $38,448
- Median monthly housing cost: $615
#20. Florence County
- Median percent of income spent on housing: 19.4%
--- Percent of households spending <20% of income on housing: 50.7%
--- Percent of households spending >30% of income on housing: 26.1%
- Total occupied households: 52,188
- Median household income: $47,058
- Median monthly housing cost: $759
#19. Marlboro County
- Median percent of income spent on housing: 19.6%
--- Percent of households spending <20% of income on housing: 46.8%
--- Percent of households spending >30% of income on housing: 26.6%
- Total occupied households: 9,613
- Median household income: $33,586
- Median monthly housing cost: $549
#18. Colleton County
- Median percent of income spent on housing: 19.7%
--- Percent of households spending <20% of income on housing: 50.0%
--- Percent of households spending >30% of income on housing: 24.9%
- Total occupied households: 15,075
- Median household income: $36,324
- Median monthly housing cost: $597
#17. Sumter County
- Median percent of income spent on housing: 19.8%
--- Percent of households spending <20% of income on housing: 49.2%
--- Percent of households spending >30% of income on housing: 26.9%
- Total occupied households: 41,776
- Median household income: $45,661
- Median monthly housing cost: $752
You may also like: Do you know South Carolina's official state symbols?
#16. Greenwood County
- Median percent of income spent on housing: 19.8%
--- Percent of households spending <20% of income on housing: 51.0%
--- Percent of households spending >30% of income on housing: 27.3%
- Total occupied households: 27,612
- Median household income: $42,336
- Median monthly housing cost: $698
#15. Barnwell County
- Median percent of income spent on housing: 19.9%
--- Percent of households spending <20% of income on housing: 49.6%
--- Percent of households spending >30% of income on housing: 26.2%
- Total occupied households: 8,360
- Median household income: $35,803
- Median monthly housing cost: $595
#14. Georgetown County
- Median percent of income spent on housing: 20.1%
--- Percent of households spending <20% of income on housing: 48.0%
--- Percent of households spending >30% of income on housing: 30.3%
- Total occupied households: 25,498
- Median household income: $48,456
- Median monthly housing cost: $812
#13. Williamsburg County
- Median percent of income spent on housing: 20.3%
--- Percent of households spending <20% of income on housing: 46.4%
--- Percent of households spending >30% of income on housing: 28.7%
- Total occupied households: 12,686
- Median household income: $32,485
- Median monthly housing cost: $549
#12. Cherokee County
- Median percent of income spent on housing: 20.4%
--- Percent of households spending <20% of income on housing: 49.8%
--- Percent of households spending >30% of income on housing: 23.9%
- Total occupied households: 20,699
- Median household income: $36,883
- Median monthly housing cost: $628
You may also like: Counties with the most college graduates in South Carolina
#11. Berkeley County
- Median percent of income spent on housing: 20.7%
--- Percent of households spending <20% of income on housing: 47.9%
--- Percent of households spending >30% of income on housing: 26.6%
- Total occupied households: 76,881
- Median household income: $63,309
- Median monthly housing cost: $1,094
#10. Beaufort County
- Median percent of income spent on housing: 20.9%
--- Percent of households spending <20% of income on housing: 45.9%
--- Percent of households spending >30% of income on housing: 32.5%
- Total occupied households: 71,477
- Median household income: $68,377
- Median monthly housing cost: $1,191
#9. Horry County
- Median percent of income spent on housing: 21.1%
--- Percent of households spending <20% of income on housing: 47.2%
--- Percent of households spending >30% of income on housing: 29.3%
- Total occupied households: 131,143
- Median household income: $50,704
- Median monthly housing cost: $892
#8. Bamberg County
- Median percent of income spent on housing: 21.6%
--- Percent of households spending <20% of income on housing: 45.9%
--- Percent of households spending >30% of income on housing: 28.9%
- Total occupied households: 5,334
- Median household income: $31,422
- Median monthly housing cost: $566
#7. Marion County
- Median percent of income spent on housing: 21.7%
--- Percent of households spending <20% of income on housing: 46.1%
--- Percent of households spending >30% of income on housing: 27.0%
- Total occupied households: 11,600
- Median household income: $32,063
- Median monthly housing cost: $581
You may also like: Counties with the most super commuters in South Carolina
#6. Jasper County
- Median percent of income spent on housing: 22.0%
--- Percent of households spending <20% of income on housing: 43.2%
--- Percent of households spending >30% of income on housing: 32.5%
- Total occupied households: 10,269
- Median household income: $45,601
- Median monthly housing cost: $836
#5. Dorchester County
- Median percent of income spent on housing: 22.0%
--- Percent of households spending <20% of income on housing: 44.4%
--- Percent of households spending >30% of income on housing: 30.3%
- Total occupied households: 55,351
- Median household income: $63,080
- Median monthly housing cost: $1,158
#4. Richland County
- Median percent of income spent on housing: 22.1%
--- Percent of households spending <20% of income on housing: 43.6%
--- Percent of households spending >30% of income on housing: 32.6%
- Total occupied households: 151,853
- Median household income: $54,767
- Median monthly housing cost: $1,009
#3. Dillon County
- Median percent of income spent on housing: 22.2%
--- Percent of households spending <20% of income on housing: 43.9%
--- Percent of households spending >30% of income on housing: 27.8%
- Total occupied households: 11,029
- Median household income: $30,812
- Median monthly housing cost: $569
#2. Allendale County
- Median percent of income spent on housing: 23.1%
--- Percent of households spending <20% of income on housing: 46.9%
--- Percent of households spending >30% of income on housing: 27.3%
- Total occupied households: 3,365
- Median household income: $27,185
- Median monthly housing cost: $523
You may also like: Biggest sources of immigrants to South Carolina
#1. Charleston County
- Median percent of income spent on housing: 23.4%
--- Percent of households spending <20% of income on housing: 41.3%
--- Percent of households spending >30% of income on housing: 33.5%
- Total occupied households: 159,195
- Median household income: $64,022
- Median monthly housing cost: $1,248