Cities with the dirtiest air in the world
Cities with the dirtiest air in the world
With problems of climate change being exacerbated in the past 10 to 15 years, the air quality of urban dwellers is at risk more than ever before. Some adverse effects of poor air quality can be as severe as stroke, lung cancer, and chronic pulmonary disease, or even premature death. Unfortunately, there are many cities around the globe—most of which are concentrated in the Middle East and India—where air quality is so poor that it is extremely unhealthy. The top three countries with the most polluted cities are India with 11, Bahrain with four, and Pakistan with three.
The World Health Organization (WHO) monitors this air quality closely and ranks cities based on ambient (outdoor) air quality, based on two measures. The first is mean particulate matter between 2.5 and 10 micrometers in the air, known as coarse air quality (PM10), and the second is mean particulate matter less than 2.5 micrometers in the air, known as fine air quality (PM2.5). Both metrics are measured in micrograms per cubic meter of air (ug/m3). The database covers 4,300 cities in 108 countries.
According to the WHO, as air quality declines, the risk of fatal illness and diseases such as stroke, heart disease, lung cancer, and chronic and acute respiratory diseases, including asthma, increases. Like the food we eat and the water we drink, the air we breathe affects our short and long-term health.
To compile the following list, Stacker took data from WHO's 2018 list and measured each of the top 25 cities with the worst air quality for PM10 and PM2.5. In the case of a tie in terms of PM10, the tie was broken by the city with a higher annual mean PM2.5 amount.
Read on to find out which cities have the dirtiest air in the world and which have increased, even incrementally, the quality of their ambient air in the past few years.
You may also like: States with the highest and lowest rates of obesity
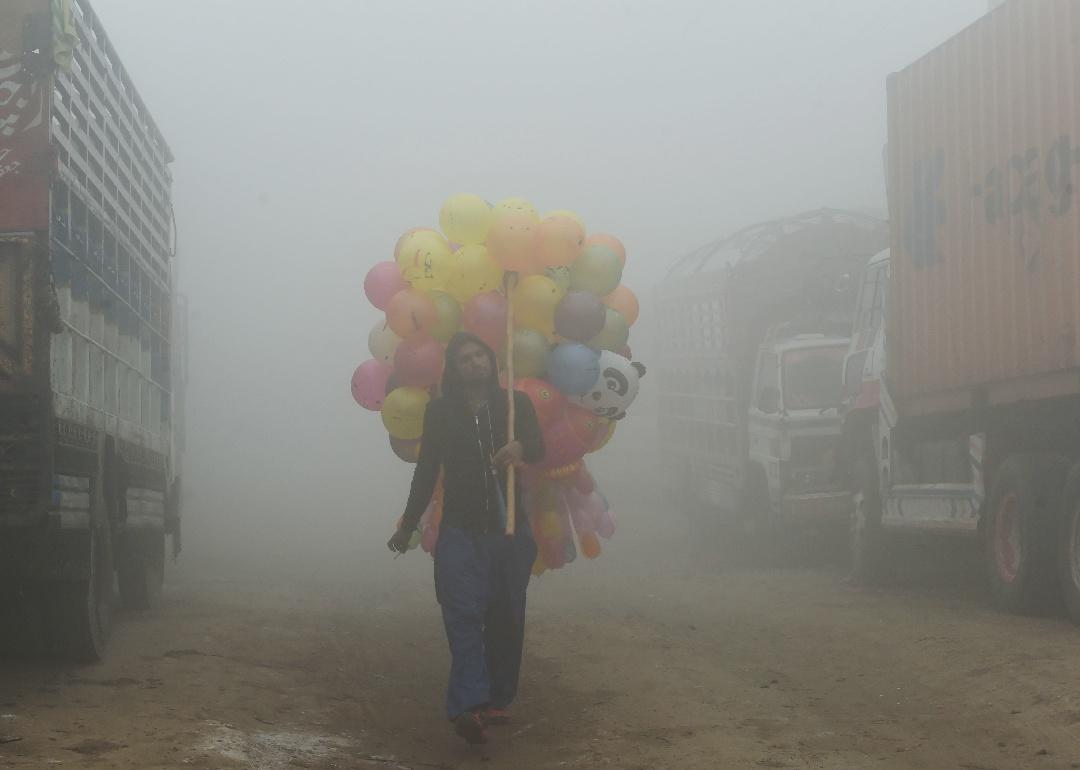
#25. Lahore, Pakistan
- Average annual coarse particulate matter (PM10): 198 ug/m3 (9.9 times above WHO guidelines)
- Average annual fine particulate matter (PM2.5): 68 ug/m3 (6.8 times above WHO guidelines)
The air quality in Lahore, Pakistan, is affected by diesel emissions, crop burning, and industrial emissions, among other sources. The smog there is so bad that it has caused a “fifth season” with only two blue sky days in 2017.
#24. Ali Sabah Al-Salem, Kuwait
- Average annual coarse particulate matter (PM10): 198 ug/m3 (9.9 times above WHO guidelines)
- Average annual fine particulate matter (PM2.5): 94 ug/m3 (9.4 times above WHO guidelines)
According to a January 2015 journal article about the major pollutants in Ali Sabah Al-Salem, Kuwait, petroleum refineries and petrochemical industries, as well as highway traffic, contributed to the large amounts of nitrogen oxide (NOx) emissions in the air. This suburban area located south of Kuwait City has seen its population struggle with such respiratory issues as asthma, emphysema, and acute bronchitis.
#23. Gobindgarh, India
- Average annual coarse particulate matter (PM10): 201 ug/m3 (10.05 times above WHO guidelines)
- Average annual fine particulate matter (PM2.5): 108 ug/m3 (10.8 times above WHO guidelines)
Gobindgarh is one of the three cities in the region to be recorded on the worst Air Quality Index list as of June 2018, along with Khanna and Ludhiana. Low-level dust storms were found to be the cause of the poor air quality in this case as well as industrial pollution and a dry weather spell.
#22. Amritsar, India
- Average annual coarse particulate matter (PM10): 202 ug/m3 (10.1 times above WHO guidelines)
- Average annual fine particulate matter (PM2.5): 108 ug/m3 (10.8 times above WHO guidelines)
Amritsar, India, is a draw for tourists and Sikh devotees alike because of its nearly 430-year-old Golden Temple. Unfortunately, it is also ranked among the top 30 cities in the world for its pollution, in part because of its growing tourism and hotel industries, and poor waste management.
#21. Narayanganj, Bangladesh
- Average annual coarse particulate matter (PM10): 205 ug/m3 (10.25 times above WHO guidelines)
- Average annual fine particulate matter (PM2.5): 94 ug/m3 (9.4 times above WHO guidelines)
Five of the top 10 causes of death in Bangladesh are related to air pollution, according to WHO, and Narayanganj is the most polluted among the cities there. It received a rating of 565 on the Air Quality Index (AQI), and air pollution worsens in the dry months of October to April when minimal rainfall makes matters worse.
You may also like: Best exercises that burn calories
#20. Firozabad, India
- Average annual coarse particulate matter (PM10): 212 ug/m3 (10.6 times above WHO guidelines)
- Average annual fine particulate matter (PM2.5): 113 ug/m3 (11.3 times above WHO guidelines)
Firozabad, known for its thriving glass industry and its location in proximity to the Taj Mahal, suffers the effects of its industry in its polluted air. The City of Bangle, as it is known, is held partially responsible for the corrosion of the Taj Mahal because of its production of sulphur dioxide. Recent measures taken by the Supreme Court of India to monitor the emissions were met with resistance.
#19. Khanna, India
- Average annual coarse particulate matter (PM10): 212 ug/m3 (10.6 times above WHO guidelines)
- Average annual fine particulate matter (PM2.5): 114 ug/m3 (11.4 times above WHO guidelines)
Environmental experts have been concerned with the levels of air pollution in Khanna for years, caused by vehicle exhaust, agricultural pollutants, and industrial emissions. The city has actually fallen in the rankings of most polluted cities in the past few years.
#18. Muzaffarpur, India
- Average annual coarse particulate matter (PM10): 214 ug/m3 (10.7 times above WHO guidelines)
- Average annual fine particulate matter (PM2.5): 197 ug/m3 (19.7 times above WHO guidelines)
As recently as November 2018, preventative measures were being taken to improve the air quality in Muzaffarpur, India, where the AQI reached as high as 445 that month. Officials attributed the issue to road dust, brick kilns, and construction activities, among other factors.
#17. Ludhiana, India
- Average annual coarse particulate matter (PM10): 228 ug/m3 (11.4 times above WHO guidelines)
- Average annual fine particulate matter (PM2.5): 122 ug/m3 (12.2 times above WHO guidelines)
As recently as 2011, Ludhiana was ranked by the WHO as India's most polluted city. It has fallen in the rankings since then, but the city and its coal-burning power plants still create highly unhealthy conditions.
#16. Nabih Saleh, Bahrain
- Average annual coarse particulate matter (PM10): 244 ug/m3 (12.2 times above WHO guidelines)
- Average annual fine particulate matter (PM2.5): 58 ug/m3 (5.8 times above WHO guidelines)
Industrial vehicle emissions, sandstorms, and drought combine to create some of the most polluted cities in the Middle East in Bahrain. Nabih Saleh is no exception.
You may also like: Biggest sources of stress for today's adults
#15. Delta Region, Egypt
- Average annual coarse particulate matter (PM10): 249 ug/m3 (12.45 times above WHO guidelines)
- Average annual fine particulate matter (PM2.5): 102 ug/m3 (10.2 times above WHO guidelines)
The area around Cairo, Egypt, and near the Nile River were identified as having a “black cloud” that burned people's eyes and throats in 1997. This effect was caused by high volumes of traffic and factories in close proximity in addition to agricultural emissions. There are several creative approaches to the problem in the works, including using satellites to locate the source of the greatest number of emissions and a plant that will more effectively use the gases from the rice straw.
#14. Ras Hayan, Bahrain
- Average annual coarse particulate matter (PM10): 250 ug/m3 (12.5 times above WHO guidelines)
- Average annual fine particulate matter (PM2.5): 44 ug/m3 (4.4 times above WHO guidelines)
Ras Hayan is a city in Bahrain that struggles to keep its levels of particulate matter at a healthy level. Like Nabih Saleh, its proximity to industrial emissions contributes to the poor air quality.
#13. Riyadh, Saudi Arabia
- Average annual coarse particulate matter (PM10): 251 ug/m3 (12.55 times above WHO guidelines)
- Average annual fine particulate matter (PM2.5): 73 ug/m3 (7.3 times above WHO guidelines)
Dangerous sandstorms in combination with industrial and vehicular emissions cause the poor air quality in the Saudi capital. As of 2016, its PM was 2.5 times what a healthy PM should be.
#12. Bushehr, Islamic Republic of Iran
- Average annual coarse particulate matter (PM10): 255 ug/m3 (12.75 times above WHO guidelines)
- Average annual fine particulate matter (PM2.5): 105 ug/m3 (10.5 times above WHO guidelines)
Frequent dust storms and vehicle emissions contribute to the pollution in the air in Bushehr, Iran. Poorly refined automobile gasoline in widespread use in Iran adds to the problem.
#11. Ma'ameer, Bahrain
- Average annual coarse particulate matter (PM10): 257 ug/m3 (12.85 times above WHO guidelines)
- Average annual fine particulate matter (PM2.5): 64 ug/m3 (6.4 times above WHO guidelines)
Ma'ameer, Bahrain is home to petroleum refineries and several large factories. As a result, the health problems that arise among the population include cancer, child birth defects, and other physical abnormalities at a much higher rate than in surrounding areas.
You may also like: States getting the least (and most) sleep
#10. Varanasi, India
- Average annual coarse particulate matter (PM10): 260 ug/m3 (13 times above WHO guidelines)
- Average annual fine particulate matter (PM2.5): 146 ug/m3 (14.6 times above WHO guidelines)
The holy city of Varanasi, India, figured in a list of WHO's 29 most polluted cities in the world as of May 2018. Fourteen of the world's 20 most polluted cities were located in India.
#9. Raipur, India
- Average annual coarse particulate matter (PM10): 268 ug/m3 (13.4 times above WHO guidelines)
- Average annual fine particulate matter (PM2.5): 144 ug/m3 (14.4 times above WHO guidelines)
Rapid population growth and subsequent construction, as well as toxic industrial waste and domestic waste, are some of the factors contributing to pollution in the city of Raipur, India. The population density has increased to 328 people per square kilometer, or at a rate of 3% per year, between 2001 and 2011.
#8. Pasakha, Bhutan
- Average annual coarse particulate matter (PM10): 275 ug/m3 (13.75 times above WHO guidelines)
- Average annual fine particulate matter (PM2.5): 150 ug/m3 (15 times above WHO guidelines)
Industrial emissions in Pasakha, Bhutan, are causing air quality in the area to deteriorate. There was a 103% increase in the number of manufacturing and production industries there from 2008 to 2014.
#7. Greater Cairo, Egypt
- Average annual coarse particulate matter (PM10): 284 ug/m3 (14.2 times above WHO guidelines)
- Average annual fine particulate matter (PM2.5): 117 ug/m3 (11.7 times above WHO guidelines)
The black cloud over the greater Cairo region in Egypt continues to be a problem, as it has been for over two decades. Though it is no longer the worst in the world for particulate matter, as it was in 2007, point-source air pollution continues causing major problems.
#6. Delhi, India
- Average annual coarse particulate matter (PM10): 292 ug/m3 (14.6 times above WHO guidelines)
- Average annual fine particulate matter (PM2.5): 143 ug/m3 (14.3 times above WHO guidelines)
Nine out of every 10 people on Earth breathe highly polluted air, and India's air is consistently ranked among the most polluted in the world. Delhi's rising population and toxic air quality caused the declaration of a public health emergency in 2017.
You may also like: Most prevalent chronic conditions in American seniors
#5. Allahabad, India
- Average annual coarse particulate matter (PM10): 317 ug/m3 (15.85 times above WHO guidelines)
- Average annual fine particulate matter (PM2.5): 170 ug/m3 (17 times above WHO guidelines)
The dust-covered city of Allahabad is contending with changing wind patterns, coal-burning power plants, deforestation, and vehicular emissions. Heavy smog is also present in Allahabad.
#4. Hamad Town, Bahrain
- Average annual coarse particulate matter (PM10): 318 ug/m3 (15.9 times above WHO guidelines)
- Average annual fine particulate matter (PM2.5): 66 ug/m3 (6.6 times above WHO guidelines)
Hamad Town, Bahrain was ranked the 11th most polluted city on Earth as of 2016, according to WHO, and climbed seven spots in the 2018 report. The industrial nature of the area and the proximity to Bahrain International Airport contribute to pollution.
#3. Gwalior, India
- Average annual coarse particulate matter (PM10): 329 ug/m3 (16.45 times above WHO guidelines)
- Average annual fine particulate matter (PM2.5): 176 ug/m3 (17.6 times above WHO guidelines)
Gwalior, India, beat out Delhi for the dubious distinction of the most polluted city in that country as of 2016 and retains the title as of 2018. It also topped the PM10 list that year.
#2. Rawalpindi, Pakistan
- Average annual coarse particulate matter (PM10): 448 ug/m3 (22.4 times above WHO guidelines)
- Average annual fine particulate matter (PM2.5): 107 ug/m3 (10.7 times above WHO guidelines)
In Rawalpindi, Pakistan, the worsening air pollution led to action on the part of the country's environmental protection agency. After a judge ordered the government to curtail the growing problem, plans were put in place to install air quality monitors and to have factories add air quality filters.
#1. Peshawar, Pakistan
- Average annual coarse particulate matter (PM10): 540 ug/m3 (27 times above WHO guidelines)
- Average annual fine particulate matter (PM2.5): 111 ug/m3 (11.1 times above WHO guidelines)
Based on the rankings of PM10 and PM2.5, Peshawar is the most polluted city in the world. Five polluted canals run through the city, causing cardiovascular and respiratory ailments. The government has been lax in cleaning up these bodies of water, which are often used as dumping grounds.
You may also like: Healthiest cities in America