Rural demographics in every state
Rural demographics in every state
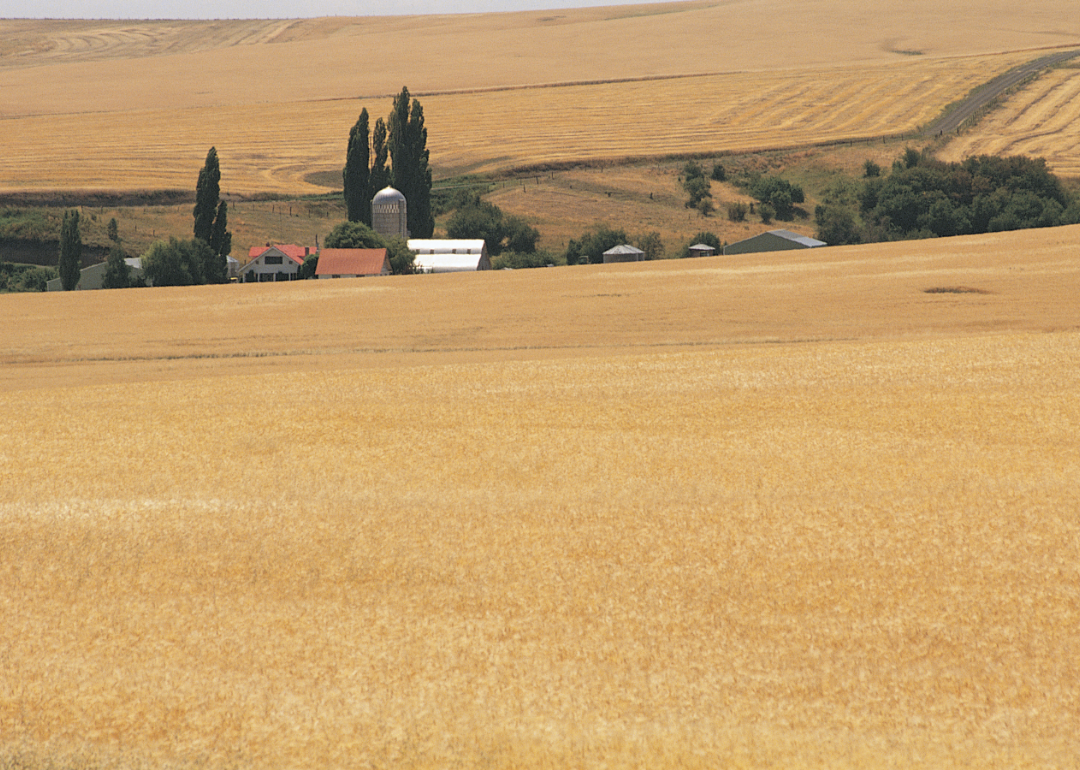
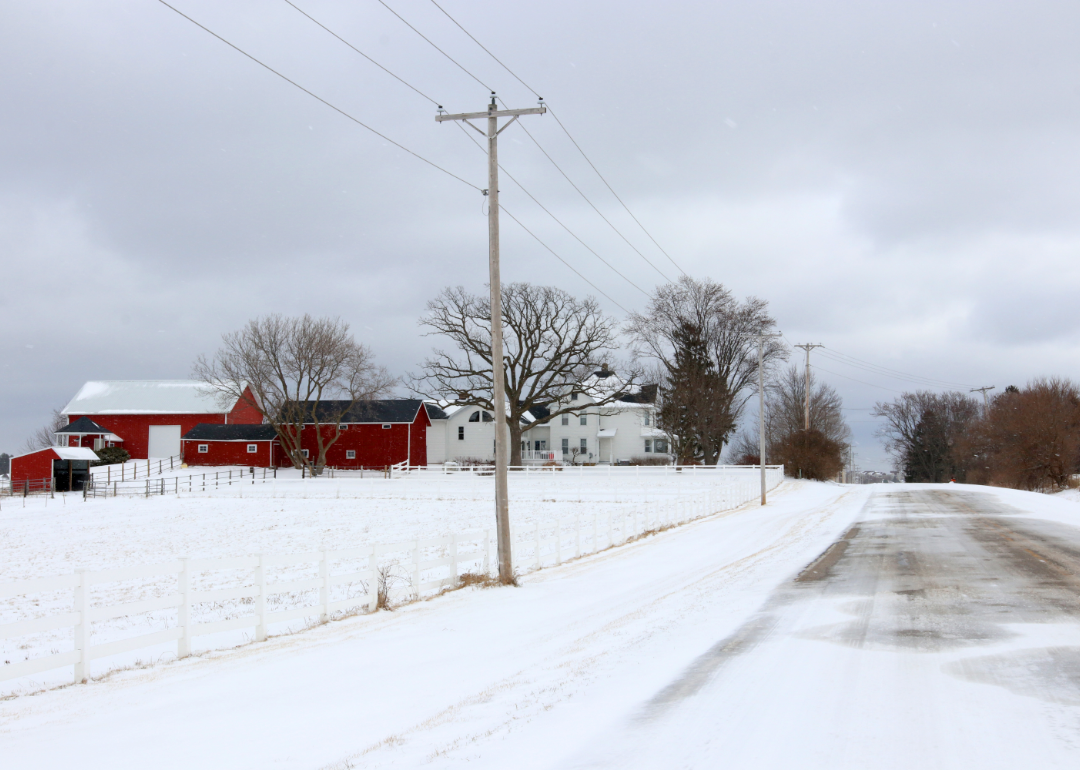
With the midterm elections coming up, many political observers have been discussing, yet again, the increasing divide between urban and rural voters. This divide has been widening for more than two decades, with residents of cities progressively voting Democrat and residents of rural areas progressively voting Republican. It is such a strong divide that it has usurped the divide between the North and South as the greatest cause of political discord in the U.S.
An October 2022 analysis by The Washington Post pointed to, among other causes, a kind of resentment that has bloomed in rural areas, where voters tend to be older, whiter, more religious, and less affluent than voters in urban areas. Many conservative-leaning people in rural areas have taken the view that the government has turned a blind eye to their issues and needs and that the areas where they live are disrespected and ridiculed in popular culture and disregarded by politicians, who they feel are not providing the social or legislative support they see being offered to their more liberal urban counterparts.
Rural voters have less motivation to vote now that the Supreme Court has struck down Roe v. Wade, according to a Politico report. Democratic pollster Celinda Lake told Politico that after the overturning of Roe, many rural voters who lean conservatively toward religion and abortion might have felt they "won" the abortion issue, and thus the urgency to vote to take a stand on the issue had evaporated. "They were very mobilized by abortion and now they think they've won," Lake said. "Whenever you see a kind of falling-off of pro-life voters because they're less engaged, you're going to see [lower turnout] particularly in rural areas."
On the other side of the divide, the overturning of Roe has begun to energize voters who lean left. A FiveThirtyEight/Ipsos tracking poll indicates that a growing portion of the Democratic base that had previously been uninvested in the midterm elections is now likely to vote for a candidate from the Democratic Party as a direct response to the fallout of the Dobbs decision. However, regarding registered voters, Republicans and those in rural areas remain more enthusiastic about the upcoming midterms than Democrats and those in urban areas.
While big trends tell one story, no two states are the same regarding the demographics of their rural communities. Stacker used data from the Federal Office of Rural Health Policy and Census American Community Survey five-year estimates to learn more about the rural population in every state. The FORHP data is a 2022 list of rural counties and census tracts within nonrural counties, which comprise rural areas. Census data is from 2020, the most recent available. It is important to note that when national definitions of rural areas are used, the populations of some states that are predominantly rural compared to other states may also contain demographic data from local micropolitan areas.
Continue reading for a breakdown of rural demographics in all 50 states.
Alabama
- Total rural population: 761,191
--- 15.6% of the state lives in a rural area (#26 by percentage of population)
- Age demographics in rural areas:
--- Children (under 18): 22.3%
--- Seniors (over 65): 16.9%
- Sex demographics in rural areas:
--- Female: 51.4%
--- Male: 48.6%
- Race and ethnicity demographics in rural areas:
- Hispanic/Latino: 4.8%
--- White: 70.7%
--- Black or African American: 24.1%
--- Native American or Alaska Native: 0.7%
Alaska
- Total rural population: 312,734
--- 42.4% of the state lives in a rural area (#5 by percentage of population)
- Age demographics in rural areas:
--- Children (under 18): 25.4%
--- Seniors (over 65): 12.0%
- Sex demographics in rural areas:
--- Female: 47.4%
--- Male: 52.6%
- Race and ethnicity demographics in rural areas:
- Hispanic/Latino: 5.2%
--- White: 56.3%
--- Black or African American: 1.0%
--- Native American or Alaska Native: 19.3%
--- Asian: 4.2%
Arizona
- Total rural population: 508,000
--- 7.1% of the state lives in a rural area (#41 by percentage of population)
- Age demographics in rural areas:
--- Children (under 18): 22.8%
--- Seniors (over 65): 18.4%
- Sex demographics in rural areas:
--- Female: 49.0%
--- Male: 51.0%
- Race and ethnicity demographics in rural areas:
- Hispanic/Latino: 26.3%
--- White: 42.9%
--- Black or African American: 1.0%
--- Native American or Alaska Native: 17.7%
Arkansas
- Total rural population: 823,272
--- 27.3% of the state lives in a rural area (#14 by percentage of population)
- Age demographics in rural areas:
--- Children (under 18): 22.5%
--- Seniors (over 65): 17.8%
- Sex demographics in rural areas:
--- Female: 50.6%
--- Male: 49.4%
- Race and ethnicity demographics in rural areas:
- Hispanic/Latino: 5.8%
--- White: 56.4%
--- Black or African American: 11.8%
California
- Total rural population: 1,478,340
--- 3.8% of the state lives in a rural area (#44 by percentage of population)
- Age demographics in rural areas:
--- Children (under 18): 22.4%
--- Seniors (over 65): 17.0%
- Sex demographics in rural areas:
--- Female: 48.5%
--- Male: 51.5%
- Race and ethnicity demographics in rural areas:
- Hispanic/Latino: 35.0%
--- White: 50.7%
--- Black or African American: 1.6%
--- Native American or Alaska Native: 1.5%
--- Asian: 1.5%
Colorado
- Total rural population: 560,604
--- 9.9% of the state lives in a rural area (#34 by percentage of population)
- Age demographics in rural areas:
--- Children (under 18): 21.1%
--- Seniors (over 65): 16.8%
- Sex demographics in rural areas:
--- Female: 47.8%
--- Male: 52.2%
- Race and ethnicity demographics in rural areas:
- Hispanic/Latino: 22.7%
--- White: 63.6%
--- Black or African American: 1.0%
--- Native American or Alaska Native: 1.4%
--- Asian: 0.6%

Connecticut
- Total rural population: 103,023
--- 2.9% of the state lives in a rural area (#45 by percentage of population)
- Age demographics in rural areas:
--- Children (under 18): 17.6%
--- Seniors (over 65): 19.1%
- Sex demographics in rural areas:
--- Female: 50.2%
--- Male: 49.8%
- Race and ethnicity demographics in rural areas:
- Hispanic/Latino: 13.3%
--- White: 74.8%
--- Black or African American: 3.0%
--- Asian: 2.3%

Delaware
- Total rural population: 84,621
--- 8.7% of the state lives in a rural area (#35 by percentage of population)
- Age demographics in rural areas:
--- Children (under 18): 21.5%
--- Seniors (over 65): 22.5%
- Sex demographics in rural areas:
--- Female: 50.4%
--- Male: 49.6%
- Race and ethnicity demographics in rural areas:
- Hispanic/Latino: 14.7%
--- White: 40.1%
--- Black or African American: 7.1%
--- Asian: 0.6%

Florida
- Total rural population: 461,818
--- 2.2% of the state lives in a rural area (#47 by percentage of population)
- Age demographics in rural areas:
--- Children (under 18): 19.9%
--- Seniors (over 65): 19.0%
- Sex demographics in rural areas:
--- Female: 46.7%
--- Male: 53.3%
- Race and ethnicity demographics in rural areas:
- Hispanic/Latino: 16.8%
--- White: 52.4%
--- Black or African American: 12.6%
Georgia
- Total rural population: 898,409
--- 8.5% of the state lives in a rural area (#36 by percentage of population)
- Age demographics in rural areas:
--- Children (under 18): 22.8%
--- Seniors (over 65): 16.3%
- Sex demographics in rural areas:
--- Female: 50.5%
--- Male: 49.5%
- Race and ethnicity demographics in rural areas:
- Hispanic/Latino: 6.0%
--- White: 36.3%
--- Black or African American: 17.1%
Hawaii
- Total rural population: 203,566
--- 14.3% of the state lives in a rural area (#29 by percentage of population)
- Age demographics in rural areas:
--- Children (under 18): 21.6%
--- Seniors (over 65): 18.1%
- Sex demographics in rural areas:
--- Female: 49.9%
--- Male: 50.1%
- Race and ethnicity demographics in rural areas:
- Hispanic/Latino: 12.7%
--- White: 17.5%
--- Asian: 15.0%
--- Native Hawaiian or Pacific Islander: 7.9%
Idaho
- Total rural population: 344,160
--- 19.6% of the state lives in a rural area (#21 by percentage of population)
- Age demographics in rural areas:
--- Children (under 18): 24.9%
--- Seniors (over 65): 17.1%
- Sex demographics in rural areas:
--- Female: 49.6%
--- Male: 50.4%
- Race and ethnicity demographics in rural areas:
- Hispanic/Latino: 15.4%
--- White: 54.8%
--- Native American or Alaska Native: 1.0%
Illinois
- Total rural population: 1,440,062
--- 11.3% of the state lives in a rural area (#32 by percentage of population)
- Age demographics in rural areas:
--- Children (under 18): 21.2%
--- Seniors (over 65): 18.3%
- Sex demographics in rural areas:
--- Female: 49.9%
--- Male: 50.1%
- Race and ethnicity demographics in rural areas:
- Hispanic/Latino: 4.7%
--- White: 88.9%
--- Black or African American: 3.5%
--- Asian: 0.6%
Indiana
- Total rural population: 1,331,713
--- 19.9% of the state lives in a rural area (#20 by percentage of population)
- Age demographics in rural areas:
--- Children (under 18): 23.1%
--- Seniors (over 65): 16.2%
- Sex demographics in rural areas:
--- Female: 50.6%
--- Male: 49.4%
- Race and ethnicity demographics in rural areas:
- Hispanic/Latino: 5.1%
--- White: 85.0%
--- Black or African American: 1.5%
--- Asian: 0.6%
Iowa
- Total rural population: 1,220,087
--- 38.7% of the state lives in a rural area (#7 by percentage of population)
- Age demographics in rural areas:
--- Children (under 18): 22.7%
--- Seniors (over 65): 18.5%
- Sex demographics in rural areas:
--- Female: 50.1%
--- Male: 49.9%
- Race and ethnicity demographics in rural areas:
- Hispanic/Latino: 6.0%
--- White: 87.7%
--- Black or African American: 1.5%
--- Asian: 1.1%

Kansas
- Total rural population: 937,296
--- 32.2% of the state lives in a rural area (#11 by percentage of population)
- Age demographics in rural areas:
--- Children (under 18): 24.0%
--- Seniors (over 65): 16.5%
- Sex demographics in rural areas:
--- Female: 49.2%
--- Male: 50.8%
- Race and ethnicity demographics in rural areas:
- Hispanic/Latino: 12.4%
--- White: 78.3%
--- Black or African American: 2.5%
--- Native American or Alaska Native: 0.7%
--- Asian: 0.9%
Kentucky
- Total rural population: 1,281,762
--- 28.7% of the state lives in a rural area (#13 by percentage of population)
- Age demographics in rural areas:
--- Children (under 18): 22.5%
--- Seniors (over 65): 16.1%
- Sex demographics in rural areas:
--- Female: 50.6%
--- Male: 49.4%
- Race and ethnicity demographics in rural areas:
- Hispanic/Latino: 2.5%
--- White: 60.5%
--- Black or African American: 2.8%

Louisiana
- Total rural population: 535,938
--- 11.5% of the state lives in a rural area (#31 by percentage of population)
- Age demographics in rural areas:
--- Children (under 18): 23.7%
--- Seniors (over 65): 15.2%
- Sex demographics in rural areas:
--- Female: 50.1%
--- Male: 49.9%
- Race and ethnicity demographics in rural areas:
- Hispanic/Latino: 3.6%
--- White: 40.8%
--- Black or African American: 23.8%
Maine
- Total rural population: 517,862
--- 38.6% of the state lives in a rural area (#8 by percentage of population)
- Age demographics in rural areas:
--- Children (under 18): 18.2%
--- Seniors (over 65): 21.5%
- Sex demographics in rural areas:
--- Female: 51.1%
--- Male: 48.9%
- Race and ethnicity demographics in rural areas:
- Hispanic/Latino: 1.5%
--- White: 77.2%
--- Native American or Alaska Native: 0.7%
--- Asian: 0.6%
Maryland
- Total rural population: 171,062
--- 2.8% of the state lives in a rural area (#46 by percentage of population)
- Age demographics in rural areas:
--- Children (under 18): 18.8%
--- Seniors (over 65): 22.0%
- Sex demographics in rural areas:
--- Female: 52.3%
--- Male: 47.7%
- Race and ethnicity demographics in rural areas:
- Hispanic/Latino: 4.5%
--- White: 72.6%
--- Black or African American: 12.7%
--- Asian: 0.8%
Massachusetts
- Total rural population: 135,498
--- 2.0% of the state lives in a rural area (#48 by percentage of population)
- Age demographics in rural areas:
--- Children (under 18): 16.8%
--- Seniors (over 65): 21.7%
- Sex demographics in rural areas:
--- Female: 51.4%
--- Male: 48.6%
- Race and ethnicity demographics in rural areas:
- Hispanic/Latino: 4.8%
--- White: 80.7%
--- Black or African American: 1.9%
--- Asian: 1.3%
Michigan
- Total rural population: 1,517,846
--- 15.2% of the state lives in a rural area (#27 by percentage of population)
- Age demographics in rural areas:
--- Children (under 18): 19.9%
--- Seniors (over 65): 19.3%
- Sex demographics in rural areas:
--- Female: 49.6%
--- Male: 50.4%
- Race and ethnicity demographics in rural areas:
- Hispanic/Latino: 3.8%
--- White: 77.6%
--- Black or African American: 1.7%
--- Native American or Alaska Native: 1.1%
Minnesota
- Total rural population: 1,212,543
--- 21.7% of the state lives in a rural area (#19 by percentage of population)
- Age demographics in rural areas:
--- Children (under 18): 22.7%
--- Seniors (over 65): 18.7%
- Sex demographics in rural areas:
--- Female: 49.8%
--- Male: 50.2%
- Race and ethnicity demographics in rural areas:
- Hispanic/Latino: 5.4%
--- White: 76.8%
--- Black or African American: 1.1%
--- Native American or Alaska Native: 1.8%
--- Asian: 1.0%
Mississippi
- Total rural population: 970,817
--- 32.6% of the state lives in a rural area (#10 by percentage of population)
- Age demographics in rural areas:
--- Children (under 18): 24.2%
--- Seniors (over 65): 14.9%
- Sex demographics in rural areas:
--- Female: 51.7%
--- Male: 48.3%
- Race and ethnicity demographics in rural areas:
- Hispanic/Latino: 2.8%
--- White: 30.7%
--- Black or African American: 29.1%
Missouri
- Total rural population: 1,141,167
--- 18.6% of the state lives in a rural area (#24 by percentage of population)
- Age demographics in rural areas:
--- Children (under 18): 23.0%
--- Seniors (over 65): 17.1%
- Sex demographics in rural areas:
--- Female: 49.8%
--- Male: 50.2%
- Race and ethnicity demographics in rural areas:
- Hispanic/Latino: 3.7%
--- White: 64.7%
--- Black or African American: 2.6%
Montana
- Total rural population: 472,801
--- 44.5% of the state lives in a rural area (#4 by percentage of population)
- Age demographics in rural areas:
--- Children (under 18): 21.4%
--- Seniors (over 65): 17.4%
- Sex demographics in rural areas:
--- Female: 49.1%
--- Male: 50.9%
- Race and ethnicity demographics in rural areas:
- Hispanic/Latino: 3.5%
--- White: 62.2%
--- Native American or Alaska Native: 6.8%
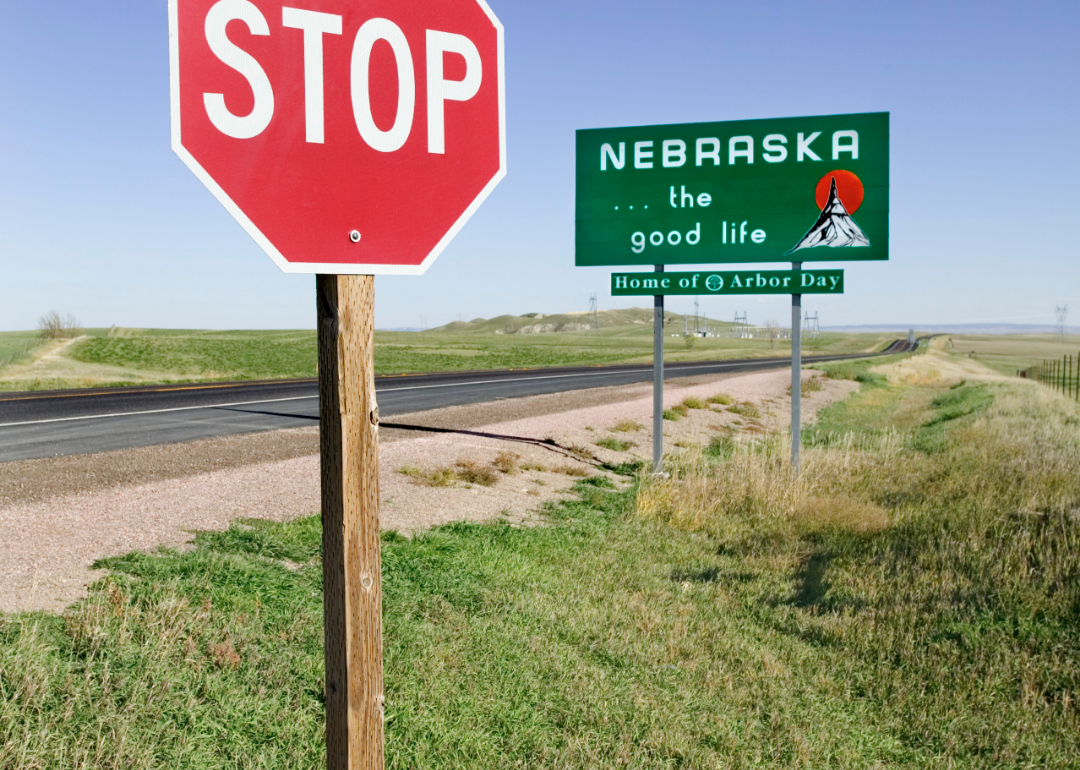
Nebraska
- Total rural population: 686,058
--- 35.7% of the state lives in a rural area (#9 by percentage of population)
- Age demographics in rural areas:
--- Children (under 18): 23.8%
--- Seniors (over 65): 17.9%
- Sex demographics in rural areas:
--- Female: 50.0%
--- Male: 50.0%
- Race and ethnicity demographics in rural areas:
- Hispanic/Latino: 10.1%
--- White: 90.3%
--- Black or African American: 1.1%
--- Native American or Alaska Native: 1.2%
--- Asian: 0.7%
Nevada
- Total rural population: 186,848
--- 6.2% of the state lives in a rural area (#43 by percentage of population)
- Age demographics in rural areas:
--- Children (under 18): 20.2%
--- Seniors (over 65): 20.3%
- Sex demographics in rural areas:
--- Female: 48.1%
--- Male: 51.9%
- Race and ethnicity demographics in rural areas:
- Hispanic/Latino: 20.2%
--- White: 61.0%
--- Black or African American: 1.6%
--- Native American or Alaska Native: 3.0%
--- Asian: 1.3%
New Hampshire
- Total rural population: 337,542
--- 24.9% of the state lives in a rural area (#17 by percentage of population)
- Age demographics in rural areas:
--- Children (under 18): 18.3%
--- Seniors (over 65): 19.1%
- Sex demographics in rural areas:
--- Female: 50.2%
--- Male: 49.8%
- Race and ethnicity demographics in rural areas:
- Hispanic/Latino: 2.0%
--- White: 64.1%
--- Black or African American: 0.8%
--- Asian: 0.9%
New Jersey
- Total rural population: 86,553
--- 1.0% of the state lives in a rural area (#49 by percentage of population)
- Age demographics in rural areas:
--- Children (under 18): 22.7%
--- Seniors (over 65): 12.6%
- Sex demographics in rural areas:
--- Female: 45.2%
--- Male: 54.8%
- Race and ethnicity demographics in rural areas:
- Hispanic/Latino: 21.6%
--- White: 51.7%
--- Black or African American: 17.0%
--- Native American or Alaska Native: 0.8%
--- Asian: 1.1%

New Mexico
- Total rural population: 485,862
--- 23.2% of the state lives in a rural area (#18 by percentage of population)
- Age demographics in rural areas:
--- Children (under 18): 24.9%
--- Seniors (over 65): 15.3%
- Sex demographics in rural areas:
--- Female: 49.4%
--- Male: 50.6%
- Race and ethnicity demographics in rural areas:
- Hispanic/Latino: 46.6%
--- White: 50.6%
--- Black or African American: 1.6%
--- Native American or Alaska Native: 7.4%
--- Asian: 0.7%
New York
- Total rural population: 1,246,248
--- 6.4% of the state lives in a rural area (#42 by percentage of population)
- Age demographics in rural areas:
--- Children (under 18): 19.8%
--- Seniors (over 65): 17.5%
- Sex demographics in rural areas:
--- Female: 49.6%
--- Male: 50.4%
- Race and ethnicity demographics in rural areas:
- Hispanic/Latino: 4.9%
--- White: 65.9%
--- Black or African American: 2.4%
--- Asian: 0.9%

North Carolina
- Total rural population: 1,525,055
--- 14.7% of the state lives in a rural area (#28 by percentage of population)
- Age demographics in rural areas:
--- Children (under 18): 20.5%
--- Seniors (over 65): 18.3%
- Sex demographics in rural areas:
--- Female: 51.2%
--- Male: 48.8%
- Race and ethnicity demographics in rural areas:
- Hispanic/Latino: 7.9%
--- White: 46.7%
--- Black or African American: 14.3%
--- Native American or Alaska Native: 2.0%
North Dakota
- Total rural population: 320,425
--- 42.1% of the state lives in a rural area (#6 by percentage of population)
- Age demographics in rural areas:
--- Children (under 18): 24.2%
--- Seniors (over 65): 16.4%
- Sex demographics in rural areas:
--- Female: 48.3%
--- Male: 51.7%
- Race and ethnicity demographics in rural areas:
- Hispanic/Latino: 4.2%
--- White: 74.0%
--- Black or African American: 1.0%
--- Native American or Alaska Native: 7.8%
Ohio
- Total rural population: 2,274,590
--- 19.5% of the state lives in a rural area (#22 by percentage of population)
- Age demographics in rural areas:
--- Children (under 18): 22.2%
--- Seniors (over 65): 16.4%
- Sex demographics in rural areas:
--- Female: 50.3%
--- Male: 49.7%
- Race and ethnicity demographics in rural areas:
- Hispanic/Latino: 3.0%
--- White: 83.8%
--- Black or African American: 2.1%
--- Asian: 0.6%
Oklahoma
- Total rural population: 1,154,707
--- 29.2% of the state lives in a rural area (#12 by percentage of population)
- Age demographics in rural areas:
--- Children (under 18): 23.6%
--- Seniors (over 65): 15.9%
- Sex demographics in rural areas:
--- Female: 50.1%
--- Male: 49.9%
- Race and ethnicity demographics in rural areas:
- Hispanic/Latino: 8.8%
--- White: 56.3%
--- Black or African American: 2.8%
--- Native American or Alaska Native: 9.2%
--- Asian: 0.6%
Oregon
- Total rural population: 659,738
--- 15.8% of the state lives in a rural area (#25 by percentage of population)
- Age demographics in rural areas:
--- Children (under 18): 20.9%
--- Seniors (over 65): 19.9%
- Sex demographics in rural areas:
--- Female: 49.8%
--- Male: 50.2%
- Race and ethnicity demographics in rural areas:
- Hispanic/Latino: 14.7%
--- White: 59.4%
--- Native American or Alaska Native: 1.5%
--- Asian: 0.7%
Pennsylvania
- Total rural population: 1,378,700
--- 10.8% of the state lives in a rural area (#33 by percentage of population)
- Age demographics in rural areas:
--- Children (under 18): 19.6%
--- Seniors (over 65): 18.8%
- Sex demographics in rural areas:
--- Female: 49.7%
--- Male: 50.3%
- Race and ethnicity demographics in rural areas:
- Hispanic/Latino: 2.4%
--- White: 80.7%
--- Black or African American: 1.9%

Rhode Island
- Total rural population: 871
--- 0.1% of the state lives in a rural area (#50 by percentage of population)
- Age demographics in rural areas:
--- Children (under 18): 16.6%
--- Seniors (over 65): 20.0%
- Sex demographics in rural areas:
--- Female: 54.5%
--- Male: 45.5%
- Race and ethnicity demographics in rural areas:
- Hispanic/Latino: 0.9%
--- White: 93.7%
--- Black or African American: 0.7%
--- Asian: 0.6%

South Carolina
- Total rural population: 634,145
--- 12.5% of the state lives in a rural area (#30 by percentage of population)
- Age demographics in rural areas:
--- Children (under 18): 21.7%
--- Seniors (over 65): 17.3%
- Sex demographics in rural areas:
--- Female: 51.7%
--- Male: 48.3%
- Race and ethnicity demographics in rural areas:
- Hispanic/Latino: 4.6%
--- White: 40.3%
--- Black or African American: 25.6%
South Dakota
- Total rural population: 410,862
--- 46.7% of the state lives in a rural area (#2 by percentage of population)
- Age demographics in rural areas:
--- Children (under 18): 24.2%
--- Seniors (over 65): 17.0%
- Sex demographics in rural areas:
--- Female: 49.4%
--- Male: 50.6%
- Race and ethnicity demographics in rural areas:
- Hispanic/Latino: 3.5%
--- White: 71.0%
--- Black or African American: 0.8%
--- Native American or Alaska Native: 8.6%
--- Asian: 1.1%
Tennessee
- Total rural population: 1,303,226
--- 19.2% of the state lives in a rural area (#23 by percentage of population)
- Age demographics in rural areas:
--- Children (under 18): 21.4%
--- Seniors (over 65): 17.4%
- Sex demographics in rural areas:
--- Female: 50.5%
--- Male: 49.5%
- Race and ethnicity demographics in rural areas:
- Hispanic/Latino: 4.5%
--- White: 67.8%
--- Black or African American: 5.8%
Texas
- Total rural population: 2,376,807
--- 8.3% of the state lives in a rural area (#38 by percentage of population)
- Age demographics in rural areas:
--- Children (under 18): 23.6%
--- Seniors (over 65): 15.8%
- Sex demographics in rural areas:
--- Female: 49.0%
--- Male: 51.0%
- Race and ethnicity demographics in rural areas:
- Hispanic/Latino: 34.8%
--- White: 57.1%
--- Black or African American: 6.8%
--- Asian: 0.6%

Utah
- Total rural population: 255,854
--- 8.1% of the state lives in a rural area (#39 by percentage of population)
- Age demographics in rural areas:
--- Children (under 18): 28.7%
--- Seniors (over 65): 13.3%
- Sex demographics in rural areas:
--- Female: 48.6%
--- Male: 51.4%
- Race and ethnicity demographics in rural areas:
- Hispanic/Latino: 10.0%
--- White: 56.9%
--- Native American or Alaska Native: 2.0%
Vermont
- Total rural population: 383,220
--- 61.4% of the state lives in a rural area (#1 by percentage of population)
- Age demographics in rural areas:
--- Children (under 18): 18.6%
--- Seniors (over 65): 19.4%
- Sex demographics in rural areas:
--- Female: 50.7%
--- Male: 49.3%
- Race and ethnicity demographics in rural areas:
- Hispanic/Latino: 1.8%
--- White: 86.5%
--- Black or African American: 0.8%
--- Asian: 0.8%
Virginia
- Total rural population: 723,510
--- 8.5% of the state lives in a rural area (#37 by percentage of population)
- Age demographics in rural areas:
--- Children (under 18): 19.9%
--- Seniors (over 65): 19.5%
- Sex demographics in rural areas:
--- Female: 50.4%
--- Male: 49.6%
- Race and ethnicity demographics in rural areas:
- Hispanic/Latino: 3.8%
--- White: 55.0%
--- Black or African American: 13.7%

Washington
- Total rural population: 546,314
--- 7.3% of the state lives in a rural area (#40 by percentage of population)
- Age demographics in rural areas:
--- Children (under 18): 22.5%
--- Seniors (over 65): 17.8%
- Sex demographics in rural areas:
--- Female: 49.7%
--- Male: 50.3%
- Race and ethnicity demographics in rural areas:
- Hispanic/Latino: 18.2%
--- White: 48.7%
--- Black or African American: 0.6%
--- Native American or Alaska Native: 2.3%
--- Asian: 1.1%

West Virginia
- Total rural population: 455,679
--- 25.2% of the state lives in a rural area (#15 by percentage of population)
- Age demographics in rural areas:
--- Children (under 18): 20.0%
--- Seniors (over 65): 19.4%
- Sex demographics in rural areas:
--- Female: 50.5%
--- Male: 49.5%
- Race and ethnicity demographics in rural areas:
- Hispanic/Latino: 1.2%
--- White: 78.2%
--- Black or African American: 2.2%
Wisconsin
- Total rural population: 1,448,222
--- 24.9% of the state lives in a rural area (#16 by percentage of population)
- Age demographics in rural areas:
--- Children (under 18): 21.0%
--- Seniors (over 65): 18.3%
- Sex demographics in rural areas:
--- Female: 49.5%
--- Male: 50.5%
- Race and ethnicity demographics in rural areas:
- Hispanic/Latino: 4.0%
--- White: 82.8%
--- Black or African American: 0.9%
--- Native American or Alaska Native: 1.2%
--- Asian: 0.8%
Wyoming
- Total rural population: 267,375
--- 46.0% of the state lives in a rural area (#3 by percentage of population)
- Age demographics in rural areas:
--- Children (under 18): 23.5%
--- Seniors (over 65): 15.4%
- Sex demographics in rural areas:
--- Female: 49.1%
--- Male: 50.9%
- Race and ethnicity demographics in rural areas:
- Hispanic/Latino: 9.6%
--- White: 60.3%
--- Native American or Alaska Native: 2.6%
--- Asian: 0.6%