How COVID-19 has impacted everyday life in America
How COVID-19 has impacted everyday life in America
Scarcely any aspect of life in America is untouched by the COVID-19 pandemic.
Millions of people have lost their jobs, millions more have seen their hours cut, and untold numbers of people fear they could lose their incomes any day.
The economy is setting records for bad news. Workers have had to choose among keeping their jobs, taking care of family members at home, and trying to protect themselves and stay healthy.
Small businesses are closing. Company expansions and job creation are suspended at best, if not canceled altogether. Trips to the grocery store are stressful episodes, from worries overexposure to the coronavirus to worries over having enough money to feed a hungry family.
Children have been stuck at home. The fortunate ones are doing schoolwork on laptops and tablets, but many are trying to learn lessons over cellphones, and too many lack online access altogether. Practicing social skills, making friends, and playing games at recess are on hold. Parents, teachers, and administrators make agonizing choices over sending children back into actual classrooms.
With less money, Americans are trying to put meals on the table, but food prices are rising. Dinner in a restaurant is a thing of the past. Millions of households each day struggle over how to pay basic bills. Children whose most nutritious meal of the day was their school lunch are going hungry.
Thousands of people are lining up for help from charities and food pantries. A record number of Americans are behind in their rent and mortgage payments, with potential evictions looming for millions of families.
Underlying it all is the effect COVID-19 has had on America’s mental health. The number of people with anxiety and depression has hit perilously high numbers. But millions do not have the health insurance they need for quality treatment.
To examine how life in America has changed during the COVID-19 pandemic, Stacker used data from the Household Pulse Survey, a U.S. Census survey conducted from April to July 2020 that specifically evaluated how the pandemic impacted Americans' daily life. Stacker chose 25 metrics from the survey, including education, employment loss, food security, health, and housing. For each metric, we pulled national- and state-level figures. Data in this story are as of July 29, reflecting the 12th and final week of the Household Pulse Survey, July 16-21.
Average time spent teaching children: Overall
- Average time for the United States: 4.4 hours per week
Teachers say they are spending less time on instruction and introducing new material and more time on review, and that students are spending only about half as much time on learning as they once were. Some schools have advised against teaching new material, concerned over parents’ abilities to oversee at-home learning or trying to limit children’s screen time.
Average time spent teaching children: Demographics
States with the highest time spent:
- #1. Washington D.C. (7.3 hours per week, 65.9% above national average)
- #2. Nevada (6.6 hours per week, 50% above national average)
- #3. Alabama (6.1 hours per week, 38.6% above national average)
States with the lowest time spent:
- #51. Nebraska (1.9 hours per week, 56.8% below national average)
- #49. South Dakota (2.2 hours per week, 50% below national average)
- #49. North Dakota (2.2 hours per week, 50% below national average)
The state superintendent of schools in North Dakota recently said remote instruction could worsen what she called “Swiss cheese” gaps in learning, when students fall behind in certain areas and skim past topics they have not mastered, rather than catch up, building a fragile foundation of knowledge.
Average time spent with children contacting teachers: Overall
- Average time for the United States: 1.3 hours per week
Regions where teachers are communicating with students less frequently risk creation of an underclass of children with fewer skills and less academic achievement, experts say. The head of the Center on Reinventing Public Education testified before Congress that students could fall into “academic death spirals,” where failure leads to more failure.
Average time spent with children contacting teachers: Demographics
States with the highest time spent:
- #1. New York (2.6 hours per week, 100% above national average)
- #2. Maryland (2.5 hours per week, 92.3% above national average)
- #3. California (2.4 hours per week, 84.6% above national average)
States with the lowest time spent:
- #51. North Dakota (0.2 hours per week, 84.6% below national average)
- #48. Alaska (0.4 hours per week, 69.2% below national average)
- #48. Montana (0.4 hours per week, 69.2% below national average)
- #48. Maine (0.4 hours per week, 69.2% below national average)
Research has found that teachers in rural areas were less likely to hold regular video conferences with students than teachers in cities and the suburbs. One English instructor in central Maine said teachers were supposed to check in with their students weekly. She said the contact became more about her students’ wellness as she saw how many were isolated at home and helping younger siblings with their schoolwork while their parents were out at work.
Households with students learning online: Overall
- Total households: 44.2 million (72.1% of households with children in public or private school)
Having students learning online had an impact on more than 41 million U.S. workers who care for at least one school-age child. Of those workers, almost 34 million have one or more children under 14 and are likely to need school for child care purposes. As for the students, they are not always engaged and do not complete assignments, especially when parents are out at work or not tech-savvy.
Households with students learning online: Demographics
States with the highest share of population impacted:
- #1. North Dakota (90.2%, 25.2% above national average)
- #2. Minnesota (87.7%, 21.7% above national average)
- #3. Rhode Island (87.2%, 21.1% above national average)
States with the lowest share of population impacted:
- #51. Tennessee (38.6%, 46.5% below national average)
- #50. Mississippi (45.2%, 37.3% below national average)
- #49. West Virginia (47.4%, 34.3% below national average)
Places like West Virginia have low rates of children learning online in part because of a critical lack of broadband coverage. About one in six residents lacks access to a high-speed network, although in some sections of the rural state, that number increases to more than half. West Virginia’s governor has announced plans to set up more than 1,000 Wi-Fi hotspots around the state so that students can take virtual classes. But local school officials say even getting to those hotspots can pose a transportation problem in large and sparsely populated counties.
Households where students had classes canceled: Overall
- Total households: 26 million (42.4% of households with children in public or private school)
Not only were classes canceled, but also assemblies, performing arts, athletics, College Board Advanced Placement and SAT preparation and tests, graduation ceremonies, and school trips.
For fall, while schools struggle with reopening classrooms, many decided early on that sports programs would be canceled. Eliminating after-school and weekend activities allows custodial staff to be redeployed to weekday hours and bolster cleaning and disinfecting measures, eliminates exposure risks from athletes, coaches, and fans from other districts, and reins in costs for financially strapped school budgets.
Households where students had classes canceled: Demographics
States with the highest share of population impacted:
- #1. West Virginia (70.7%, 66.8% above national average)
- #2. Iowa (69.7%, 64.3% above national average)
- #3. Tennessee (69.5%, 64% above national average)
States with the lowest share of population impacted:
- #51. Washington D.C. (17.8%, 58% below national average)
- #50. North Dakota (19.6%, 53.8% below national average)
- #49. Rhode Island (23.7%, 44% below national average)
In Iowa, the governor called on schools to halt classes for a month when the outbreak began.
But for fall, Gov. Kim Reynolds said she is requiring Iowa’s students spend at least half of their school time physically in classrooms, overriding decisions by local schools and drawing criticism from the state teachers union.
Households where students have easy device access: Overall
- Total households: 49.2 million (80.2% of households with children in public or private school)
--- Households where a device is always available: 35.9 million (58.4%)
--- Households where a device is usually available: 13.3 million (21.7%)
Roughly one in six children live in homes without a laptop or desktop computer, while many more must share one device with their siblings. But the term “device” can be deceptive—about 30% of parents say it is somewhat likely their children are doing schoolwork on a cellphone. Among low-income families, the figure rises to 43% of parents who say that scenario is somewhat, if not very, likely.
Households where students have easy device access: Demographics
States with the highest share of population impacted:
- #1. New Hampshire (91.6%, 14.2% above national average)
- #2. Rhode Island (90.5%, 12.9% above national average)
- #3. Minnesota (89.2%, 11.3% above national average)
States with the lowest share of population impacted:
- #51. Mississippi (54.7%, 31.8% below national average)
- #50. South Dakota (71.2%, 11.2% below national average)
- #49. Oklahoma (72%, 10.2% below national average)
Oklahoma’s Department of Education just announced a plan to provide 50,000 mobile internet connections and devices to 175 school districts, with an emphasis on getting them to low-income students. About one-fifth of the resources will go to public schools in Tulsa, Oklahoma. The plan was paid for with federal coronavirus relief funds.
Households where students have easy internet access: Overall
- Total households: 52.6 million (85.7% of households with children in public or private school)
--- Households where internet is always available: 39.3 million (64%)
--- Households where internet is usually available: 13.3 million (21.6%)
Data shows that 14% of school-age children do not have internet access in their homes. A third of those families reported being unable to afford it, and one in 25 of those households live in places where no internet connection is available. Money matters—40% of low-income parents say their school-age children have to use public Wi-Fi because they do not have reliable internet connections at home.
Households where students have easy internet access: Demographics
States with the highest share of population impacted:
- #1. Nebraska (93.9%, 9.6% above national average)
- #2. Rhode Island (93%, 8.6% above national average)
- #3. Utah (92.6%, 8% above national average)
States with the lowest share of population impacted:
- #51. Mississippi (61.4%, 28.4% below national average)
- #50. New Mexico (72.3%, 15.6% below national average)
- #49. Arkansas (75.3%, 12.2% below national average)
The lack of internet access affects nearly one-fifth of school-age children who live in rural areas, creating a worrisome rural-urban divide. The problem is particularly acute among American Indian communities, where fewer than two-thirds have computer and internet access. New Mexico’s population is more than 10% Native American.
Experienced loss of employment income during COVID-19: Overall
- Total: 126.6 million Americans (50.8% of surveyed population)
While joblessness has swept mercilessly across the country with the coronavirus outbreak, hardest hit have been places where businesses not only closed, but tourists stopped coming and spending money. Those regions include the Pocono Mountain resort regions in Pennsylvania, Massachusetts’ Cape Cod, the Hawaiian islands, and casino gambling meccas in New Jersey and Nevada.
Experienced loss of employment income during COVID-19: Demographics
States with the highest share of population impacted
- #1. Nevada (65.3%, 28.6% above national average)
- #2. California (58.4%, 15% above national average)
- #3. New York (57.5%, 13.3% above national average)
States with the lowest share of population impacted:
- #51. Washington D.C. (37.3%, 26.6% below national average)
- #50. North Dakota (37.7%, 25.7% below national average)
- #49. Nebraska (38%, 25.2% below national average)
Job losses in Nevada ended years of growth in the once-booming state. As businesses shut down and visitors stopped going to Las Vegas and Reno, Nevada, in April, the state’s jobless rate of more than one in four people was the highest in the country. It was showing some recovery to one in six people in June. State lawmakers recently approved a measure to expand unemployment benefit eligibility to workers who decide it is too risky to return to their jobs.
Unemployed in the last week: Overall
- Total: 118 million Americans (47.3% of surveyed population)
Recent government reports showed claims for first-time unemployment benefits fell more than expected after increasing in previous weeks. Weekly first-time jobless claims hit a record high of 6.9 million in the final week of March, dropped for a few months, and then started rising again in the middle of July. The ups and downs of the key data have raised and dashed hopes of what economic recovery will look like and when it might occur.
Unemployed in the last week: Demographics
States with the highest share of population impacted:
- #1. New York (56.2%, 18.7% above national average)
- #2. Mississippi (55.7%, 17.8% above national average)
- #3. Rhode Island (55%, 16.2% above national average)
States with the lowest share of population impacted:
- #51. Nebraska (35.2%, 25.6% below national average)
- #50. New Hampshire (35.9%, 24.1% below national average)
- #49. Wisconsin (36.6%, 22.8% below national average)
While job losses have been sweeping, recovery has been spotty and slow. A recent weekly jobs report showed initial claims dropped to fewer than 1 million for the first time since mid-March. Declines in jobs claims were reported in every state except Rhode Island. Not only has unemployment struck more than half of Mississippi’s working population, but at $235 a week, the state has one of the lowest weekly benefit caps in the country.
Unemployed due to COVID-19 illness: Overall
- Total: 3.8 million Americans (3.2% of currently unemployed population)
Note that unemployed “due to COVID-19 illness” in this data includes "the respondent is sick with COVID-19 or is caring for someone who is."
When the outbreak began, Congress passed the Families First Coronavirus Response Act to address, in part, the lack of paid sick leave in the United States. The act helped make U.S. workers eligible for limited paid leave if they got COVID-19. But it exempted companies with more than 500 employees and those with fewer than 50, leaving nearly half of private sector workers without the guarantee of a coronavirus-related sick benefit.
Unemployed due to COVID-19 illness: Demographics
States with the highest share of population impacted:
- #1. Idaho (7%, 116.3% above national average)
- #2. Texas (6.8%, 109.1% above national average)
- #3. Alabama (5.9%, 83.8% above national average)
States with the lowest share of population impacted:
- #51. Maine (0%, 100% below national average)
- #50. South Dakota (0.1%, 96.7% below national average)
- #49. Hawaii (0.2%, 93.8% below national average)
Neither Idaho, Texas, nor Alabama have laws requiring employers in the private sector to pay sick leave to workers. But Idaho’s governor, for example, said at the start of the outbreak that not having paid leave and having workers show up sick were “just not good business practices.” A number of companies in Idaho did opt to offer the benefit to workers.
Unemployed due to child care needs: Overall
- Total: 6.9 million Americans (5.9% of currently unemployed population)
Women’s unemployment rates have been steadily higher than those of men during the pandemic, and while they may have held and lost more jobs in hard-hit industries, a big factor is access to child care and the unequal burden of caring for children that falls on women. Child care providers have closed down, COVID-19 relief benefits available to parents who quit jobs over child care duties expired, and some parents lost jobless benefits when they were asked to return to work and declined.
Unemployed due to child care needs: Demographics
States with the highest share of population impacted:
- #1. Alabama (11.1%, 89% above national average)
- #2. South Dakota (10.3%, 75.7% above national average)
- #3. North Carolina (10.2%, 73.8% above national average)
States with the lowest share of population impacted:
- #51. Maine (1.7%, 70.8% below national average)
- #50. Montana (2.3%, 61.4% below national average)
- #49. Vermont (3%, 48.5% below national average)
Pointing to how child care needs have affected workers in Alabama, government data from May showed 57% of the state jobless claims were made by women, and almost half by workers 25 to 44. Losing jobs to care for children also has meant losing health insurance for many workers as well.
Unemployed due to worries about getting or spreading COVID-19: Overall
- Total: 6.1 million Americans (5.1% of currently unemployed population)
Of the millions of Americans who have decided a return to their jobs was too big a risk to their health or their families’ health, many have had their unemployment benefits revoked. Some states have encouraged employers to report such employees, such as Oklahoma, which established a dedicated “Return To Work” system for reporting. Labor advocates say workers have legitimate concerns not to return to close quarters or cramped conditions of restaurant kitchens, meatpacking plants, call centers, and manufacturing plants. Tennessee issued a statement that workers who were apprehensive about returning to work due to health concerns were ineligible for state unemployment benefits for refusing to work.
Unemployed due to worries about getting or spreading COVID-19: Demographics
States with the highest share of population impacted:
- #1. Alaska (13.9%, 170.7% above national average)
- #2. Nebraska (12.6%, 144.5% above national average)
- #3. South Dakota (11.6%, 125.2% above national average)
States with the lowest share of population impacted:
- #51. Kansas (1.1%, 79.4% below national average)
- #50. Delaware (1.6%, 68.5% below national average)
- #49. Vermont (1.8%, 65.8% below national average)
The fear of getting sick exacerbated already grim jobless numbers in places like Alaska that were hit by a drop in summer tourism, cancellations by cruise ships, and a closing of the Canadian border. Many businesses in Alaska reap all their yearly revenues in the short summer tourist season.
Unemployed due to COVID-19-related business reduction or layoff: Overall
- Total: 32.4 million Americans (27.4% of currently unemployed population)
Note—This value includes: Business reduction/furlough, layoff due to COVID-19, employer closed due to COVID-19, employer went out of business due to COVID-19.
Not only did the COVID-19 outbreak trigger record layoffs, but a second wave of job losses is sending more workers home. New research from late July found almost one-third of workers who went back to work after initial layoffs were getting let go again. It also found that a quarter of rehired workers have been told to expect more layoffs. The research linked the second round of layoffs to the impact of federal stimulus funds like the Paycheck Protection Program coming to an end.
Unemployed due to COVID-19-related business reduction or layoff: Demographics
States with the highest share of population impacted:
- #1. Washington D.C. (45.1%, 64.5% above national average)
- #2. Hawaii (38.8%, 41.6% above national average)
- #3. Nevada (38.4%, 40% above national average)
States with the lowest share of population impacted:
- #51. South Dakota (10.2%, 62.8% below national average)
- #50. Arkansas (13.1%, 52.2% below national average)
- #49. New Hampshire (14.4%, 47.5% below national average)
A quarter of jobs in Hawaii are linked to tourism, an industry that has seen record layoffs during the pandemic. Hawaii moved early to impose travel restrictions on visitors and even on movement between islands to help fight the spread of COVID-19, including a two-week mandatory quarantine. The restrictions for inter-island travel have been lifted, but officials opted to keep them in effect for out-of-state visitors after cases surged in California, Arizona, and Nevada.
Average amount spent on food prepared at home: Overall
- Average amount for the United States: $211.34 per week
Food prices have soared during the pandemic, with the biggest one-month increase since 1974 occuring in April. The price of eggs jumped more than 16% from March to April. The price of beef rose more than 10% in May. Economists point to panic buying, food supply disruptions such as closings at meat processing facilities, and more retail buying over institutional purchases. The U.S. Department of Agriculture predicts prices will drop to more typical levels by the end of the year as supply chain disruption abates and processing capacities increase.
Average amount spent on food prepared at home: Demographics
States with the highest food cost:
- #1. Hawaii ($251.33 per week, 18.9% above national average)
- #2. Alaska ($250.98 per week, 18.8% above national average)
- #3. California ($245.38 per week, 16.1% above national average)
States with the lowest food cost:
- #51. Iowa ($162.04 per week, 23.3% below national average)
- #50. Wisconsin ($167.87 per week, 20.6% below national average)
- #49. Kansas ($172.28 per week, 18.5% below national average)
California was an epicenter of recent grocery price increases. The wholesale price of a dozen eggs was $1.73 in mid-March and $3.47 a month later. A class action lawsuit was filed in April, accusing food retailers, suppliers, and farms of price-gouging—inflating the price of eggs illegally in the midst of the pandemic.
Average amount spent on food prepared elsewhere: Overall
- Average amount for the United States: $81.19 per week
Note—This value includes delivery and takeout.
The amount that Americans spent on eating out, food delivery, and takeout plummeted as COVID-19 spread, dropping to about $36 billion during the locked-down month of April from a pre-pandemic $68 billion in February. It’s a far cry from 2014, the first time Americans spent more on eating out than on groceries for eating in their homes. Some consumer data indicates the pandemic trends might last, showing a majority of people planning to cook more at home and about half planning to eat less often at restaurants post-pandemic. Other data indicates Americans will be picking up their dining-out habits with a vengeance as soon as they can.
Average amount spent on food prepared elsewhere: Demographics
States with the highest food cost:
- #1. California ($104.32 per week, 28.5% above national average)
- #2. Alabama ($99.15 per week, 22.1% above national average)
- #3. Hawaii ($97.54 per week, 20.1% above national average)
States with the lowest food cost:
- #51. Vermont ($52.17 per week, 35.7% below national average)
- #50. Wisconsin ($55.48 per week, 31.7% below national average)
- #49. Maine ($55.87 per week, 31.2% below national average)
Alabamans’ spending on eating out coincides with the state being one of the earliest to allow bars and restaurants to resume on-premise consumption. As of May 11, the state’s eateries could serve customers with limited seating, social distancing, and added sanitation measures. Employees had to wear masks.
Households with insufficient food: Overall
- Total households: 29.3 million (11.8% of households surveyed)
--- Households where there is sometimes not enough to eat: 23.9 million (9.6%)
--- Households where there is often not enough to eat: 5.4 million (2.2%)
More than one in six U.S. adults were food insecure—not having reliable access to enough food—in May. The rate was worse—one in four—among adults whose employment situation was disrupted by the pandemic. Racial differences were dramatic. Food insecurity rates in Hispanic and Black adult households were twice as high as in white adult households.
Households with insufficient food: Demographics
States with the highest share of population impacted:
- #1. Mississippi (18.6%, 58.1% above national average)
- #2. New York (17.3%, 47% above national average)
- #3. Texas (16.9%, 43.7% above national average)
States with the lowest share of population impacted:
- #51. New Hampshire (4.5%, 61.7% below national average)
- #50. Maine (4.8%, 58.9% below national average)
- #49. Colorado (6%, 48.7% below national average)
Hunger was an issue in Mississippi long before the pandemic struck. Throughout recent years, the state often ranked as the most food insecure in the country, with roughly one in five residents having limited reliable access to healthy food. That’s 600,000 people worrying about the source of their next meal.
Households with children with insufficient food: Overall
- Total households with children: 14.7 million (15.2% of households with children)
--- Households where there is sometimes not enough to eat: 12.3 million (12.7%)
--- Households where there is often not enough to eat: 2.4 million (2.5%)
Brookings research in late June found 13.9 million children lived in homes where they sometimes or often did not have enough to eat. That figure was 5.6 times higher than it was in the year 2018. Nationwide, more than half of schoolchildren qualify for free or low-cost school lunches, and millions qualify for subsidized breakfasts as well. As schools closed, they set up “Grab-N-Go” systems for families to pick up meals.
Households with children with insufficient food: Demographics
States with the highest share of population impacted:
- #1. Mississippi (24.2%, 59.3% above national average)
- #2. Arizona (22%, 44.6% above national average)
- #3. Illinois (21.5%, 41.4% above national average)
States with the lowest share of population impacted:
- #51. Colorado (5%, 66.8% below national average)
- #50. New Hampshire (6.8%, 55.4% below national average)
- #49. Montana (6.9%, 54.7% below national average)
Three-quarters of Mississippi’s children are poor enough to qualify for free or reduced-cost school lunches. School officials say for many children in Mississippi, that subsidized lunch is the most nutritious—and sometimes the only—meal they eat all day. Research found, however, that during school closures nationwide, about 40% of eligible children were not getting meal assistance.
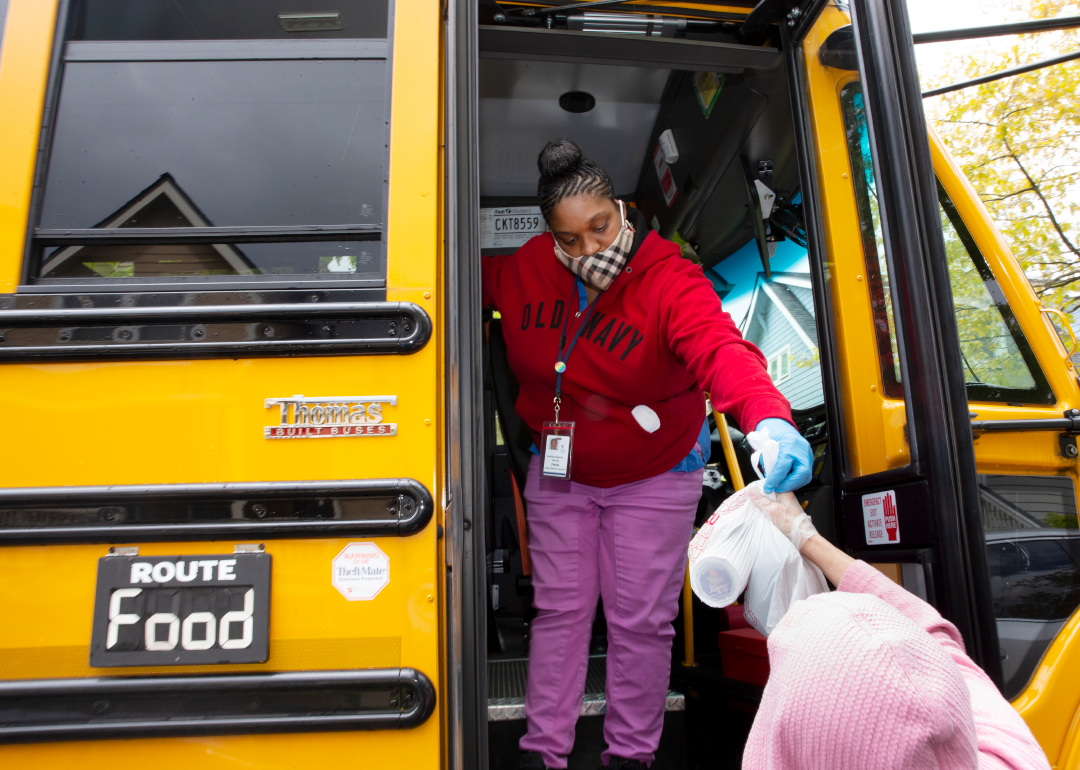
Households that relied on free food last week: Overall
- Total households: 15.6 million (6.3% of households surveyed)
Note—This value includes free groceries and free meals.
Many Americans have not been able to feed themselves or their families in the pandemic, as evidenced by poignant images of long lines at food banks. Two months into the outbreak, almost one in eight adults was getting charitable food like free meals or groceries, and among those who had lost jobs or income, the rate was more than one in seven. Among parents living with children, the rate was more than one in six.
Households that relied on free food last week: Demographics
States with the highest share of population impacted:
- #1. Oklahoma (11.2%, 77.8% above national average)
- #2. Georgia (9.2%, 47.4% above national average)
- #3. California (9.1%, 45.3% above national average)
States with the lowest share of population impacted:
- #51. Utah (1.7%, 72.3% below national average)
- #50. Maine (1.9%, 69.3% below national average)
- #49. New Jersey (2.4%, 61.4% below national average)
One food pantry in Oklahoma City, the Urban Mission Food Pantry, said it sees customers lining up nearly an hour before it opens, and that it has had to close early because it ran out of food. A ministry in Texoma, Oklahoma, on the Texas border, said it recently gave food to more than 1,000 people. Food insecurity affects about one in four people in Oklahoma, according to a recent Northwestern University study. In Georgia, food insecurity has more than tripled, also to nearly one in four people.
Delayed medical care due to COVID-19: Overall
- Total: 89.2 million Americans (35.8% of surveyed population)
Non-essential medical procedures were banned in many states when the coronavirus outbreak began, and a lot of people still are reluctant or face long waits to see a doctor or visit a clinic.
According to a poll by the Kaiser Family Foundation in May, nearly half of Americans said they or someone in their family has delayed getting medical care, and more than 10% said the condition worsened as a consequence. Experts also worry that with millions of people out of work losing both income and health insurance coverage, many more will have reason to delay seeking care. A true accounting of what delayed medical care means is years away, doctors say, as patients face untreated or undiagnosed cancer, heart conditions, and other serious illnesses.
Delayed medical care due to COVID-19: Demographics
States with the highest share of population impacted:
- #1. Maine (45%, 25.8% above national average)
- #2. Washington D.C. (43.7%, 22.1% above national average)
- #3. Oregon (43.3%, 20.9% above national average)
States with the lowest share of population impacted:
- #51. North Dakota (27.9%, 21.9% below national average)
- #50. Iowa (29.3%, 18% below national average)
- #49. Nebraska (29.5%, 17.5% below national average)
Maine has the oldest median age of any state, so delayed medical care can have particularly dire outcomes. While health care services have resumed, providers say they have backlogs and less staff to help due to layoffs and furloughs. Compounding matters, three rural hospitals have shut their doors in Maine in the past decade.
Experiencing symptoms of anxiety: Overall
- Total: 156.2 million Americans (62.7% of surveyed population)
The number of Americans suffering anxiety has soared fourfold from a year ago, when the rate was about one in 12 adults. In late July, a tracking poll showed 53% of people felt the pandemic was taking a toll on their mental health, up from 39% in May.
Experiencing symptoms of anxiety: Demographics
States with the highest share of population impacted:
- #1. Oregon (71.2%, 13.6% above national average)
- #2. New Mexico (68.1%, 8.6% above national average)
- #3. Wyoming (68.1%, 8.6% above national average)
States with the lowest share of population impacted:
- #51. Washington D.C. (56.3%, 10.2% below national average)
- #50. South Dakota (56.4%, 10.1% below national average)
- #49. Iowa (57.5%, 8.3% below national average)
In a survey, Oregon residents said they were anxious that they, a family member, or a loved one would get infected with COVID-19; worried about their personal finances like affording food and paying the rent or mortgage; and stressed that their household was not prepared to deal with the possibility of an infection.
Experiencing symptoms of depression: Overall
- Total: 128.9 million Americans (51.7% of surveyed population)
Doctors say there’s no shortage of factors fueling Americans’ high rates of depression—grief, fear of getting sick, social distancing, financial worries, isolation, loss of community, and less access to caregivers. Different age groups have shown different responses, with more than a third of those 18-29 reporting symptoms of depression. The rate was just 12%, by comparison, among people ages 70-79. Former first lady Michelle Obama recently said she had what she called “some form of low-grade depression” during the coronavirus lockdown.
Experiencing symptoms of depression: Demographics
States with the highest share of population impacted:
- #1. Oregon (59%, 14% above national average)
- #2. Colorado (57.8%, 11.6% above national average)
- #3. Washington (57.4%, 11% above national average)
States with the lowest share of population impacted:
- #51. Iowa (43.6%, 15.8% below national average)
- #50. Rhode Island (43.9%, 15.1% below national average)
- #49. Nebraska (44.9%, 13.2% below national average)
Well above the national average, the number of people in Colorado suffering depression is more than three times higher than it was before the pandemic, according to ongoing research by the Colorado School of Public Health. Another study by the High Plains Research Network found Coloradans have become nine times more likely to report having poor mental health now than they were before the pandemic.
Does not have health insurance: Overall
- Total: 24.6 million Americans (9.9% of surveyed population)
Millions of Americans have lost their health insurance coverage in layoffs caused by COVID-19.
As lawmakers have debated what kinds of relief to provide, research shows the American public is in favor of extending a helping hand. In a recent survey, 90% said the government should make sure people who have lost jobs can remain on insurance plans provided by their employers.
Does not have health insurance: Demographics
States with the highest share of population impacted:
- #1. Texas (18.8%, 90.9% above national average)
- #2. Mississippi (18.6%, 88.3% above national average)
- #3. Oklahoma (17%, 72.3% above national average)
States with the lowest share of population impacted:
- #51. Washington D.C. (2.4%, 75.8% below national average)
- #50. Iowa (3.6%, 63.8% below national average)
- #49. West Virginia (4.5%, 54.7% below national average)
Before the pandemic, Texas led the country with the most uninsured residents—more than 5 million people. One factor was the state’s decision not to expand Medicaid coverage to those with incomes at or near the poverty level. As a result, about 40% of those who have lost their jobs and employer-provided insurance—about 1.6 million Texas residents as of May—were left without medical insurance.
Didn’t pay mortgage last month: Overall
- Total: 12.7 million (8.6% of home-owning households)
--- Failed to pay: 8.3 million (5.5%)
--- Payment was deferred: 4.5 million (3%)
July was the fourth straight month that a record number of Americans could not pay their housing costs. Under the federal CARES Act passed by Congress and signed into law in March, federally backed mortgages will still be considered in good standing—a process called forbearance—for up to 180 days if payments are reduced or missed. However, about 30% of Americans’ mortgages are not eligible.
Didn’t pay mortgage last month: Demographics
States with the highest share of population impacted:
- #1. New Mexico (14.6%, 71% above national average)
- #2. Illinois (13.2%, 53.9% above national average)
- #3. Arkansas (12.6%, 46.7% above national average)
States with the lowest share of population impacted:
- #51. Iowa (3.1%, 63.9% below national average)
- #50. New Hampshire (3.7%, 57% below national average)
- #49. Wisconsin (4.2%, 51.2% below national average)
About two-thirds of housing in New Mexico is owner-occupied, with a median monthly mortgage payment of about $1,300. The state has had a high rate of home ownership over time, in part due to property traditionally staying within families and passed along through generations.
Didn’t pay rent last month: Overall
- Total: 18.2 million (24.9% of renting households)
--- Occupied without rent: 3.4 million (4.6%)
--- Failed to pay: 13.3 million (18.3%)
--- Payment was deferred: 1.5 million (2.1%)
Since the COVID-19 outbreak began, the number of renters falling behind on housing payments has doubled. Many states enacted various moratorium programs as residents were unable to pay their rent, but those reprieves have largely expired or were scheduled to run out soon.
Didn’t pay rent last month: Demographics
States with the highest share of population impacted:
- #1. Mississippi (46.5%, 86.8% above national average)
- #2. Tennessee (38.7%, 55.4% above national average)
- #3. Alabama (37.5%, 50.6% above national average)
States with the lowest share of population impacted:
- #51. Nebraska (11.4%, 54.1% below national average)
- #50. Minnesota (13.1%, 47.2% below national average)
- #49. Oregon (14.9%, 40.3% below national average)
Mississippi suspended evictions for two months during the pandemic, but reinstituted them as of June 1. The southern state ranks among states as having one of the highest eviction rates, especially in the capital city of Jackson, Mississippi.
Anticipates inability to pay mortgage next month: Overall
- Total: 15.1 million (10.2% of home-owning households)
--- No confidence in ability to pay mortgage: 5.5 million (3.7%)
--- Slight confidence in ability to pay mortgage: 9.7 million (6.5%)
Homeowners with federally backed mortgages are protected under the federal CARES Act from foreclosure—having the property taken away due to nonpayment—until at least the end of August 2020. The reprieve was extended from its original expiration date of June 30. Several states implemented foreclosure relief periods as well.
Anticipates inability to pay mortgage next month: Demographics
States with the highest share of population impacted:
- #1. Nevada (15.9%, 56.2% above national average)
- #2. Texas (14.8%, 44.8% above national average)
- #3. Florida (14.7%, 43.9% above national average)
States with the lowest share of population impacted:
- #51. South Dakota (3.5%, 65.4% below national average)
- #50. Washington D.C. (4%, 61% below national average)
- #49. Iowa (4.7%, 54.1% below national average)
Mortgage lenders in Nevada agreed on a 90-day grace period for homeowners to delay payments. It applies to mortgage holders who contract COVID-19 or are caring for someone who has it and to those who have lost jobs or had their hours reduced due to the economic impact of the virus.
Anticipates inability to pay rent next month: Overall
- Total: 27.1 million (37.1% of renting households)
--- Occupied without rent: 3.4 million (4.6%)
--- No confidence in ability to pay rent: 9.9 million (13.5%)
--- Slight confidence in ability to pay rent: 13.9 million (19%)
As swathes of people are finding themselves unable to pay their rent due to COVID-19’s economic impact, a whopping 28 million people could be facing eviction in the months ahead, experts say. A study by the Federal Reserve Bank of Cleveland in mid-July found in nearly four dozen cities and counties, the rate of eviction filings had returned to pre-pandemic levels when moratoriums expired or had not been enacted.
Anticipates inability to pay rent next month: Demographics
States with the highest share of population impacted:
- #1. Mississippi (46.9%, 26.3% above national average)
- #2. Alabama (46.8%, 26.2% above national average)
- #3. Oklahoma (46.1%, 24.2% above national average)
States with the lowest share of population impacted:
- #51. Montana (15.8%, 57.5% below national average)
- #50. Vermont (17.5%, 52.7% below national average)
- #49. Wisconsin (19.5%, 47.4% below national average)
Some 900,000 tenants in Mississippi have no federal- or state-level protection against eviction, such as a moratorium or ban put in place due to the pandemic, for nonpayment of rent. Even before COVID-19, renters were vulnerable under state law, which allows eviction proceedings to begin after rent is just three days late.