Canva
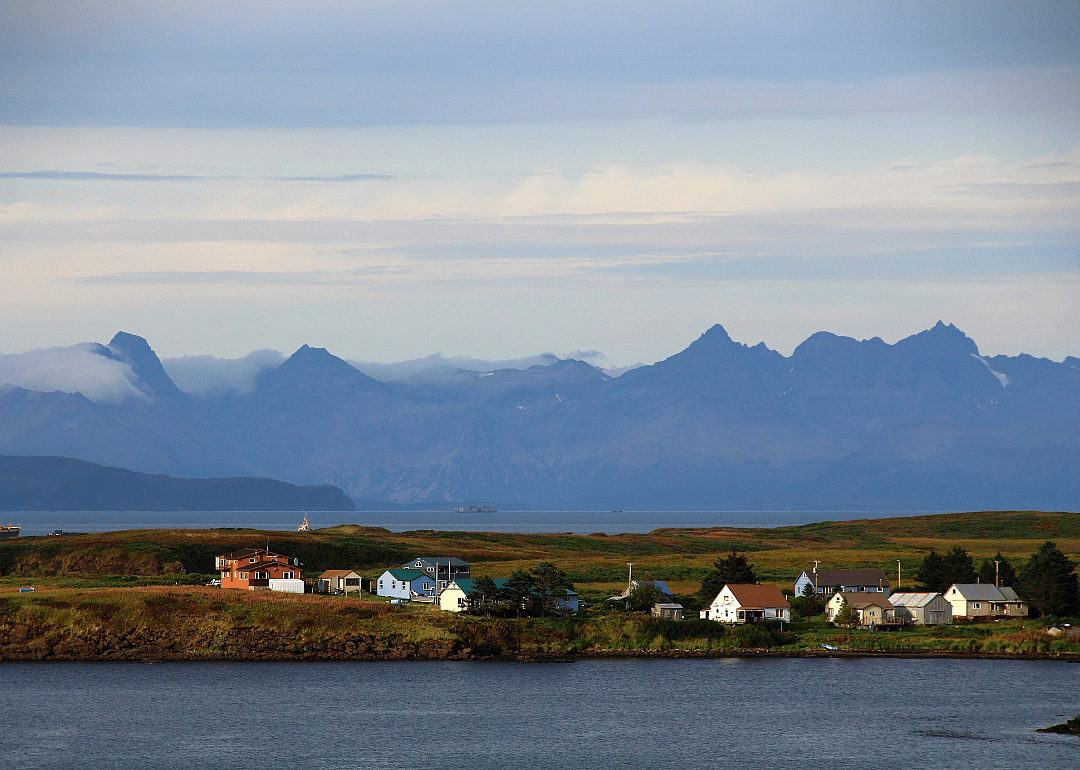
1 / 28#28. Aleutians East Borough
- Cancer rate per 100,000, 2016-2020: 135.7
- Age-adjusted rate per 100,000, 2016-2020: 138.9

Several factors contribute to cancer rates, from personal habits and genetics to air pollution or groundwater quality in a given area. People experiencing social, economic, or environmental disadvantages are disproportionately affected by high cancer rates in certain regions—including access or barriers to early screening and care.
Cancer rates also fluctuate by jobs: Higher rates of cancer can be found among meat industry and rubber manufacturing workers, and farmers.
Stacker compiled the boroughs with the highest cancer rates in Alaska using data from the CDC. Keep reading to see where in your state cancer cases are the most common.
You may also like: The most popular grocery items for Christmas in Alaska, according to Instacart
Canva
1 / 28- Cancer rate per 100,000, 2016-2020: 135.7
- Age-adjusted rate per 100,000, 2016-2020: 138.9
Canva
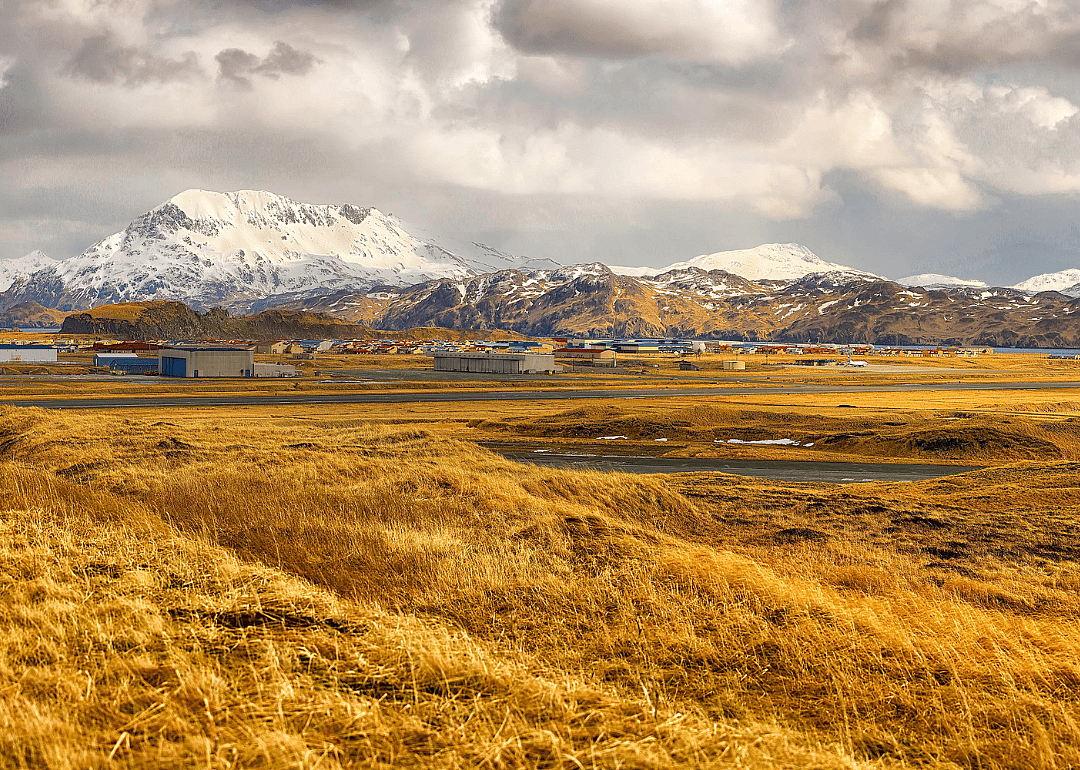
2 / 28- Cancer rate per 100,000, 2016-2020: 178.7
- Age-adjusted rate per 100,000, 2016-2020: 286.2
Marlene Moore // Shutterstock
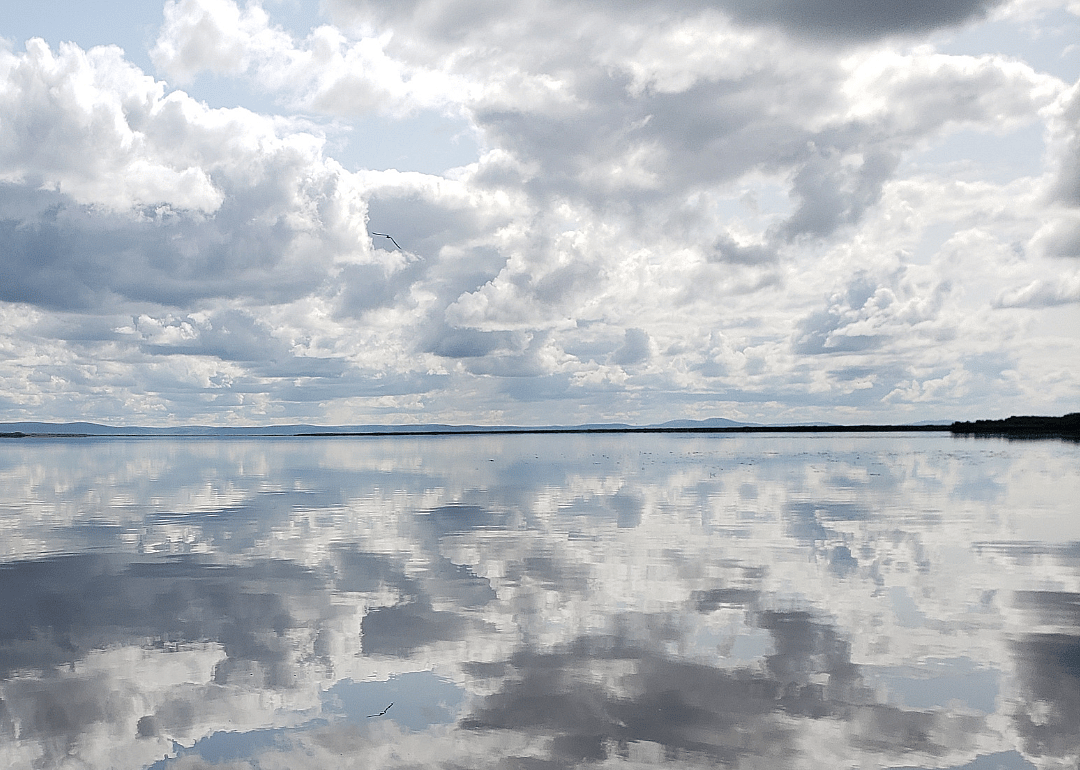
3 / 28- Cancer rate per 100,000, 2016-2020: 219.3
- Age-adjusted rate per 100,000, 2016-2020: 401.3
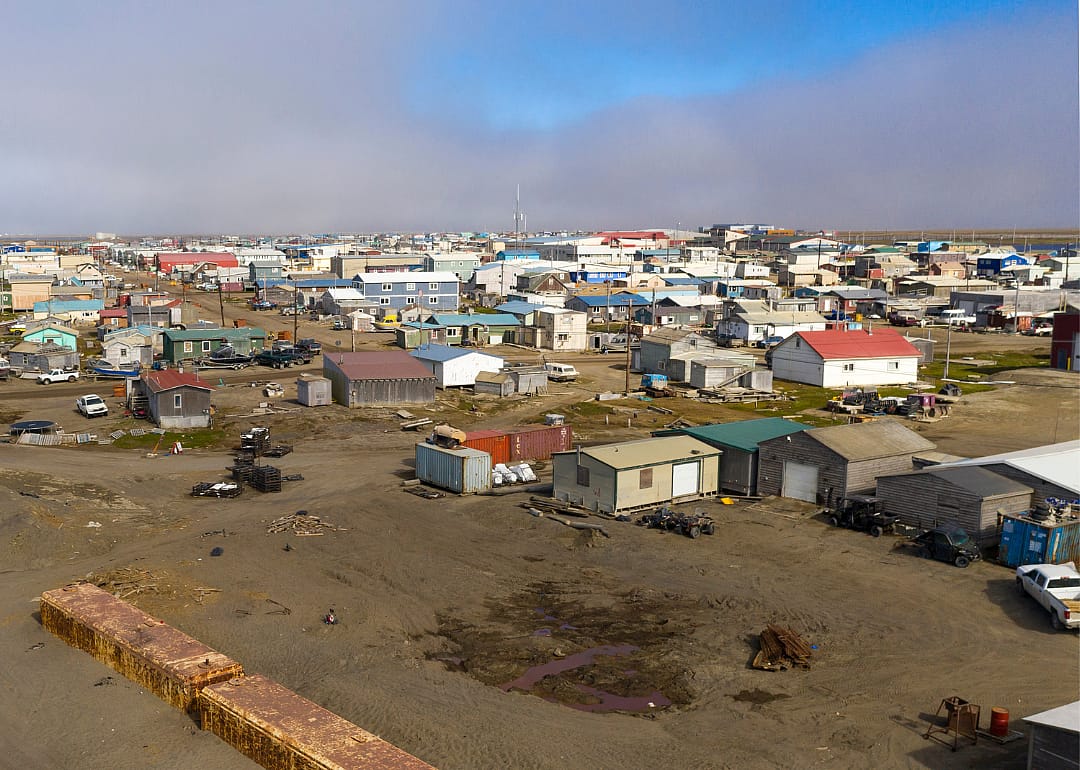
Canva
4 / 28- Cancer rate per 100,000, 2016-2020: 251.7
- Age-adjusted rate per 100,000, 2016-2020: 366.8
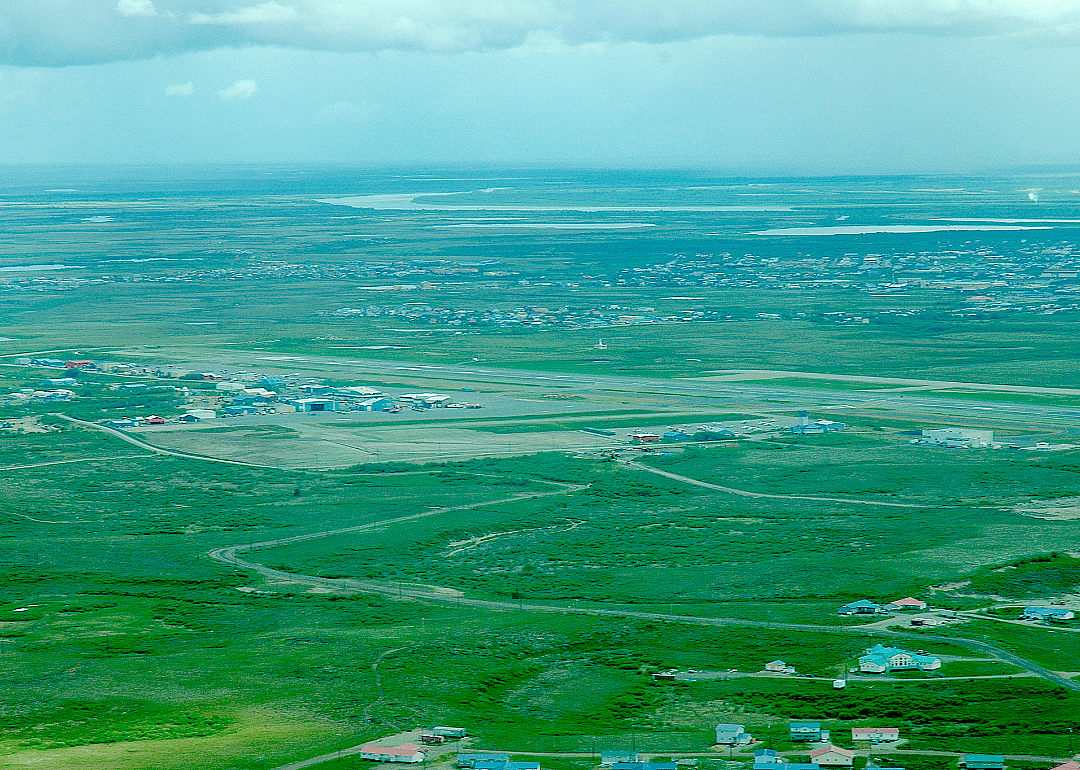
Canva
5 / 28- Cancer rate per 100,000, 2016-2020: 265.0
- Age-adjusted rate per 100,000, 2016-2020: 367.5
You may also like: Cities with the most UFO sightings in Alaska

Canva
6 / 28- Cancer rate per 100,000, 2016-2020: 298.3
- Age-adjusted rate per 100,000, 2016-2020: 414.2

Canva
7 / 28- Cancer rate per 100,000, 2016-2020: 343.7
- Age-adjusted rate per 100,000, 2016-2020: 506.4
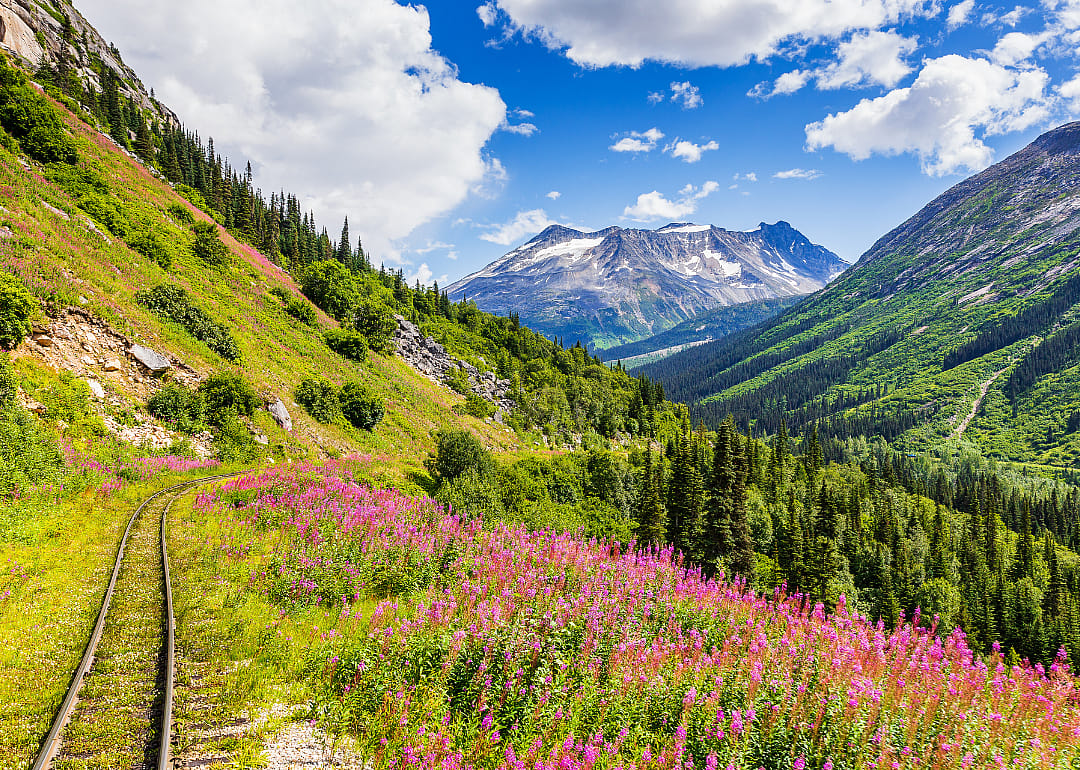
Canva
8 / 28- Cancer rate per 100,000, 2016-2020: 359.0
- Age-adjusted rate per 100,000, 2016-2020: 330.1
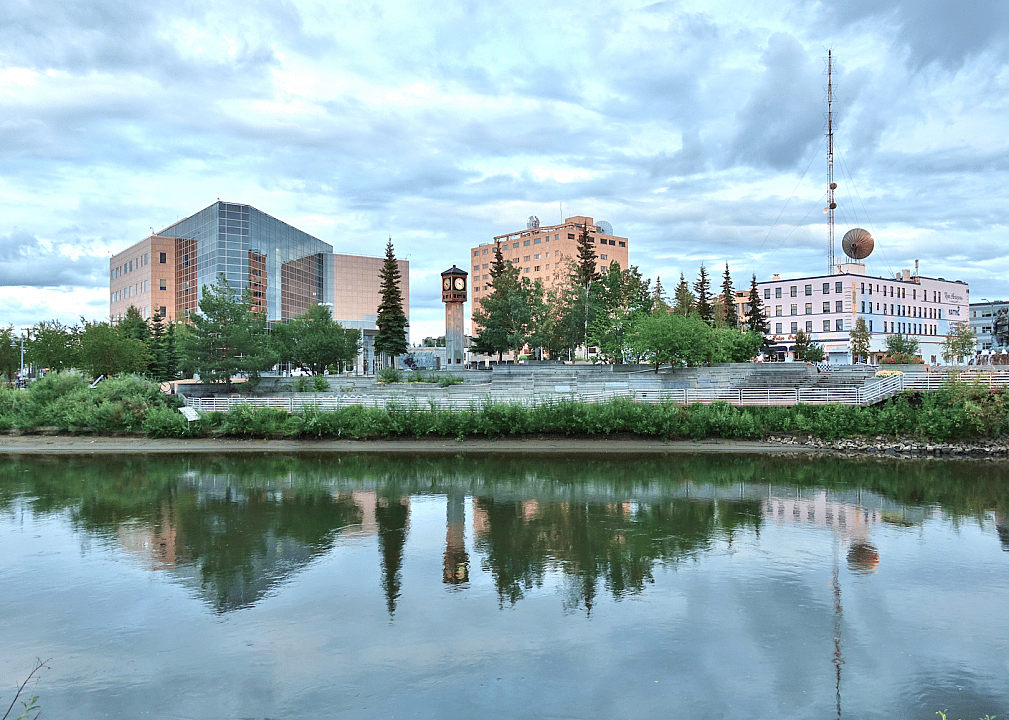
EQRoy // Shutterstock
9 / 28- Cancer rate per 100,000, 2016-2020: 362.0
- Age-adjusted rate per 100,000, 2016-2020: 402.7

Canva
10 / 28- Cancer rate per 100,000, 2016-2020: 372.9
- Age-adjusted rate per 100,000, 2016-2020: 418.0
You may also like: Highest-rated IPAs in Alaska

Canva
11 / 28- Cancer rate per 100,000, 2016-2020: 393.0
- Age-adjusted rate per 100,000, 2016-2020: 408.2

Joseph Sohm // Shutterstock
12 / 28- Cancer rate per 100,000, 2016-2020: 402.9
- Age-adjusted rate per 100,000, 2016-2020: 385.6
Canva
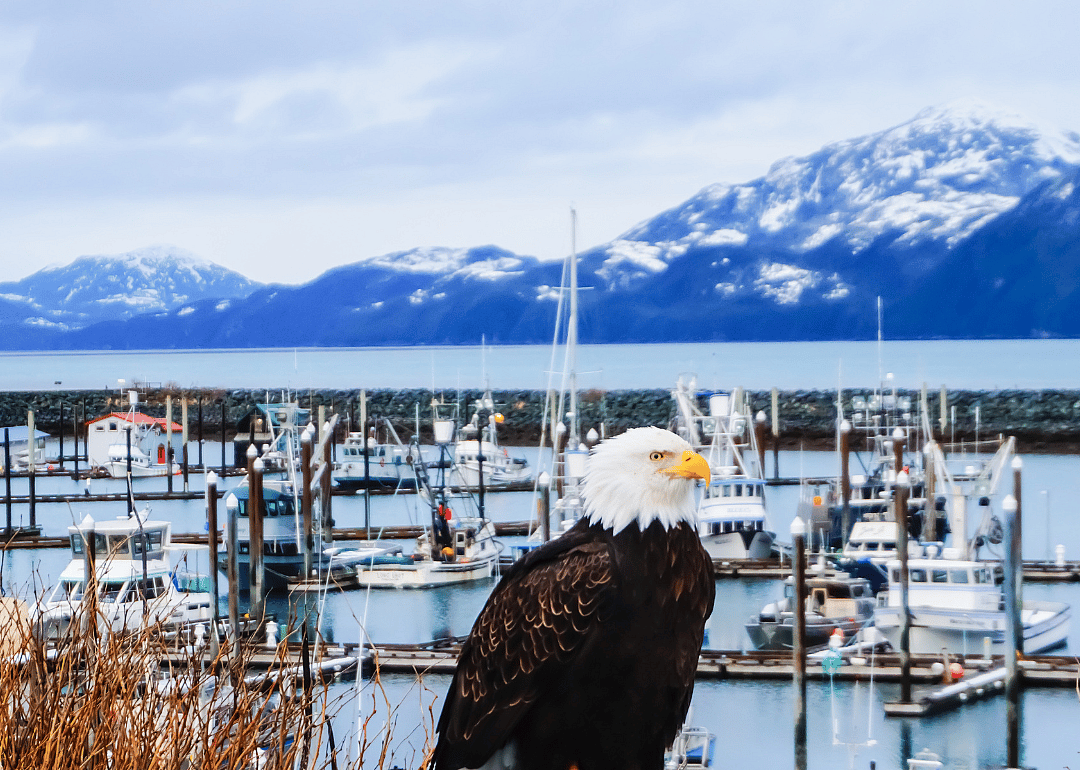
13 / 28- Cancer rate per 100,000, 2016-2020: 419.6
- Age-adjusted rate per 100,000, 2016-2020: 373.9

Canva
14 / 28- Cancer rate per 100,000, 2016-2020: 424.1
- Age-adjusted rate per 100,000, 2016-2020: 273.7
Canva
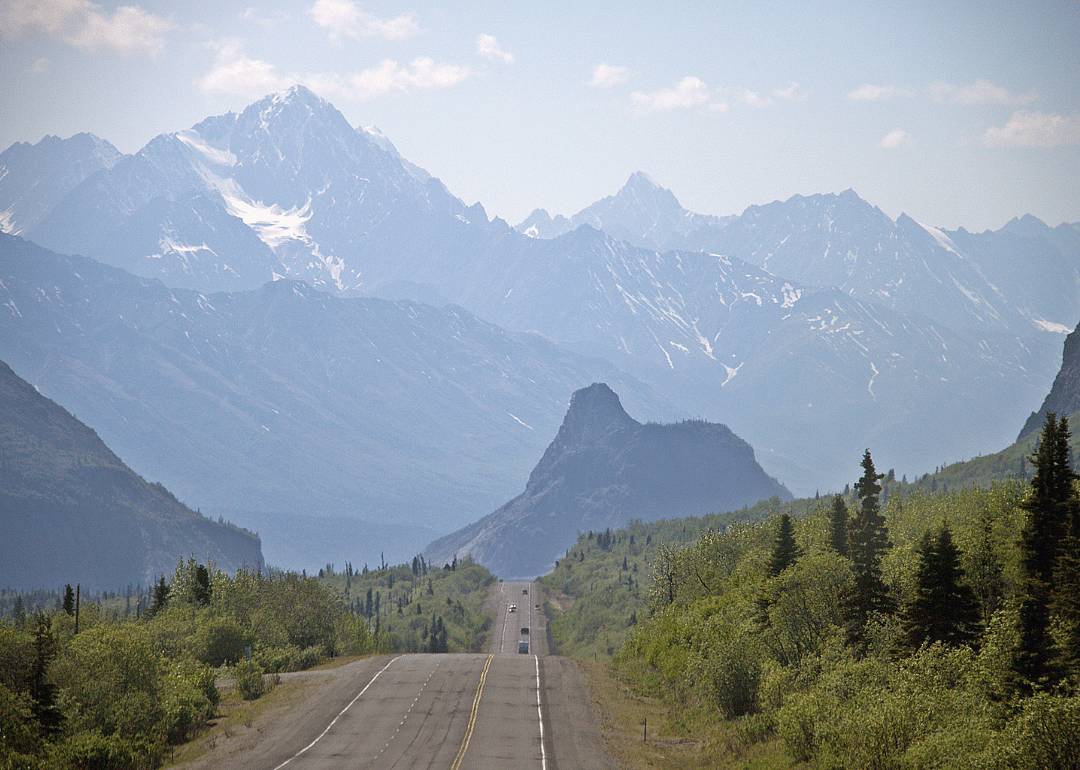
15 / 28- Cancer rate per 100,000, 2016-2020: 426.0
- Age-adjusted rate per 100,000, 2016-2020: 420.4
You may also like: Best boroughs to raise a family in Alaska
Canva
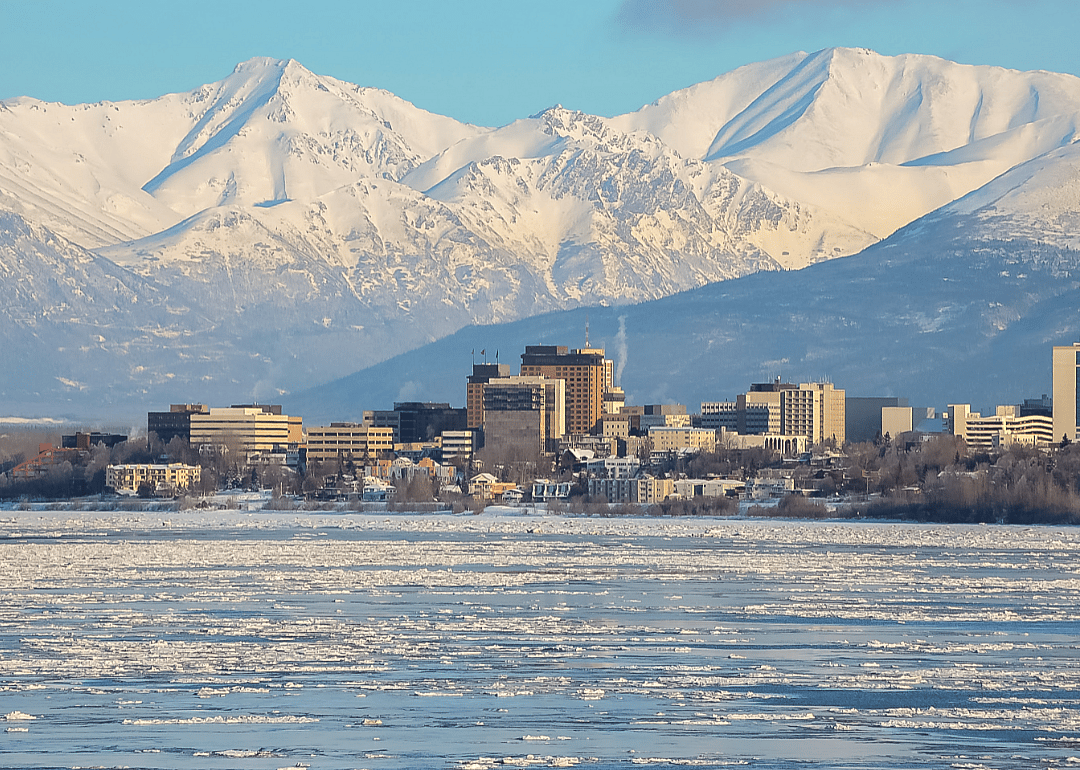
16 / 28- Cancer rate per 100,000, 2016-2020: 429.9
- Age-adjusted rate per 100,000, 2016-2020: 444.0
Canva
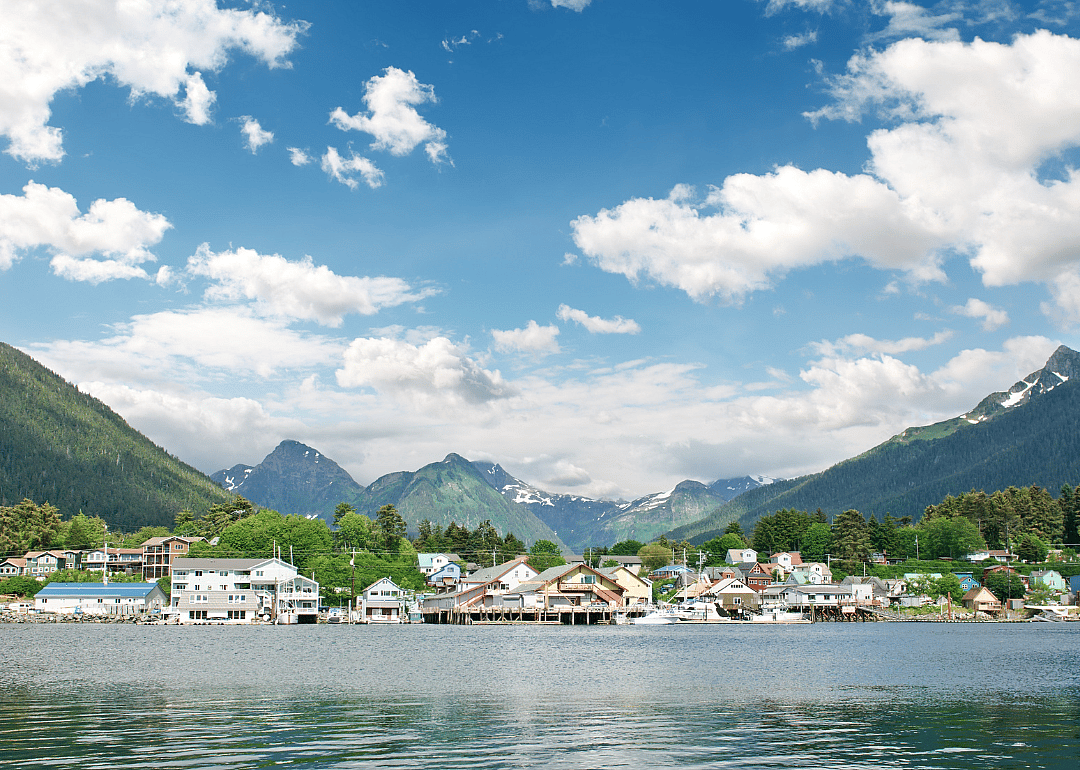
17 / 28- Cancer rate per 100,000, 2016-2020: 438.8
- Age-adjusted rate per 100,000, 2016-2020: 357.8
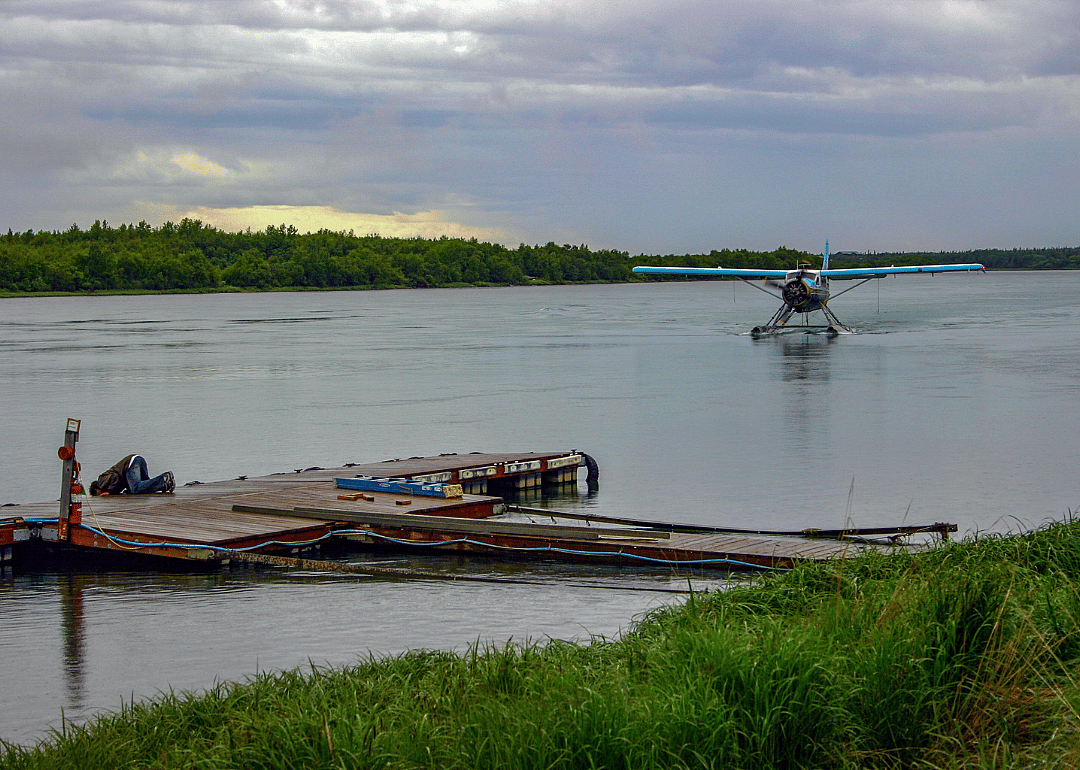
CSNafzger // Shutterstock
18 / 28- Cancer rate per 100,000, 2016-2020: 443.5
- Age-adjusted rate per 100,000, 2016-2020: 337.2
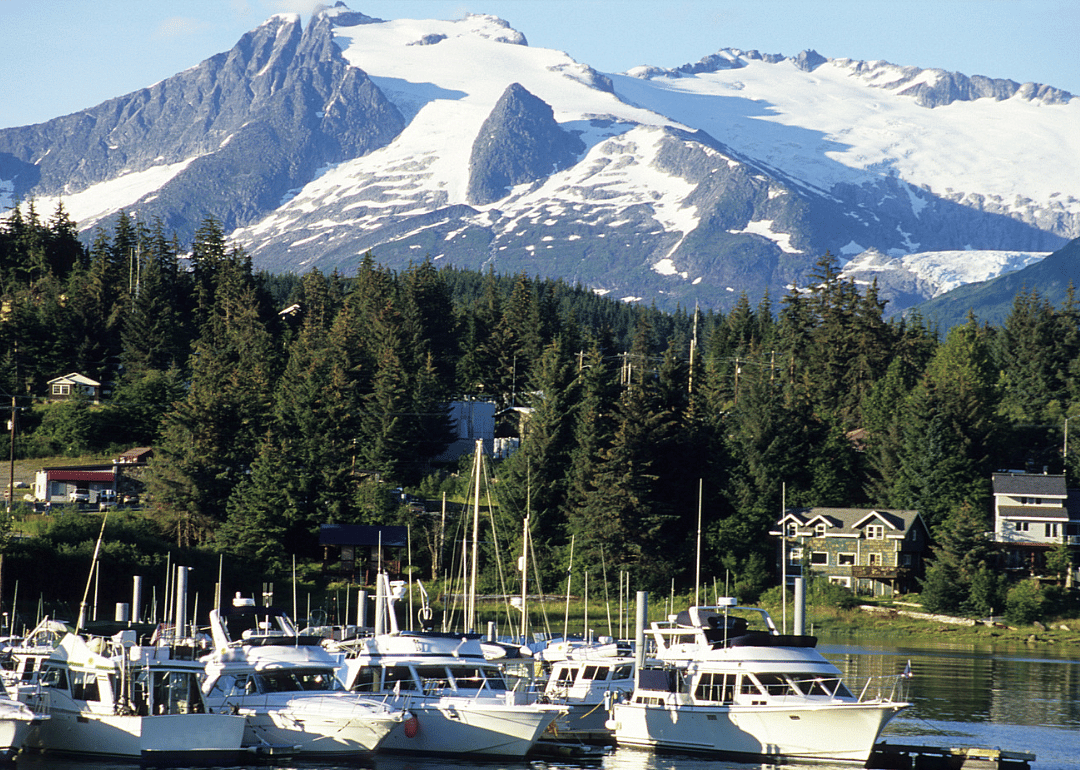
Canva
19 / 28- Cancer rate per 100,000, 2016-2020: 446.7
- Age-adjusted rate per 100,000, 2016-2020: 399.1
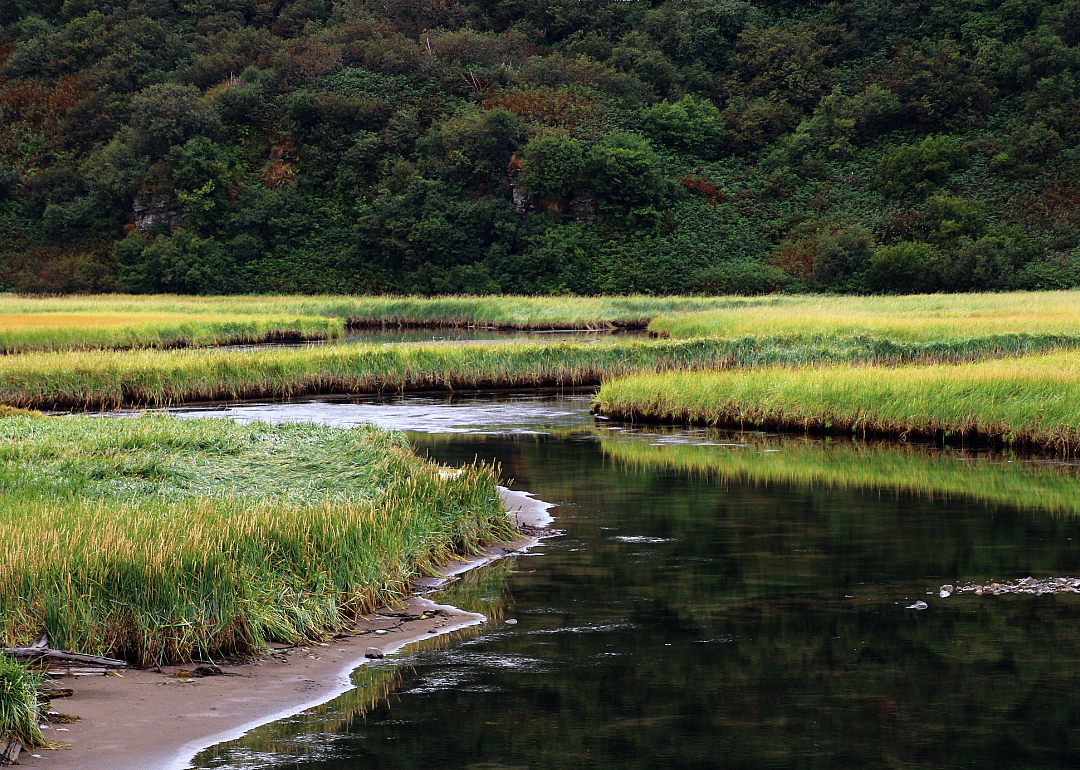
Canva
20 / 28- Cancer rate per 100,000, 2016-2020: 470.6
- Age-adjusted rate per 100,000, 2016-2020: 515.4
You may also like: Alaska's Halloween sweet tooth: 2025 candy and decor trends from Instacart data

Canva
21 / 28- Cancer rate per 100,000, 2016-2020: 495.4
- Age-adjusted rate per 100,000, 2016-2020: 365.3
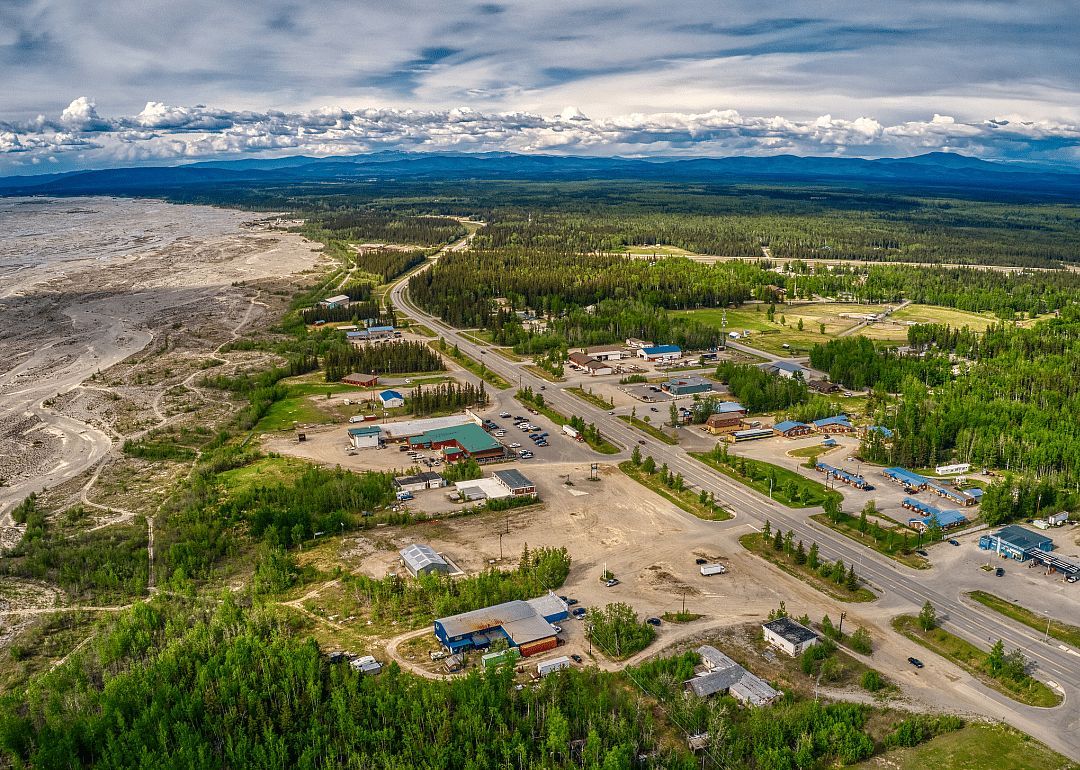
Canva
22 / 28- Cancer rate per 100,000, 2016-2020: 526.7
- Age-adjusted rate per 100,000, 2016-2020: 475.9
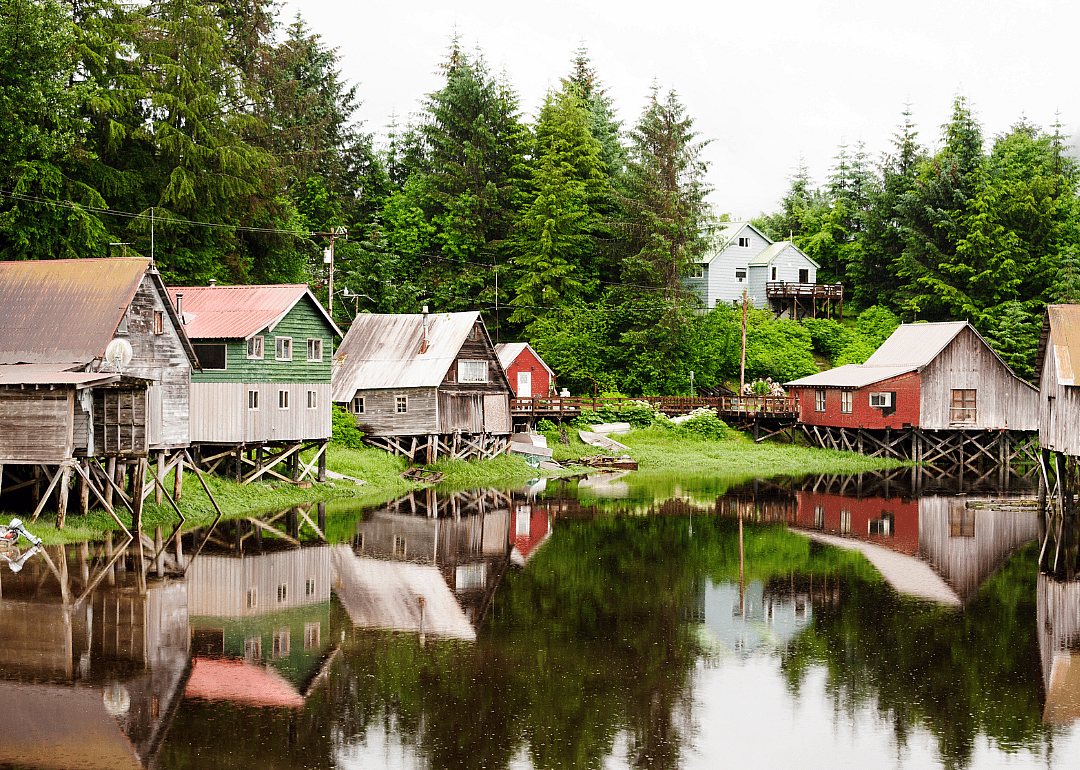
Canva
23 / 28- Cancer rate per 100,000, 2016-2020: 542.9
- Age-adjusted rate per 100,000, 2016-2020: 384.0

Canva
24 / 28- Cancer rate per 100,000, 2016-2020: 543.6
- Age-adjusted rate per 100,000, 2016-2020: 446.2
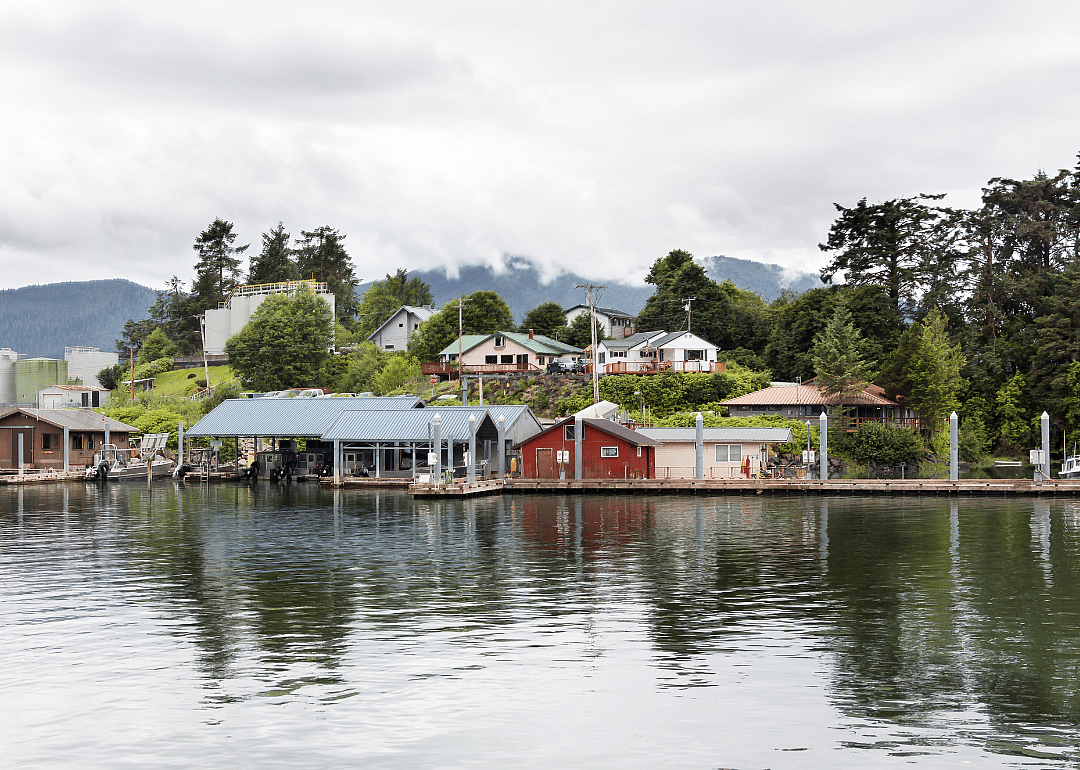
Canva
25 / 28- Cancer rate per 100,000, 2016-2020: 557.6
- Age-adjusted rate per 100,000, 2016-2020: 349.6
You may also like: Cities with the fastest-growing home prices in Alaska
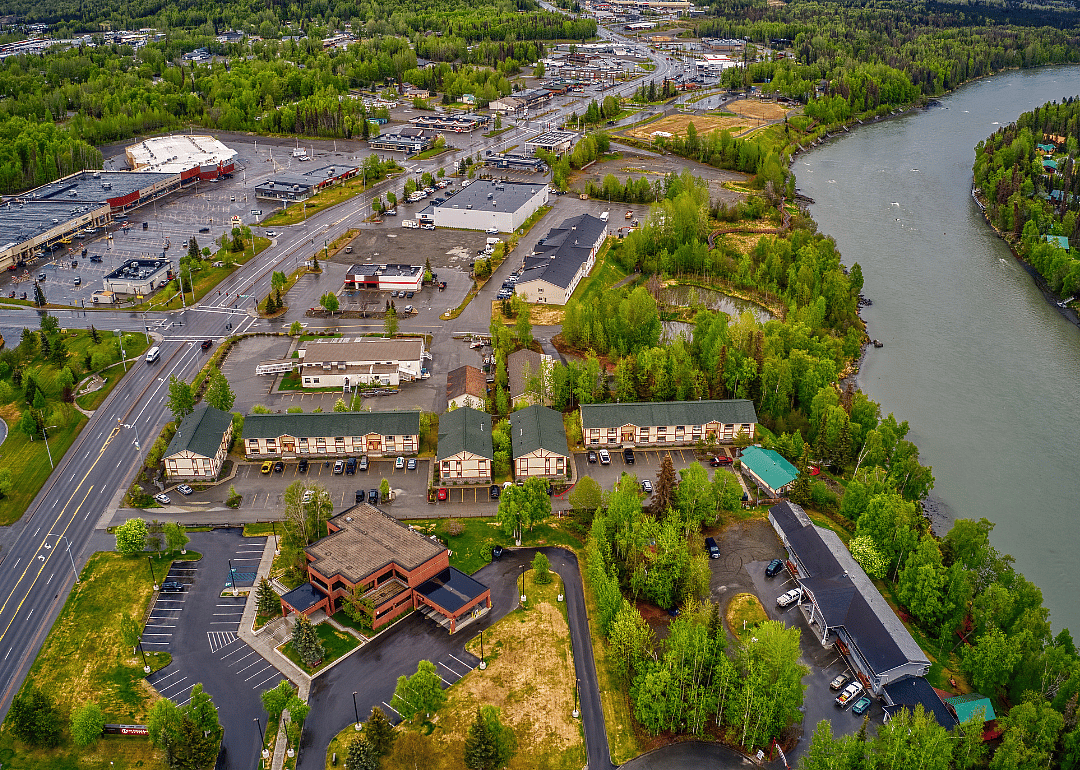
Canva
26 / 28- Cancer rate per 100,000, 2016-2020: 576.8
- Age-adjusted rate per 100,000, 2016-2020: 441.4
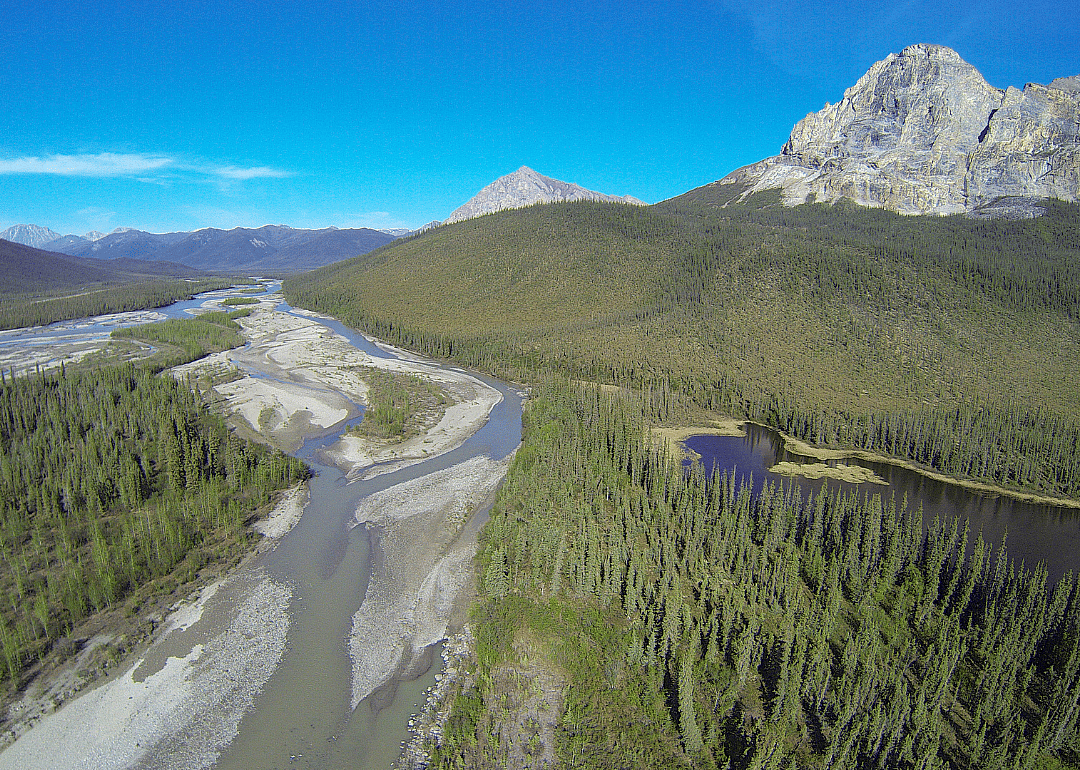
Canva
27 / 28- Cancer rate per 100,000, 2016-2020: 648.5
- Age-adjusted rate per 100,000, 2016-2020: 569.0

Canva
28 / 28- Cancer rate per 100,000, 2016-2020: 730.7
- Age-adjusted rate per 100,000, 2016-2020: 422.8