Canva
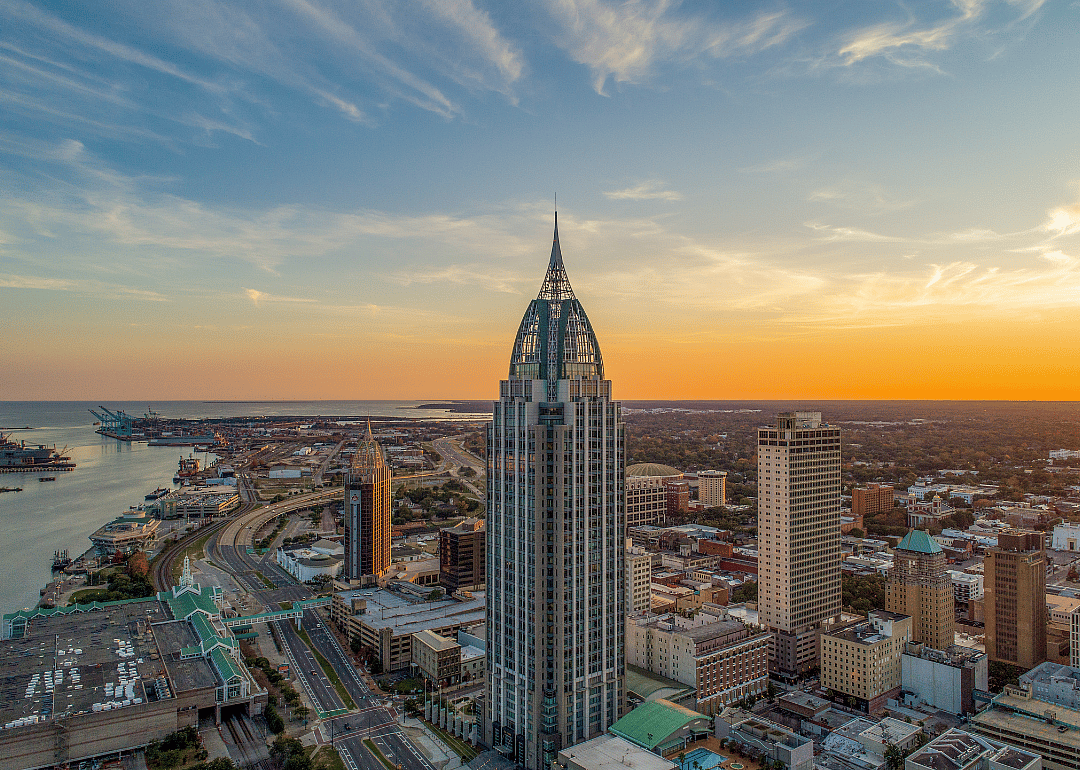
1 / 50Alabama: Mobile County
- 2022 applications: 9,792 (23.8 per 1,000 residents)
- 2021 applications: 8,782 (21.3 per 1,000 residents)

Entrepreneurship emerged in a big way over the past three years, and founders are not slowing down.
To get a more comprehensive view of where new businesses may have the most impact in coming years, PlanBuildr used Census Bureau data to find the county in each state with the most business applications per capita in 2022.
Business applications have fallen from highs in 2021 but remain well above pre-COVID-19 pandemic levels at over 400,000 applications per month. There were a little under 5.1 million business applications in 2022, compared to a record-breaking 5.4 million in 2021 and 4.4 million in 2020. Through June, there have been 2.65 million applications, meaning 2023 is on pace to rival the 2021 spike.
Prior to the pandemic, entrepreneurship had been in a lull for decades. In 2018 and 2019, a typical month would see fewer than 300,000 business applications, and in prior years the levels were even lower, Bureau of Labor Statistics data shows. Now, entrepreneurs aren't letting fears of a recession stop them. In July 2023 alone, more than 469,000 people applied for employer identification numbers—the primary way the government measures small business applicants—marking a 0.5% increase from June.
Additionally, small businesses and startups continue to grow jobs, increasing overall employment despite high-profile layoffs at larger corporations. Nearly half of all workers have jobs at small firms, so continued entrepreneurship keeps the job market strong. What's more, the pioneering spirit keeps overall economic productivity strong.
Business owners told the New York Times their experiences in the pandemic had "recession-proofed" their businesses. Now they know how to pivot and survive while financially strapped. But interest rates are up, and investors have pulled back, raising the stakes for new business owners.
Groundbreaking companies, like Uber and Airbnb, have emerged from past recessions. While consumers may be more hesitant, hiring is typically easier, and business costs are less expensive amid downturns. From offering new products to creating jobs to upholding economies, new businesses create ripples across their communities.
Read on to see which county in your state saw the most businesses set the groundwork to build their legacies. The data used on new business applications are tallied from applications for employer identification numbers from the Census Bureau. States and counties that allow business owners and operators to incorporate without residing locally may have inflated per capita numbers. Counties with fewer than 1,000 residents were excluded from the analysis.
Canva
1 / 50- 2022 applications: 9,792 (23.8 per 1,000 residents)
- 2021 applications: 8,782 (21.3 per 1,000 residents)

Canva
2 / 50- 2022 applications: 29 (26.8 per 1,000 residents)
- 2021 applications: 10 (8.8 per 1,000 residents)

Sean Pavone // Shutterstock
3 / 50- 2022 applications: 83,305 (18.3 per 1,000 residents)
- 2021 applications: 83,458 (18.6 per 1,000 residents)

Canva
4 / 50- 2022 applications: 328 (21.4 per 1,000 residents)
- 2021 applications: 347 (21.9 per 1,000 residents)
Canva
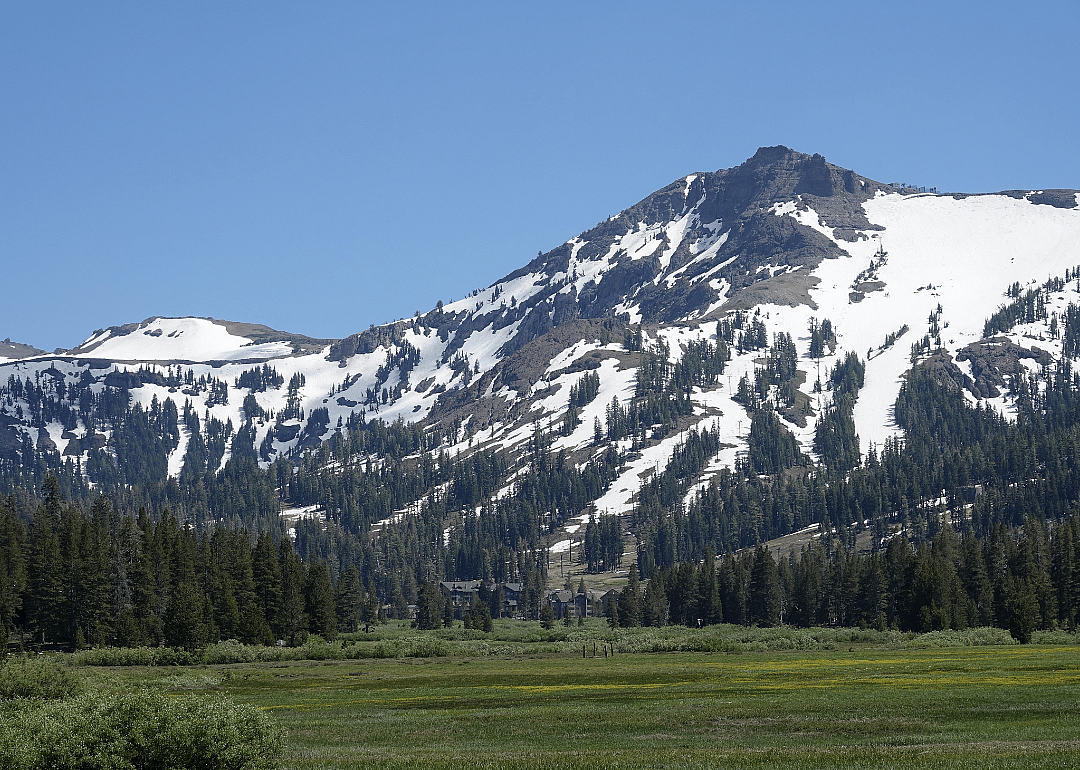
5 / 50- 2022 applications: 21 (17.6 per 1,000 residents)
- 2021 applications: 23 (18.6 per 1,000 residents)

Canva
6 / 50- 2022 applications: 671 (39.8 per 1,000 residents)
- 2021 applications: 727 (41.9 per 1,000 residents)
Canva
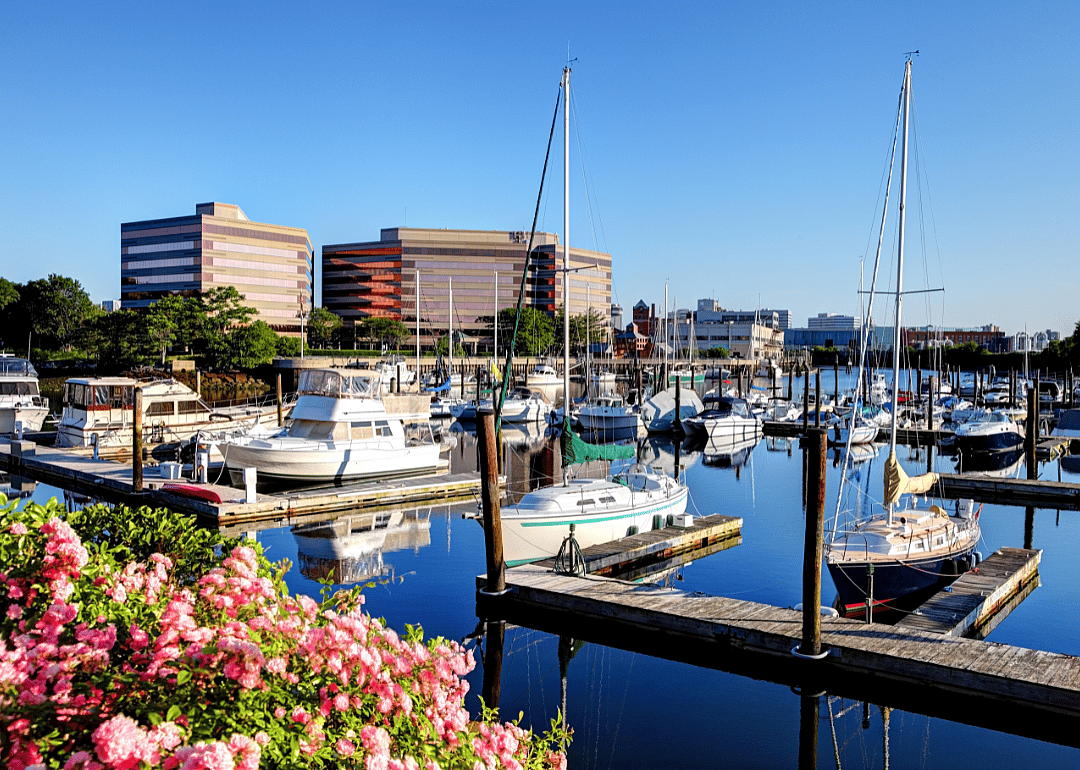
7 / 50- 2022 applications: 11,118 (17.8 per 1,000 residents)
- 2021 applications: Not available: Prior to 2022, data were collected for Connecticut's former counties rather than its new planning regions. (0.0 per 1,000 residents)
Nagel Photography // Shutterstock
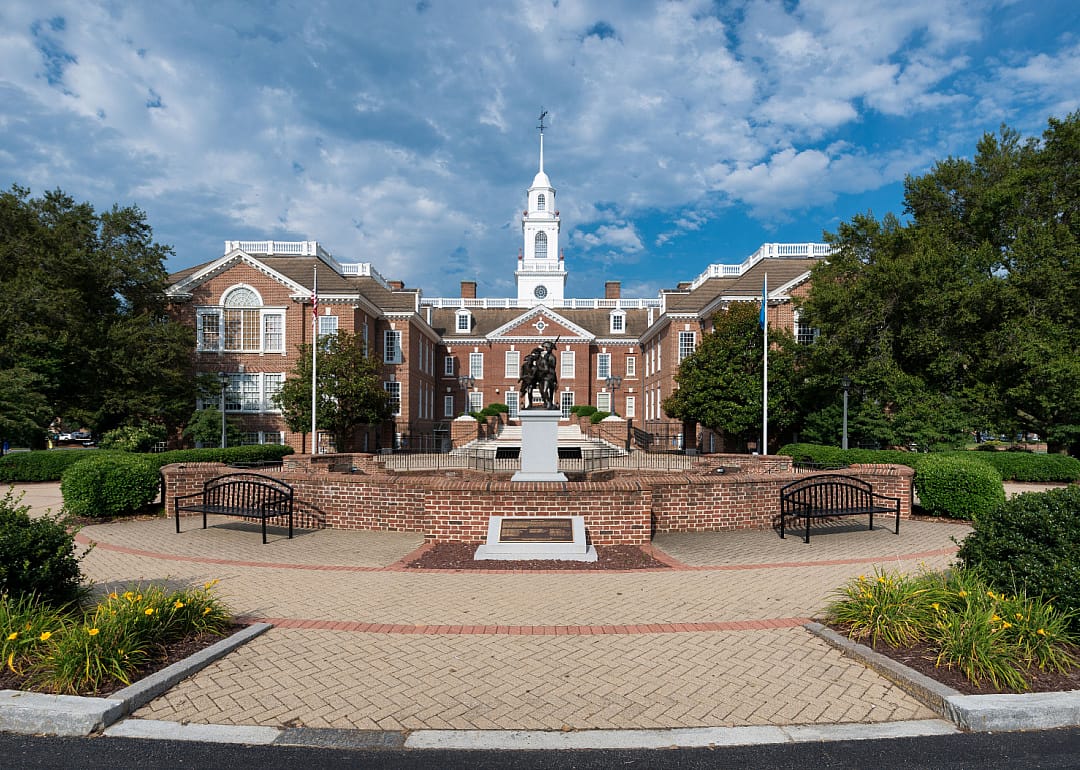
8 / 50- 2022 applications: 12,961 (69.3 per 1,000 residents)
- 2021 applications: 11,552 (62.7 per 1,000 residents)
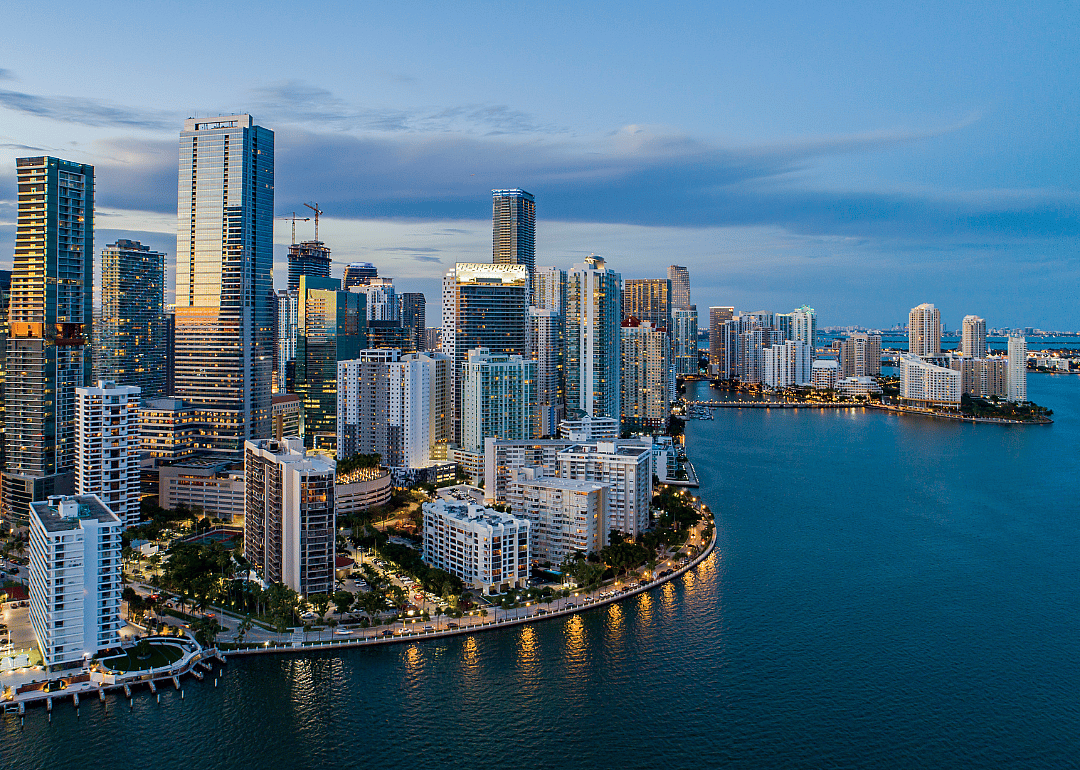
Canva
9 / 50- 2022 applications: 127,895 (47.8 per 1,000 residents)
- 2021 applications: 136,137 (51.0 per 1,000 residents)
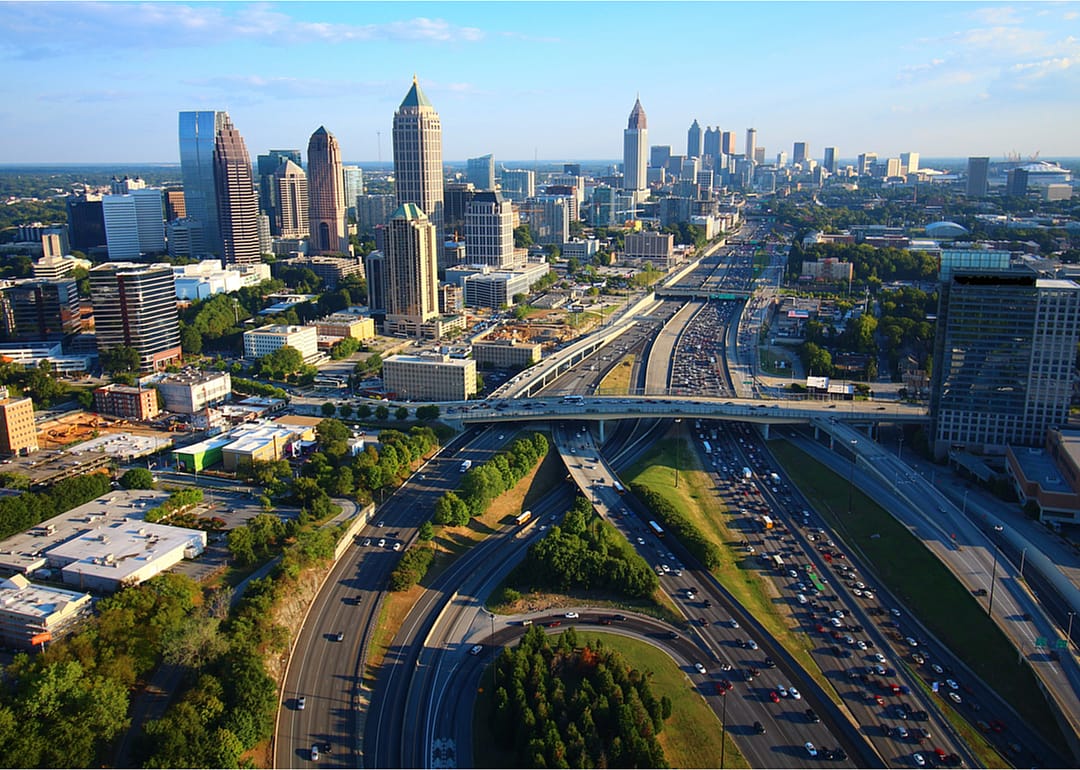
Brett Barnhill // Shutterstock
10 / 50- 2022 applications: 50,118 (46.6 per 1,000 residents)
- 2021 applications: 60,986 (57.4 per 1,000 residents)
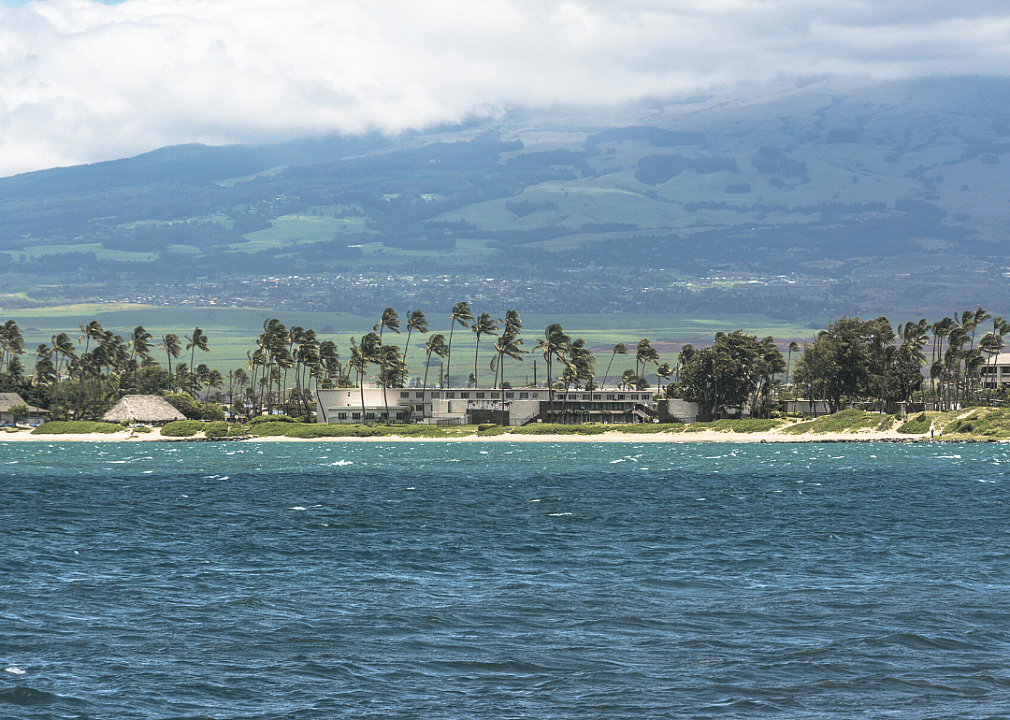
pikappa51 // Shutterstock
11 / 50- 2022 applications: 2,778 (16.9 per 1,000 residents)
- 2021 applications: 2,935 (17.8 per 1,000 residents)
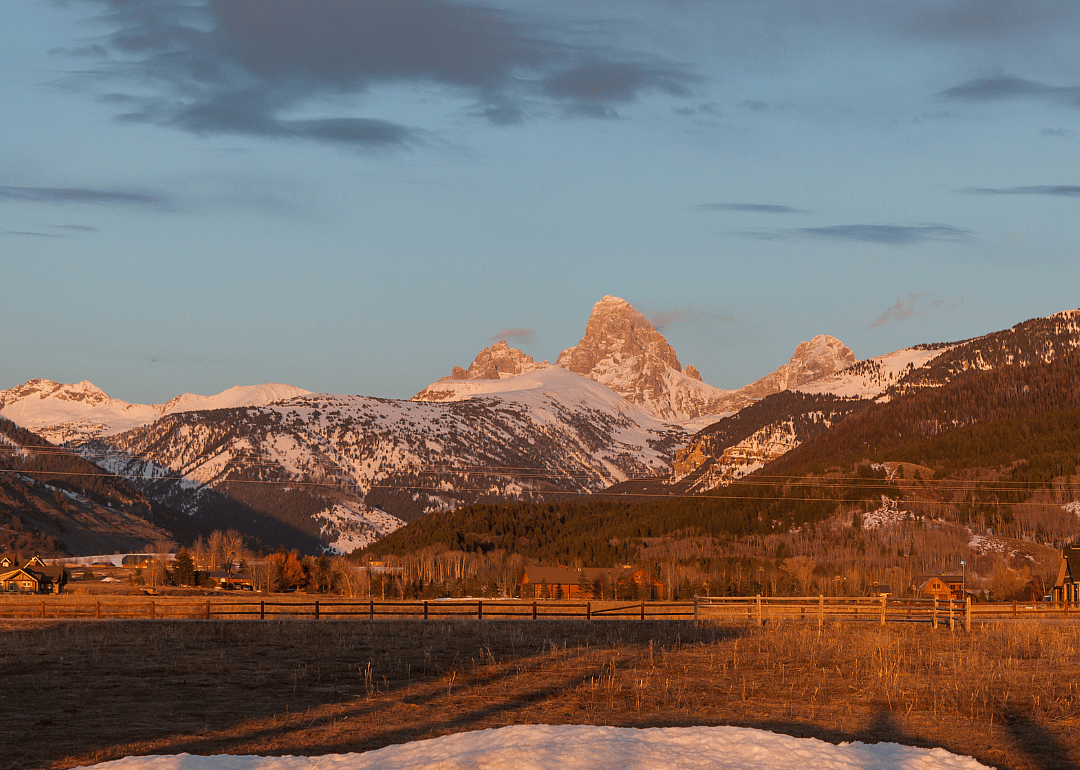
Canva
12 / 50- 2022 applications: 298 (23.8 per 1,000 residents)
- 2021 applications: 308 (25.1 per 1,000 residents)

Canva
13 / 50- 2022 applications: 93,690 (18.3 per 1,000 residents)
- 2021 applications: 118,523 (22.9 per 1,000 residents)

Sean Pavone // Shutterstock
14 / 50- 2022 applications: 22,226 (22.9 per 1,000 residents)
- 2021 applications: 25,352 (26.1 per 1,000 residents)
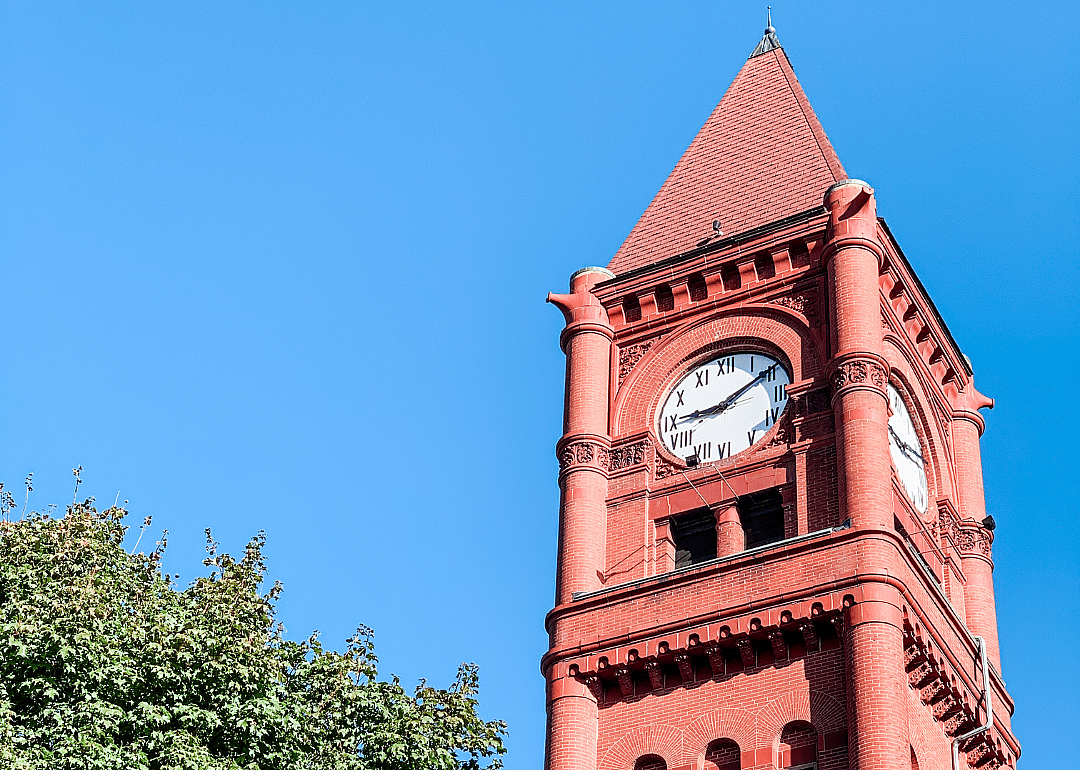
stivanderson // Shutterstock
15 / 50- 2022 applications: 221 (14.1 per 1,000 residents)
- 2021 applications: 225 (14.3 per 1,000 residents)
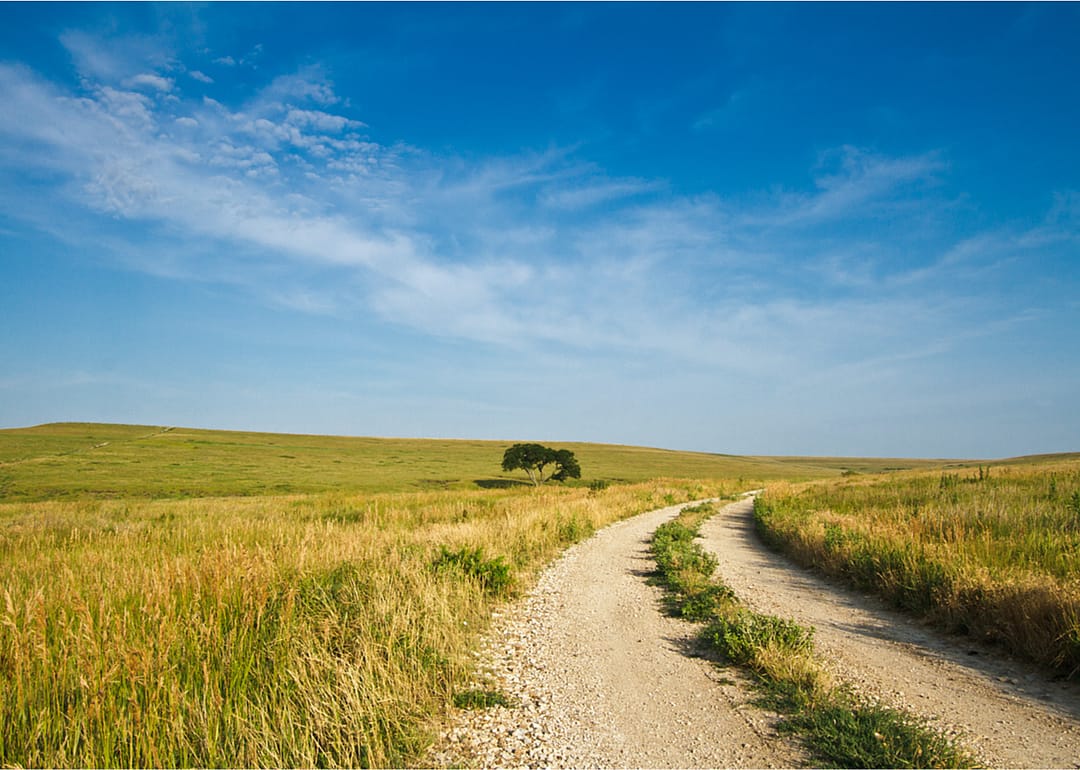
TommyBrison // Shutterstock
16 / 50- 2022 applications: 45 (28.9 per 1,000 residents)
- 2021 applications: 22 (14.0 per 1,000 residents)

f11photo // Shutterstock
17 / 50- 2022 applications: 12,082 (15.6 per 1,000 residents)
- 2021 applications: 12,973 (16.7 per 1,000 residents)

Canva
18 / 50- 2022 applications: 9,408 (25.4 per 1,000 residents)
- 2021 applications: 12,809 (34.0 per 1,000 residents)
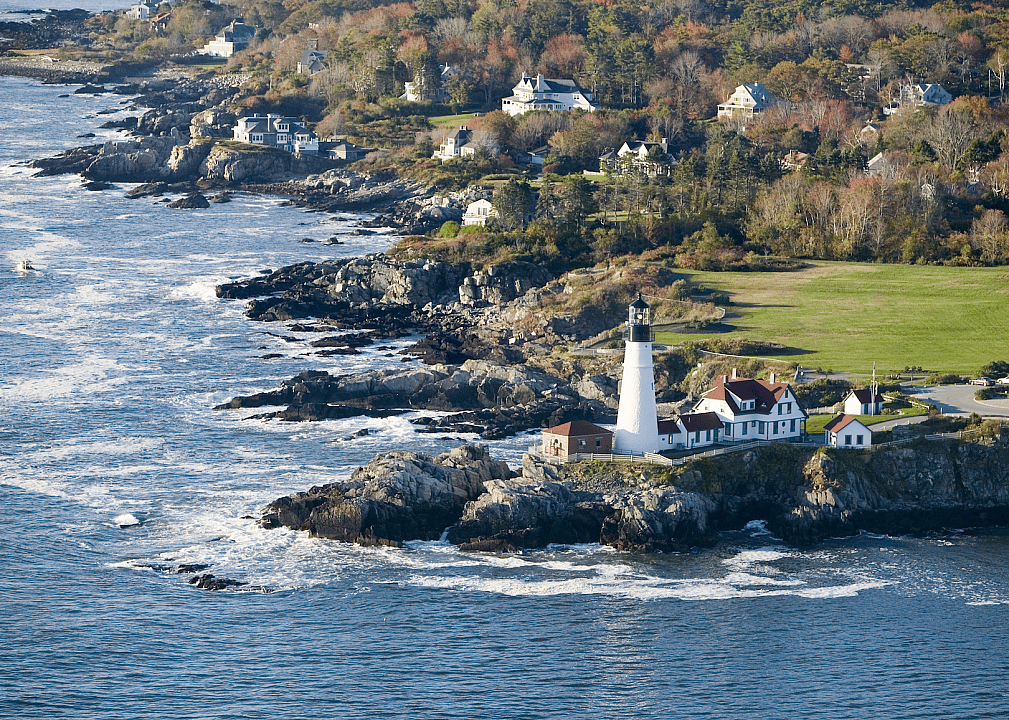
Joseph Sohm // Shutterstock
19 / 50- 2022 applications: 3,670 (11.9 per 1,000 residents)
- 2021 applications: 3,803 (12.4 per 1,000 residents)
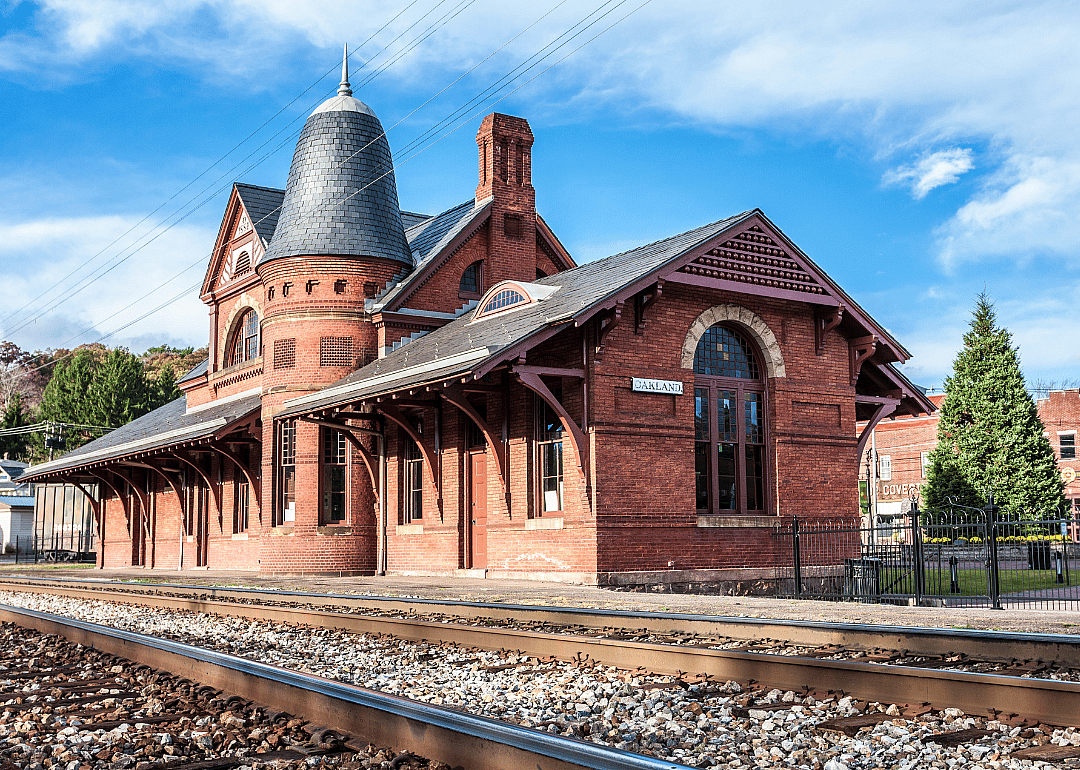
Canva
20 / 50- 2022 applications: 748 (26.2 per 1,000 residents)
- 2021 applications: 579 (20.1 per 1,000 residents)
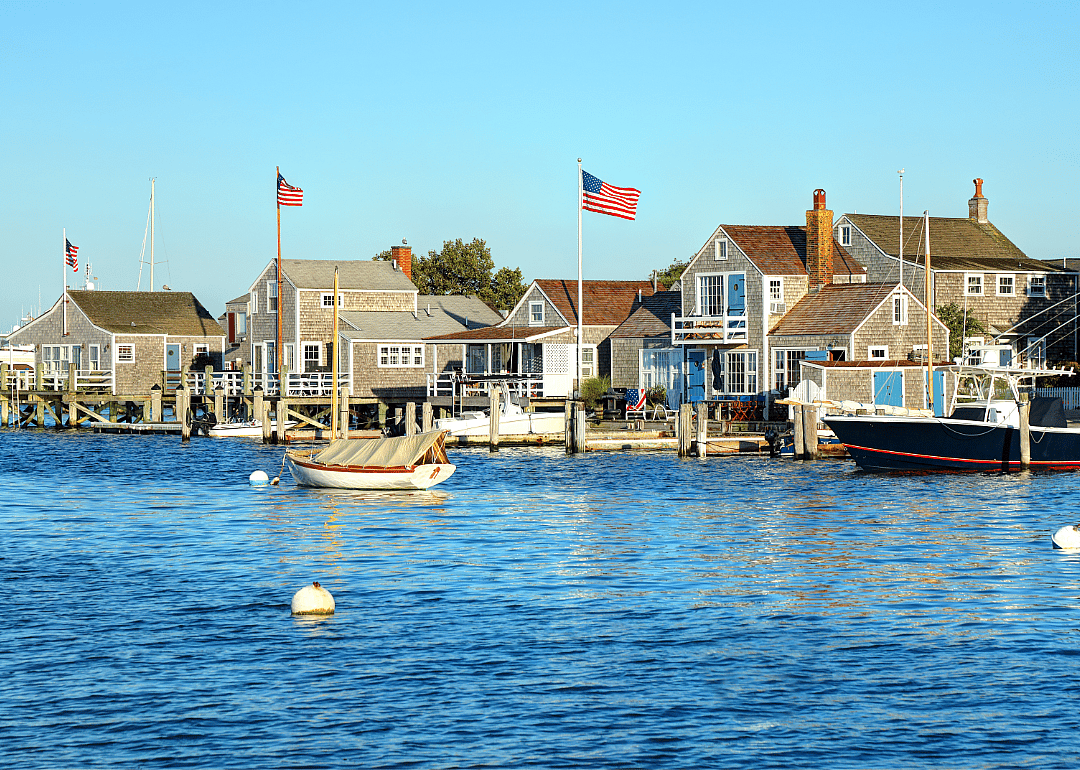
Canva
21 / 50- 2022 applications: 433 (30.0 per 1,000 residents)
- 2021 applications: 344 (23.7 per 1,000 residents)

Canva
22 / 50- 2022 applications: 39,328 (22.4 per 1,000 residents)
- 2021 applications: 47,565 (26.8 per 1,000 residents)
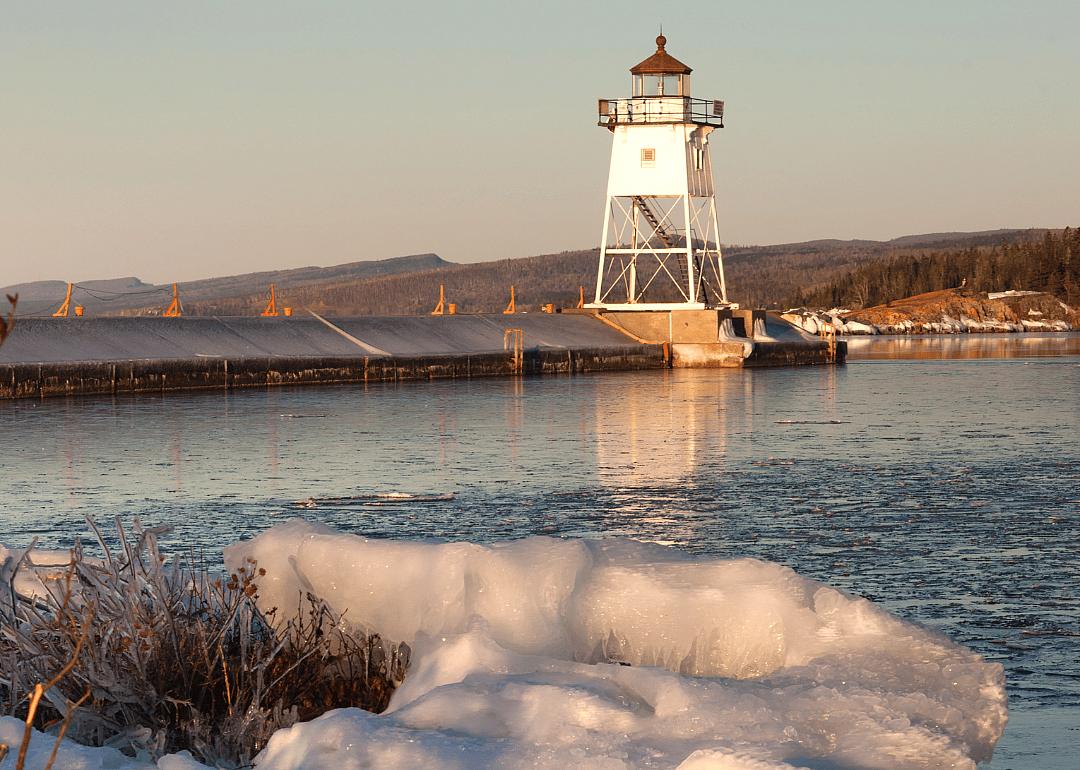
Canva
23 / 50- 2022 applications: 94 (16.5 per 1,000 residents)
- 2021 applications: 81 (14.4 per 1,000 residents)
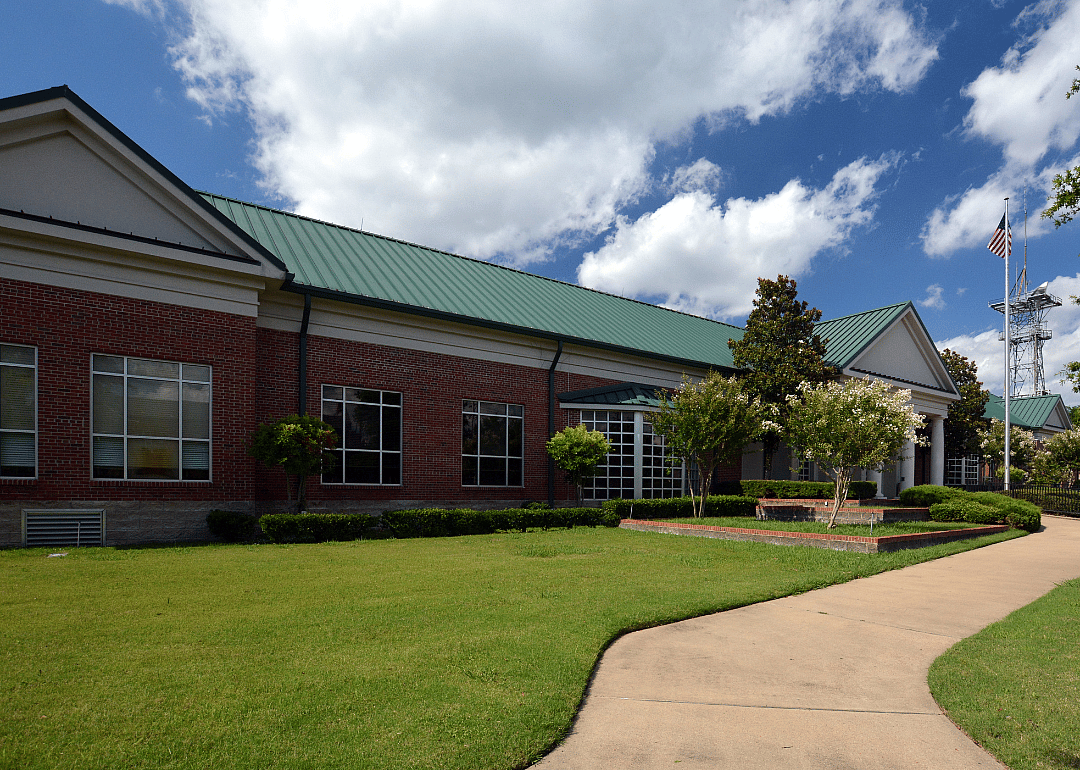
Canva
24 / 50- 2022 applications: 774 (38.3 per 1,000 residents)
- 2021 applications: 754 (36.4 per 1,000 residents)

Sean Pavone // Shutterstock
25 / 50- 2022 applications: 6,422 (22.4 per 1,000 residents)
- 2021 applications: 7,803 (26.6 per 1,000 residents)

Canva
26 / 50- 2022 applications: 4,219 (37.7 per 1,000 residents)
- 2021 applications: 3,521 (32.4 per 1,000 residents)
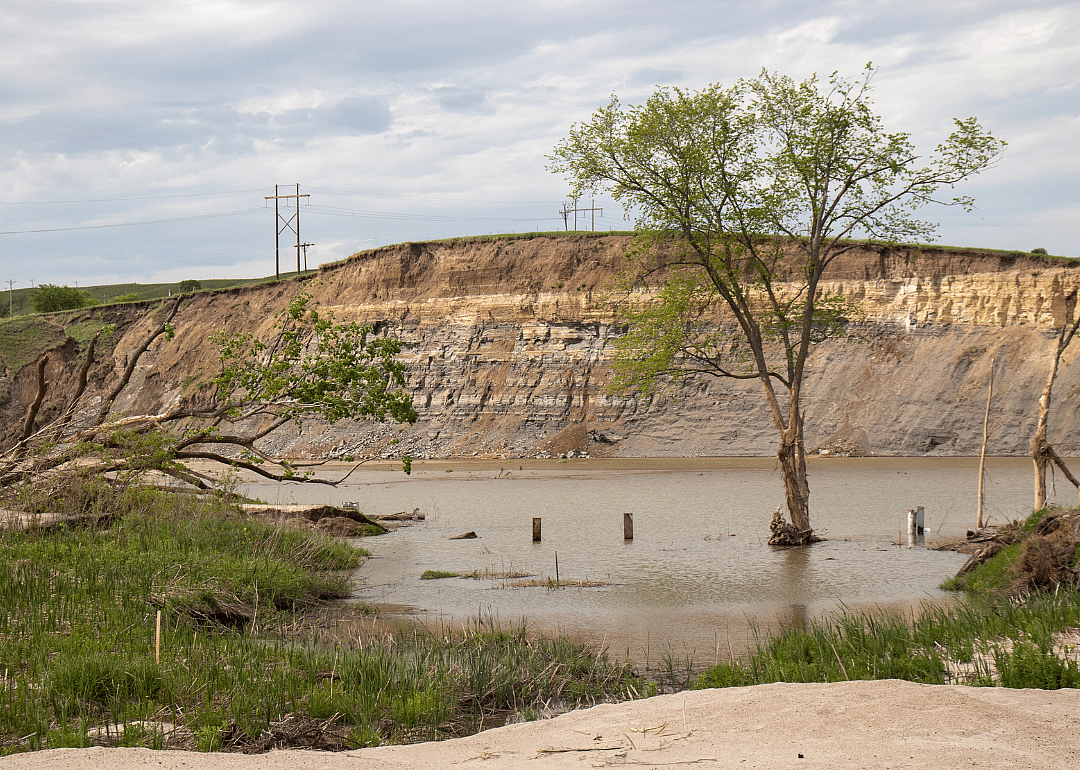
Canva
27 / 50- 2022 applications: 33 (19.0 per 1,000 residents)
- 2021 applications: 18 (10.1 per 1,000 residents)

randy andy // Shutterstock
28 / 50- 2022 applications: 49,369 (21.3 per 1,000 residents)
- 2021 applications: 55,475 (24.2 per 1,000 residents)
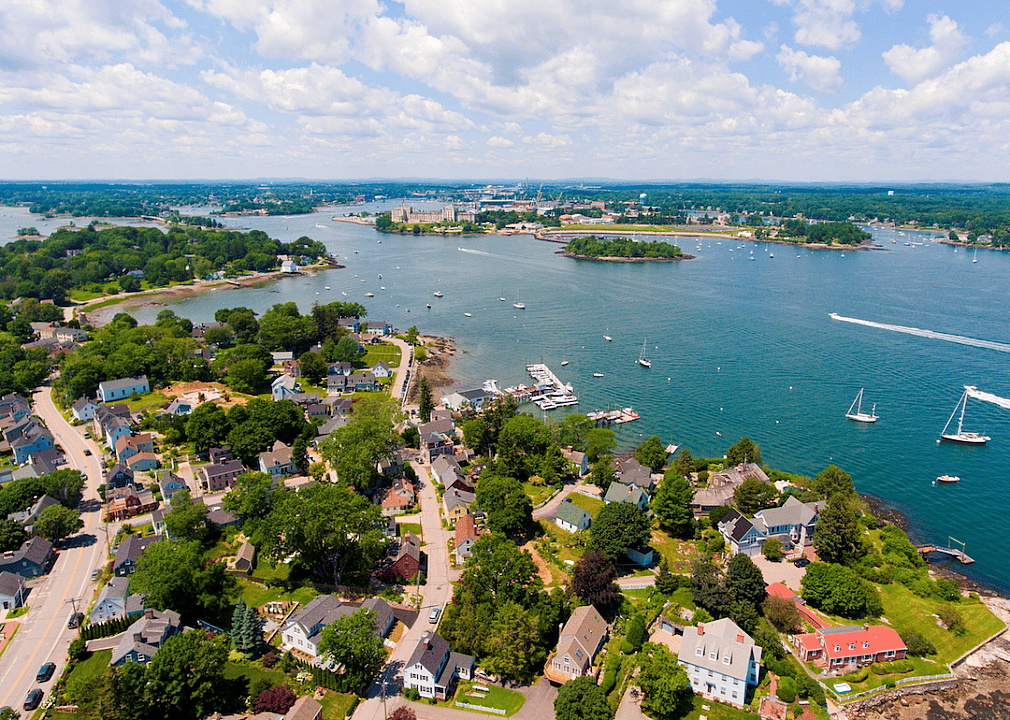
Wangkun Jia // Shutterstock
29 / 50- 2022 applications: 3,582 (11.2 per 1,000 residents)
- 2021 applications: 3,559 (11.2 per 1,000 residents)
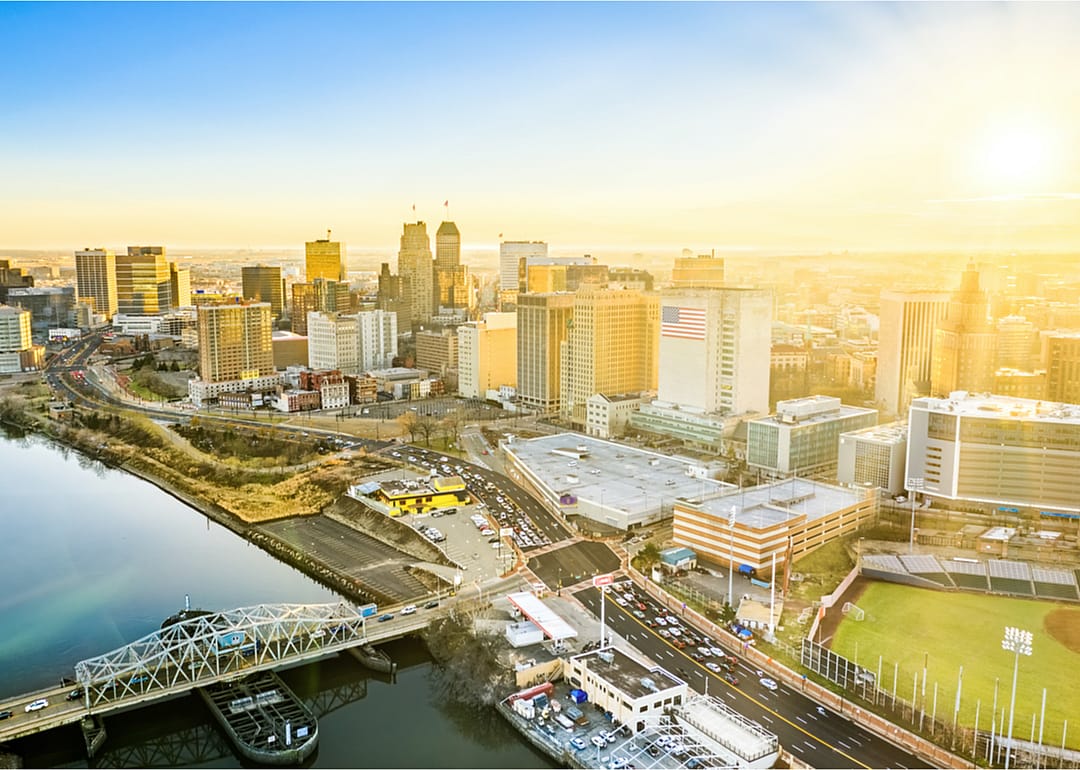
Mihai_Andritoiu // Shutterstock
30 / 50- 2022 applications: 18,114 (21.3 per 1,000 residents)
- 2021 applications: 21,329 (25.0 per 1,000 residents)
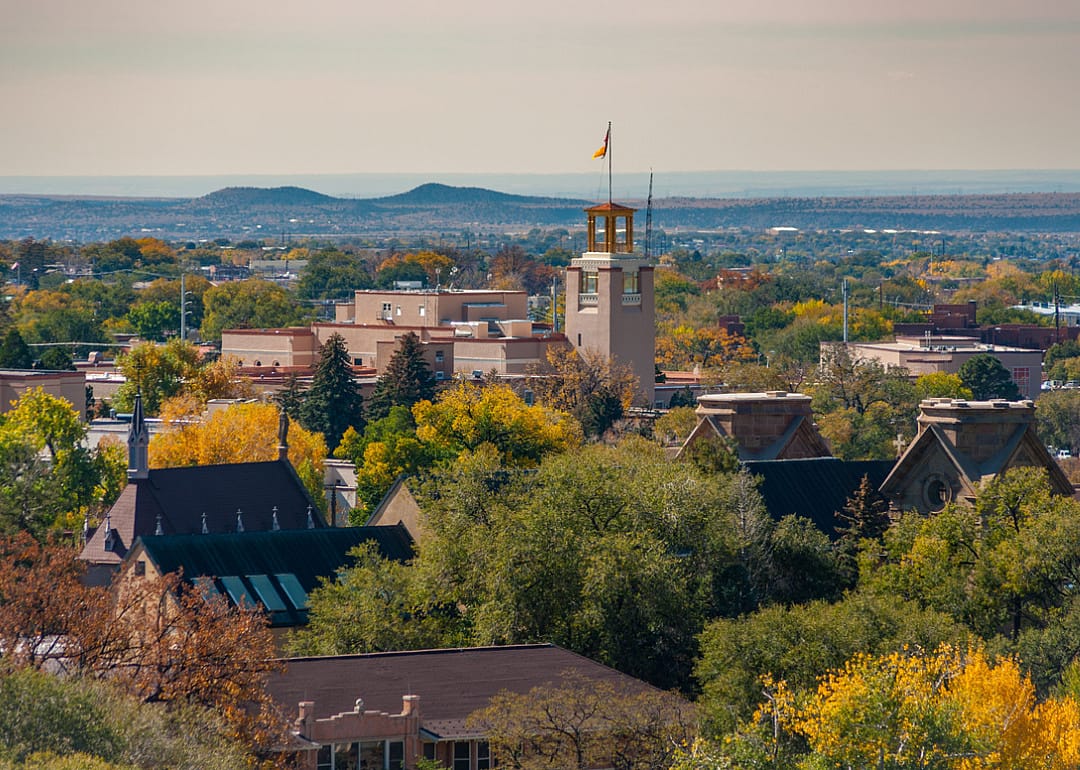
Jimack // Shutterstock
31 / 50- 2022 applications: 4,338 (27.9 per 1,000 residents)
- 2021 applications: 3,683 (23.7 per 1,000 residents)
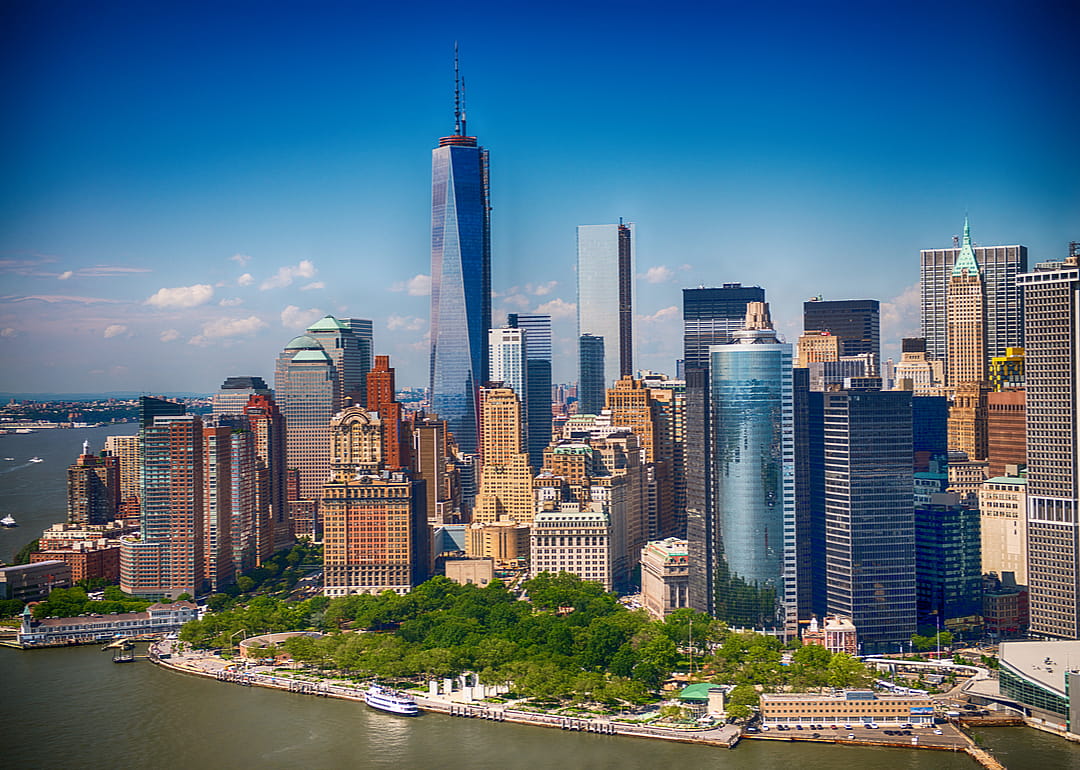
pisaphotography // Shutterstock
32 / 50- 2022 applications: 50,149 (31.4 per 1,000 residents)
- 2021 applications: 53,217 (33.7 per 1,000 residents)
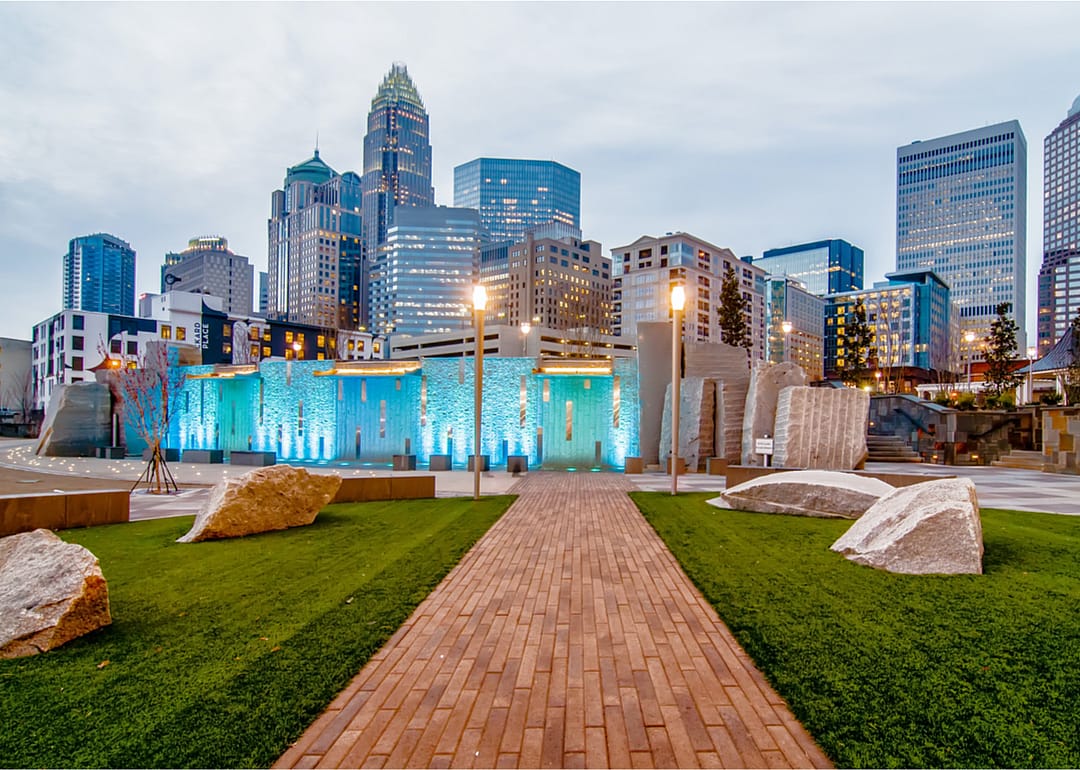
digidreamgrafix // Shutterstock
33 / 50- 2022 applications: 29,600 (25.8 per 1,000 residents)
- 2021 applications: 34,052 (30.2 per 1,000 residents)
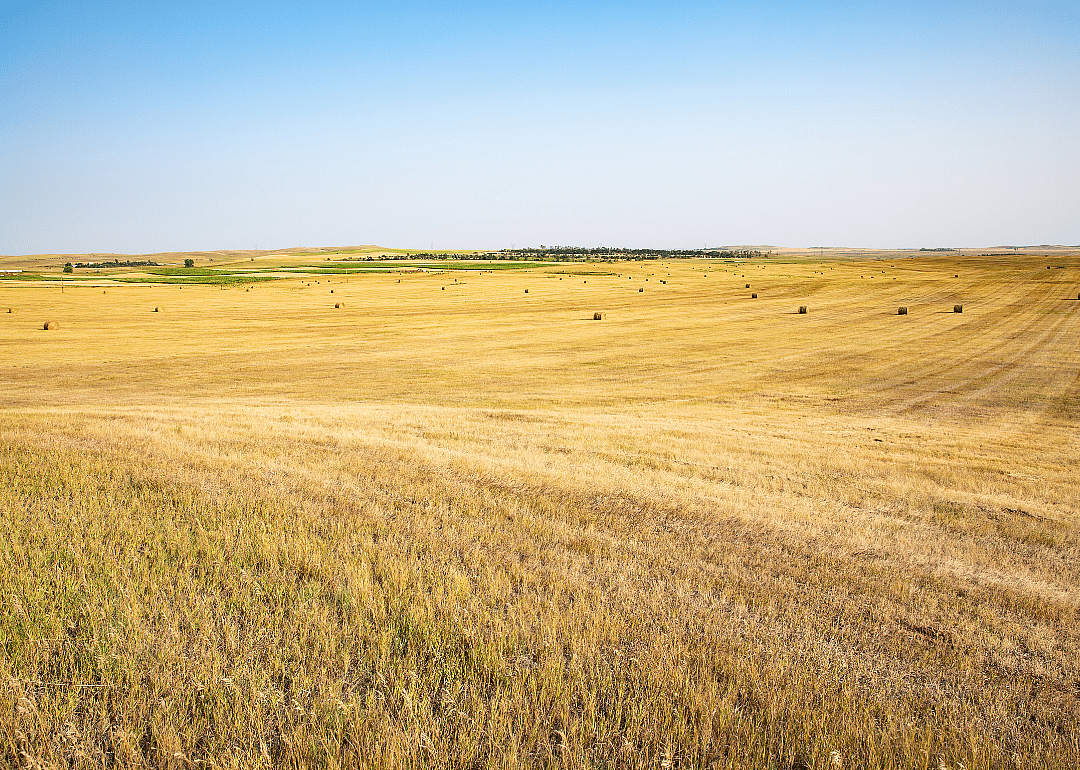
Traveller70 // Shutterstock
34 / 50- 2022 applications: 88 (21.9 per 1,000 residents)
- 2021 applications: 62 (15.4 per 1,000 residents)

Sean Pavone // Shutterstock
35 / 50- 2022 applications: 24,370 (18.4 per 1,000 residents)
- 2021 applications: 26,733 (20.3 per 1,000 residents)
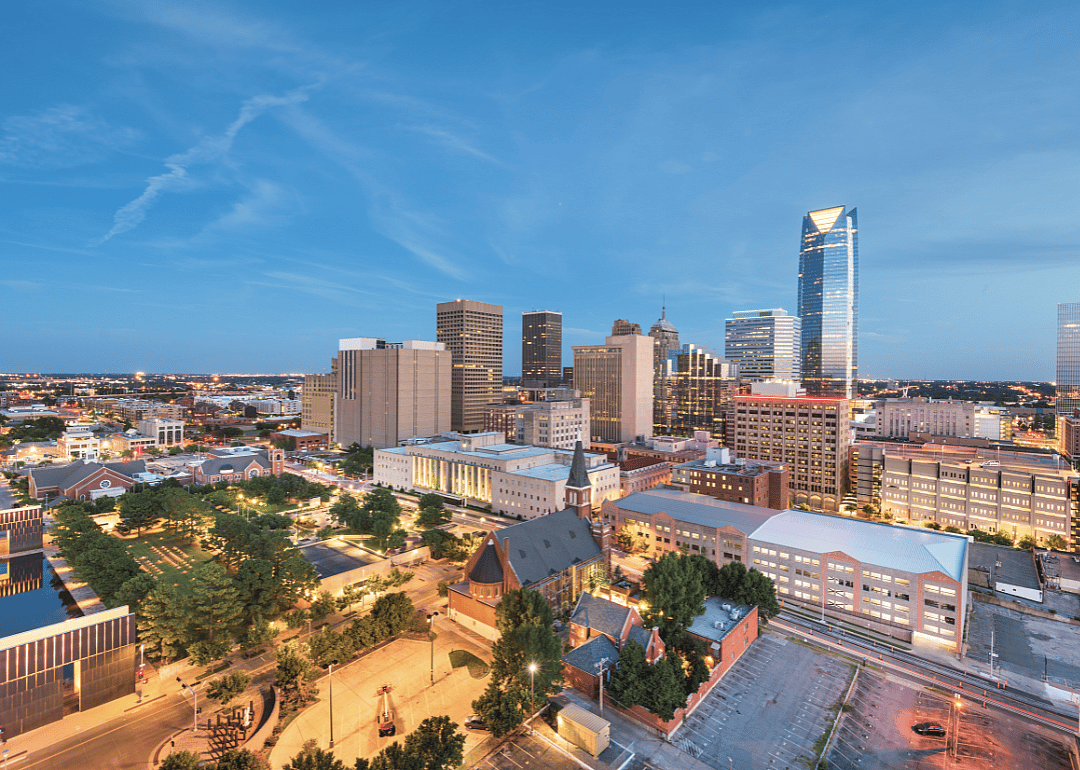
Canva
36 / 50- 2022 applications: 14,955 (18.6 per 1,000 residents)
- 2021 applications: 16,158 (20.2 per 1,000 residents)
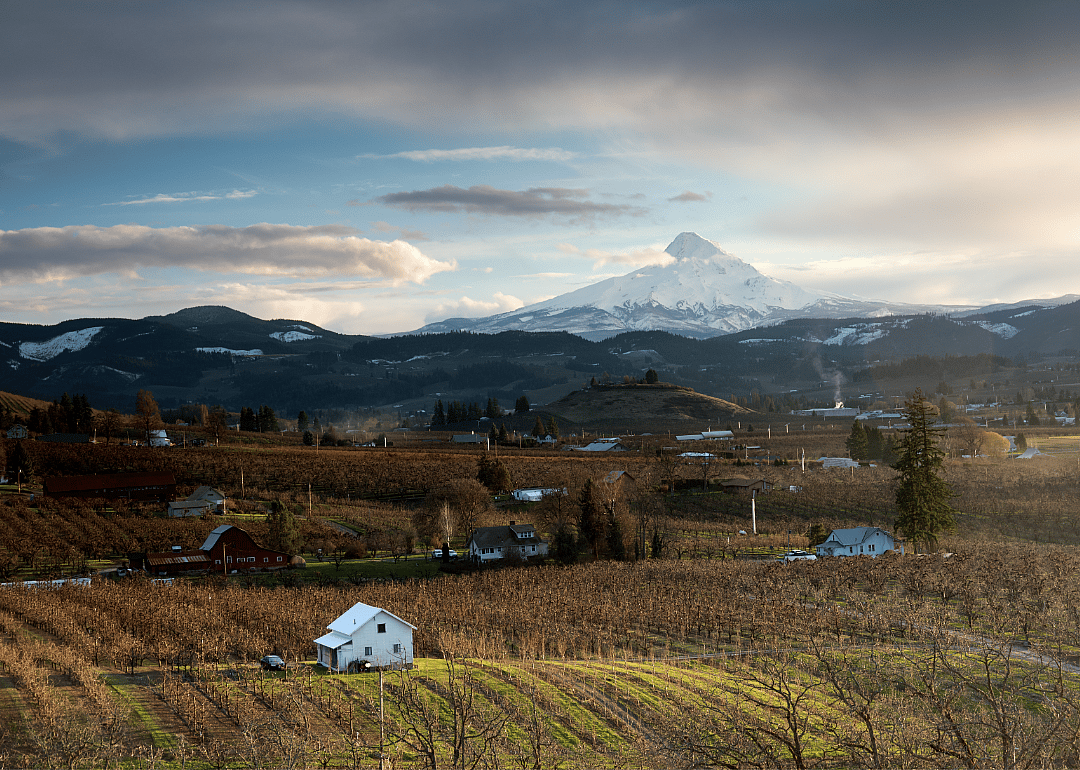
Canva
37 / 50- 2022 applications: 409 (17.0 per 1,000 residents)
- 2021 applications: 352 (14.6 per 1,000 residents)
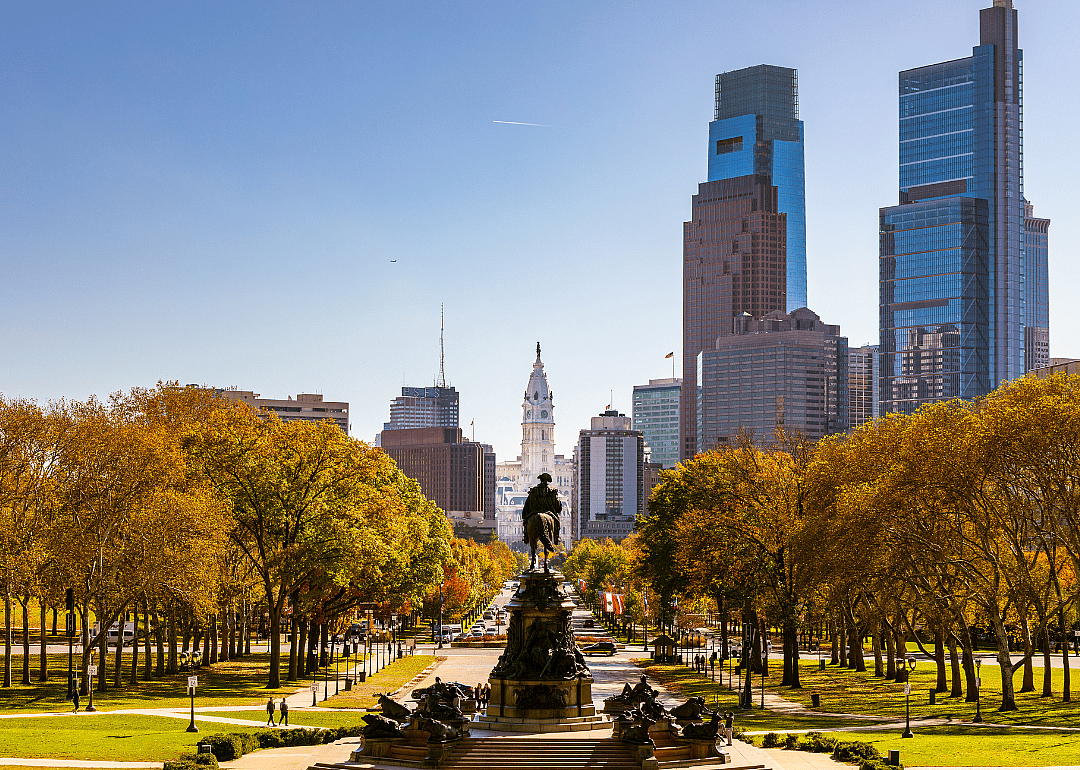
Canva
38 / 50- 2022 applications: 29,166 (18.6 per 1,000 residents)
- 2021 applications: 42,298 (26.6 per 1,000 residents)
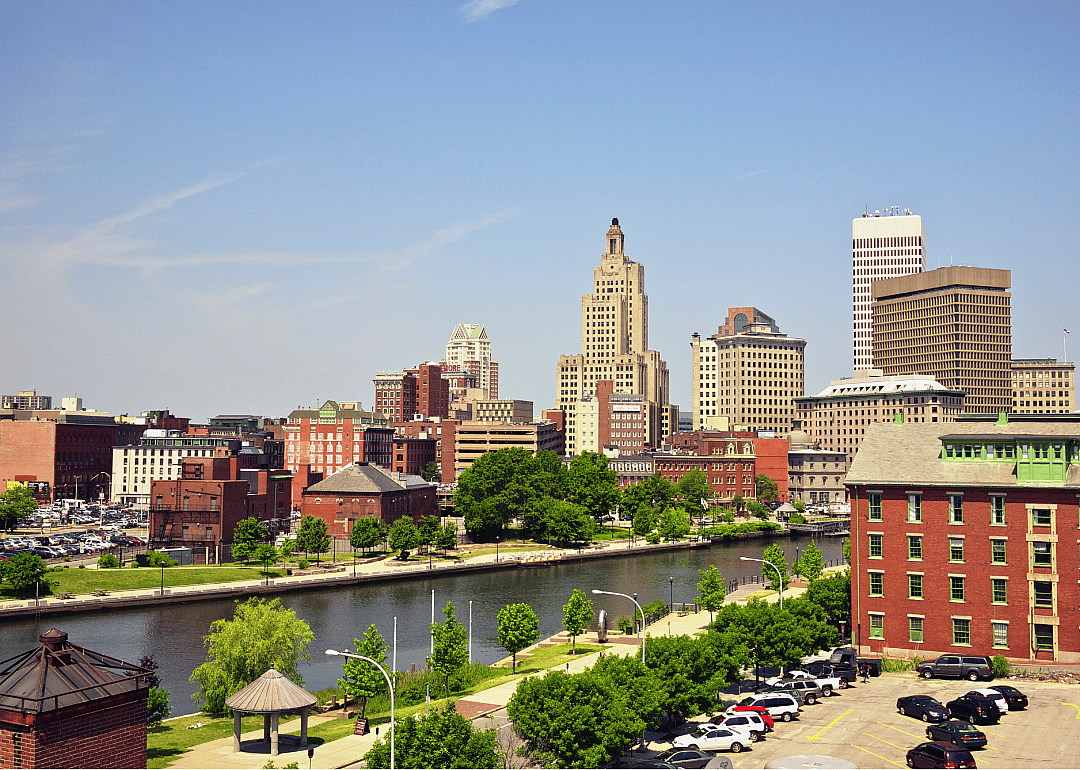
Canva
39 / 50- 2022 applications: 7,055 (10.7 per 1,000 residents)
- 2021 applications: 7,450 (11.3 per 1,000 residents)

Canva
40 / 50- 2022 applications: 10,138 (24.2 per 1,000 residents)
- 2021 applications: 10,561 (25.5 per 1,000 residents)

Canva
41 / 50- 2022 applications: 37 (20.3 per 1,000 residents)
- 2021 applications: 19 (10.4 per 1,000 residents)

Canva
42 / 50- 2022 applications: 15,302 (21.6 per 1,000 residents)
- 2021 applications: 15,871 (22.6 per 1,000 residents)
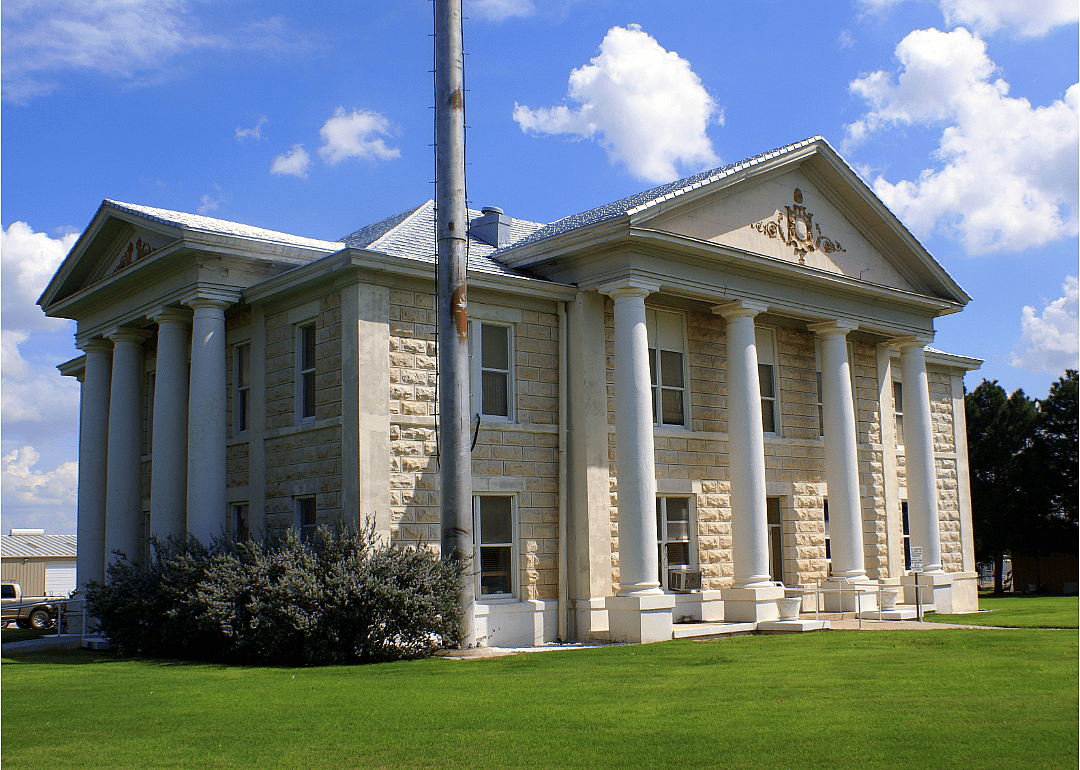
Canva
43 / 50- 2022 applications: 30 (25.8 per 1,000 residents)
- 2021 applications: 13 (11.4 per 1,000 residents)
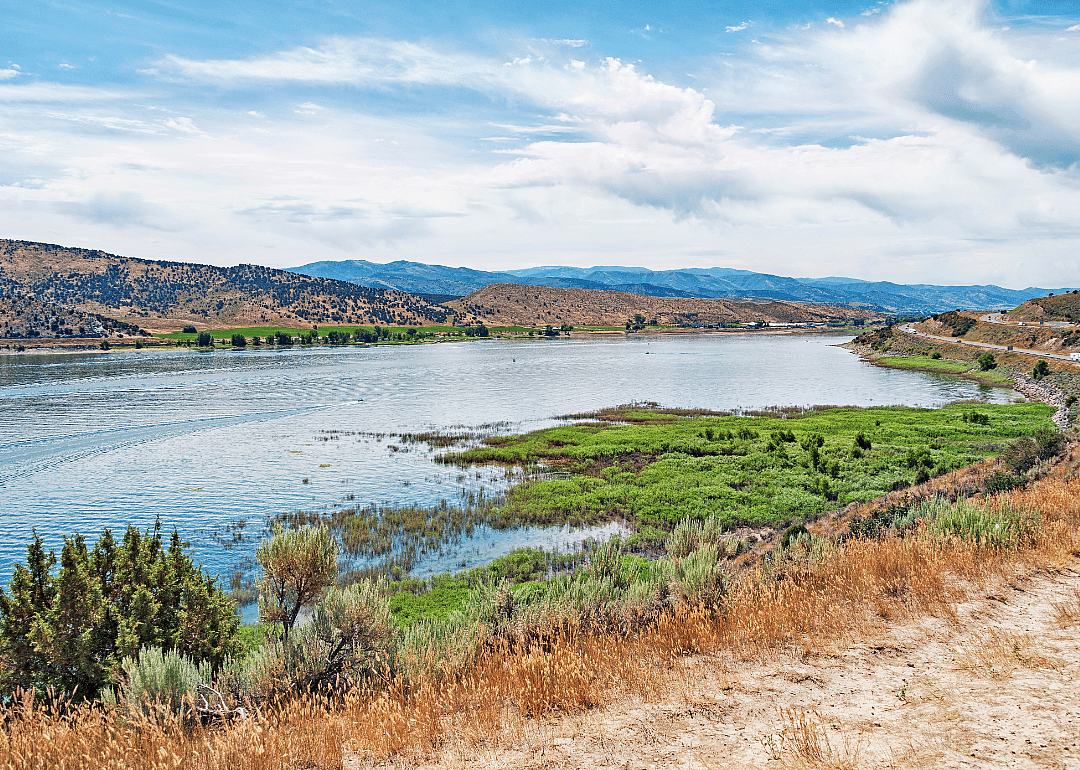
Canva
44 / 50- 2022 applications: 1,291 (30.0 per 1,000 residents)
- 2021 applications: 1,457 (33.8 per 1,000 residents)
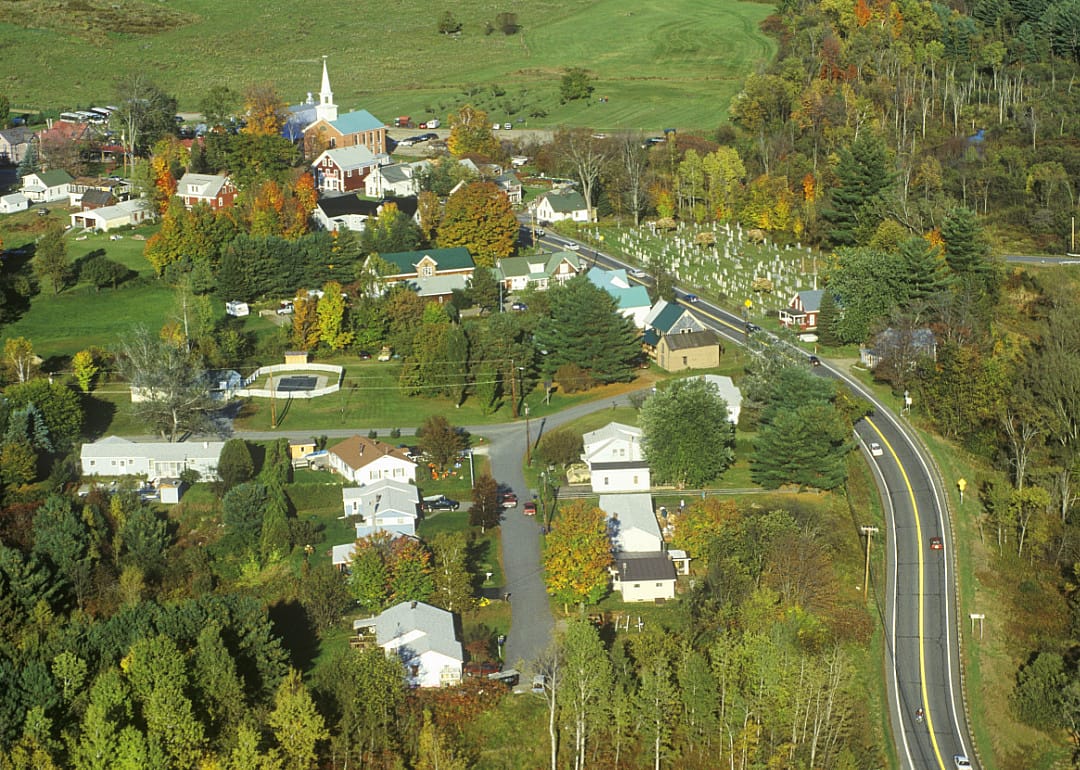
Joseph Sohm // Shutterstock
45 / 50- 2022 applications: 374 (14.3 per 1,000 residents)
- 2021 applications: 322 (12.3 per 1,000 residents)
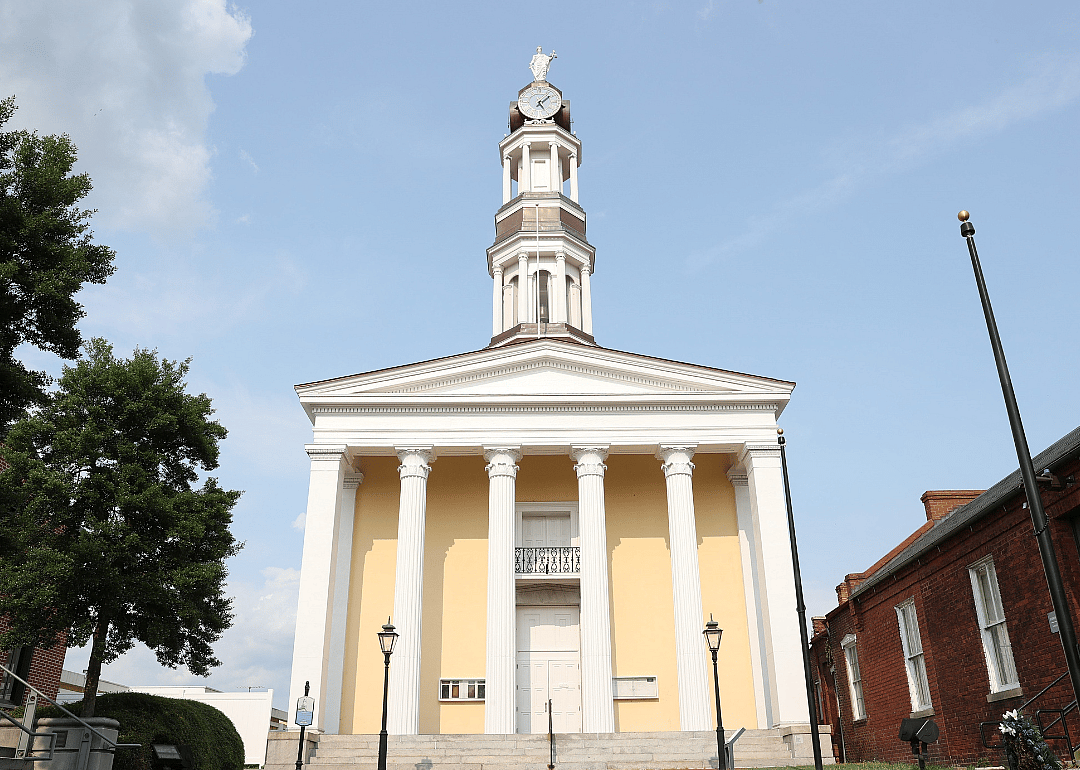
OJUP // Shutterstock
46 / 50- 2022 applications: 797 (23.9 per 1,000 residents)
- 2021 applications: 1,017 (30.5 per 1,000 residents)

Canva
47 / 50- 2022 applications: 273 (14.6 per 1,000 residents)
- 2021 applications: 356 (19.1 per 1,000 residents)
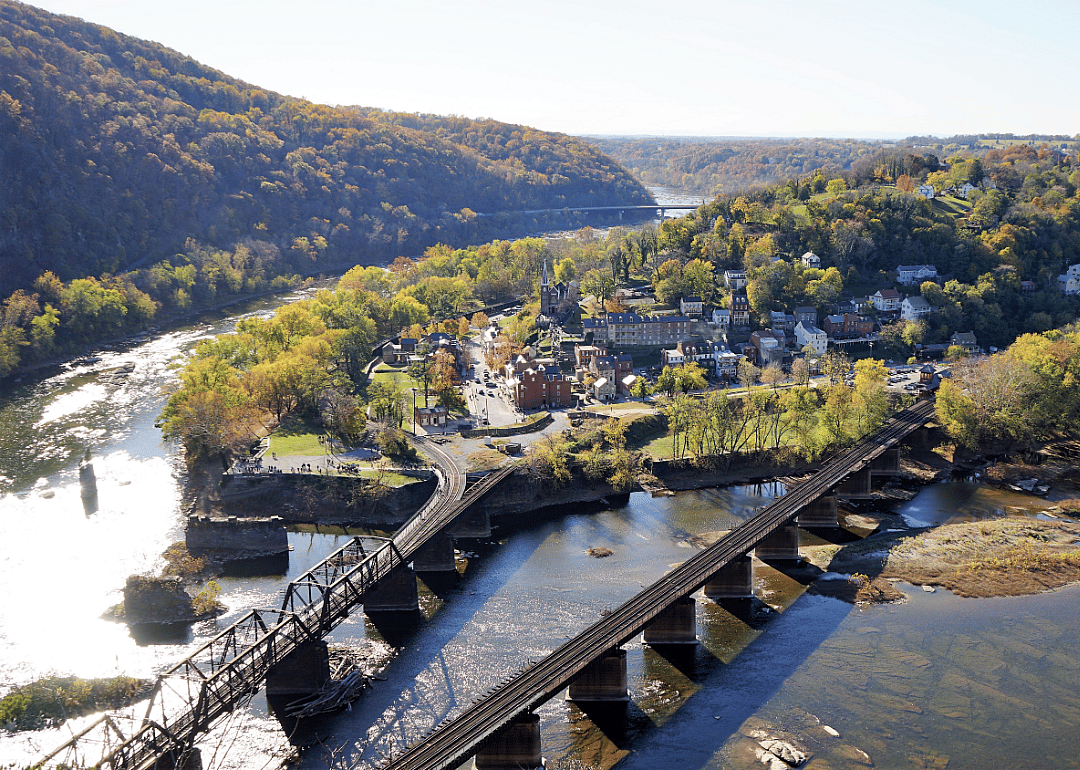
Canva
48 / 50- 2022 applications: 646 (11.0 per 1,000 residents)
- 2021 applications: 569 (9.7 per 1,000 residents)
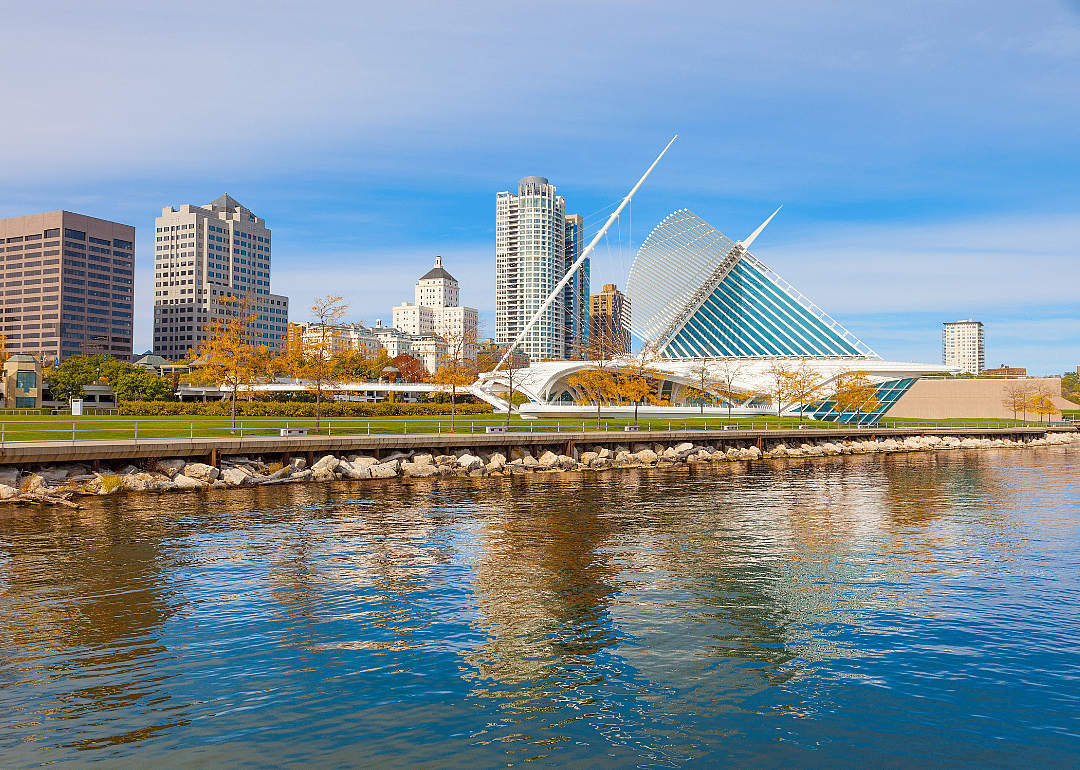
Canva
49 / 50- 2022 applications: 18,019 (19.6 per 1,000 residents)
- 2021 applications: 19,542 (21.1 per 1,000 residents)
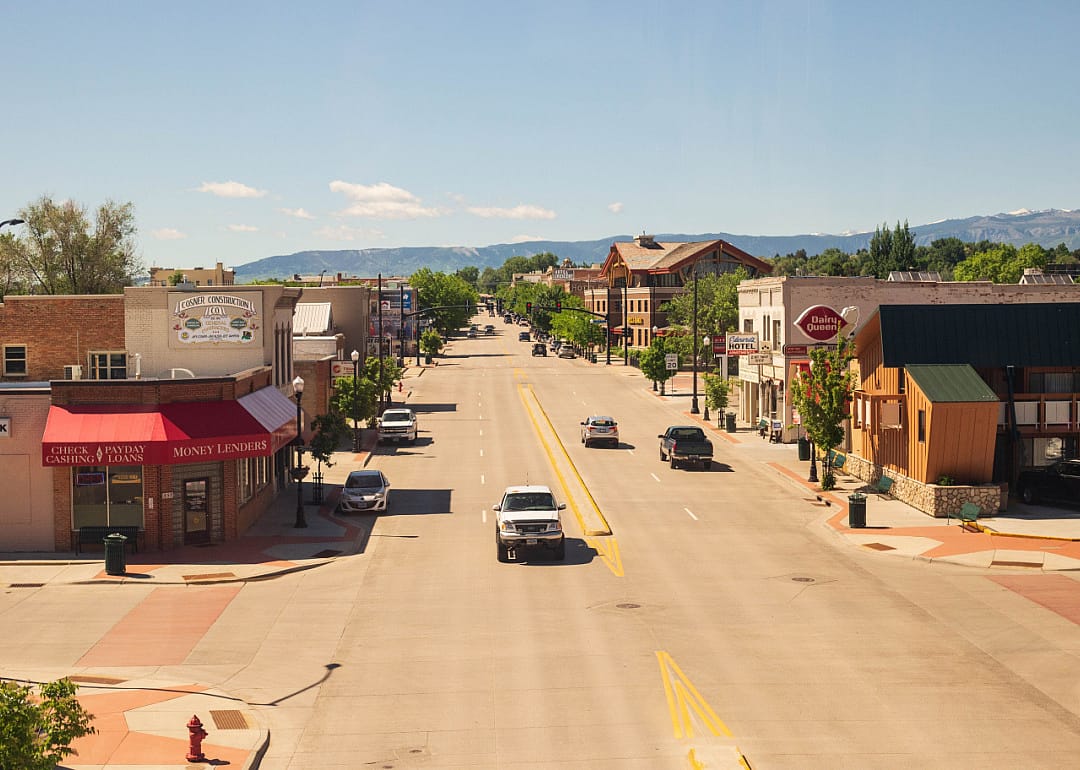
Ems Images // Shutterstock
50 / 50- 2022 applications: 22,389 (697.6 per 1,000 residents)
- 2021 applications: 17,043 (538.2 per 1,000 residents)
Data reporting by Paxtyn Merten. Story editing by Jeff Inglis. Copy editing by Paris Close.