Stacker
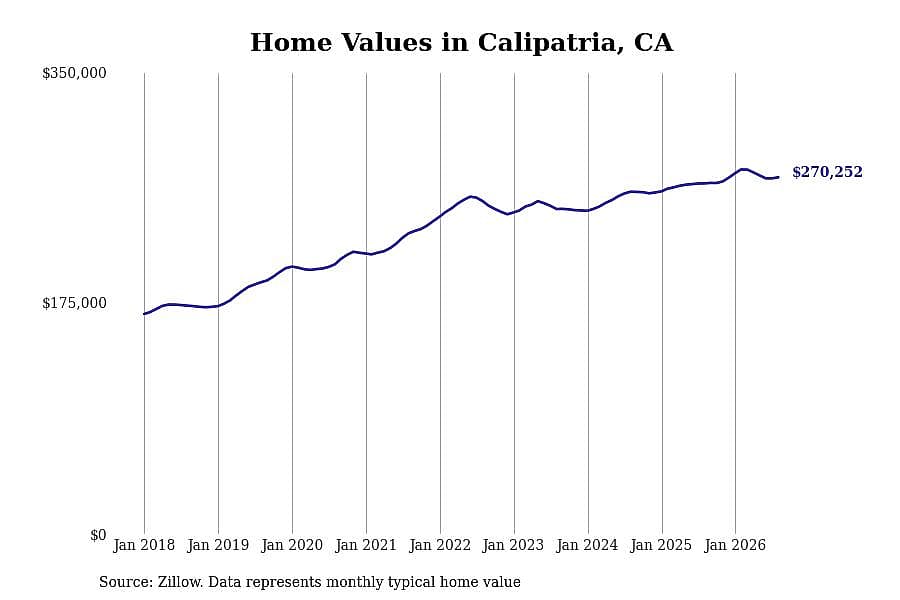
1 / 7#7. Calipatria, CA
- Typical home value: $270,252
- 1-year price change: +1.8%
- 5-year price change: +18.6%

Purchasing a home is one of the most important investments there is. More than a place to live, homeownership is an asset with the potential to tremendously rise in value. But with home prices reaching record heights, affordability plays a huge role for buyers.
The typical home value in the United States was $369,678 in August, 1.3% higher than the year before.
High mortgage rates are also making monthly payments more expensive; as of September 17, the 30-year fixed mortgage rate sits at 6.95%.Although home prices have inflated all across the U.S., there are some cities that command a higher price tag than others. Location, size, age, and condition are all contributing factors to home value.
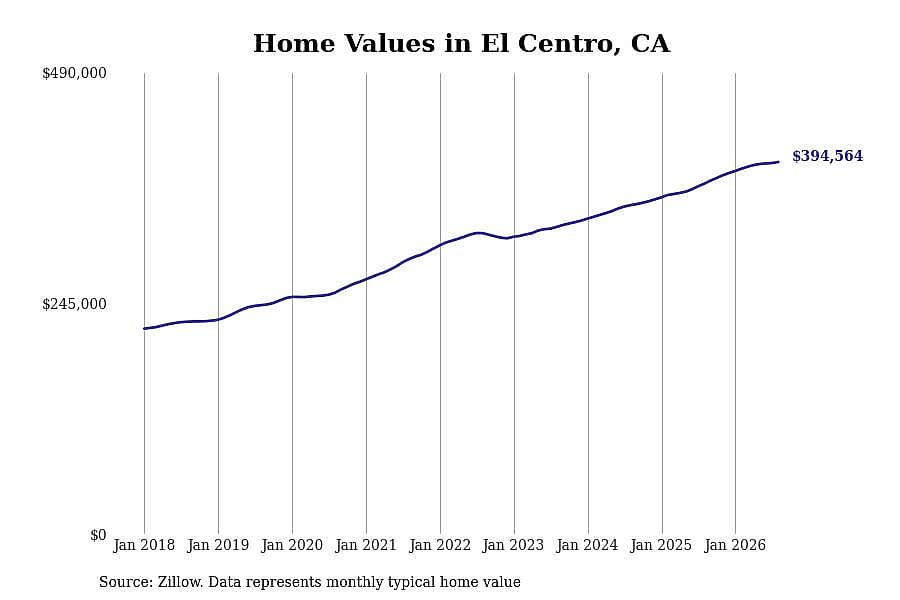
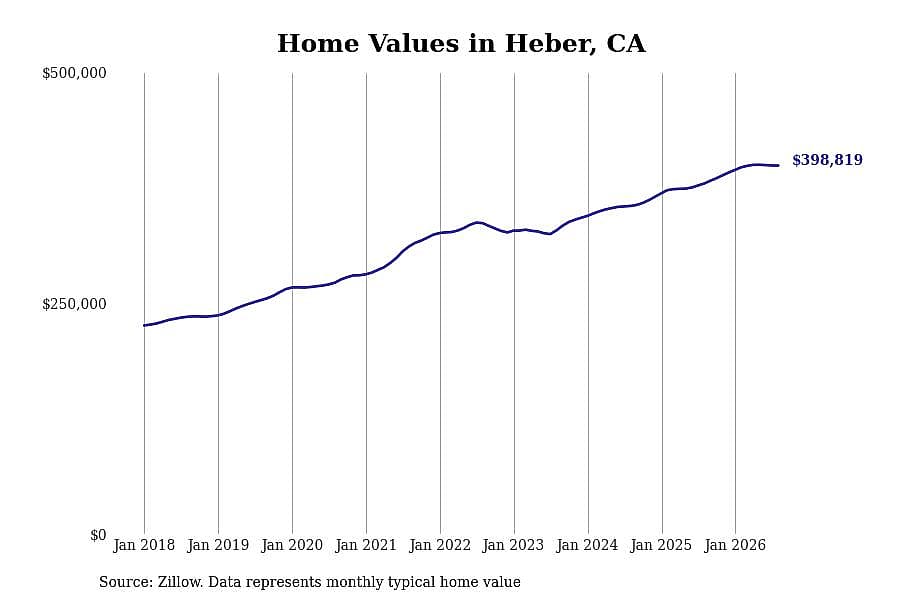
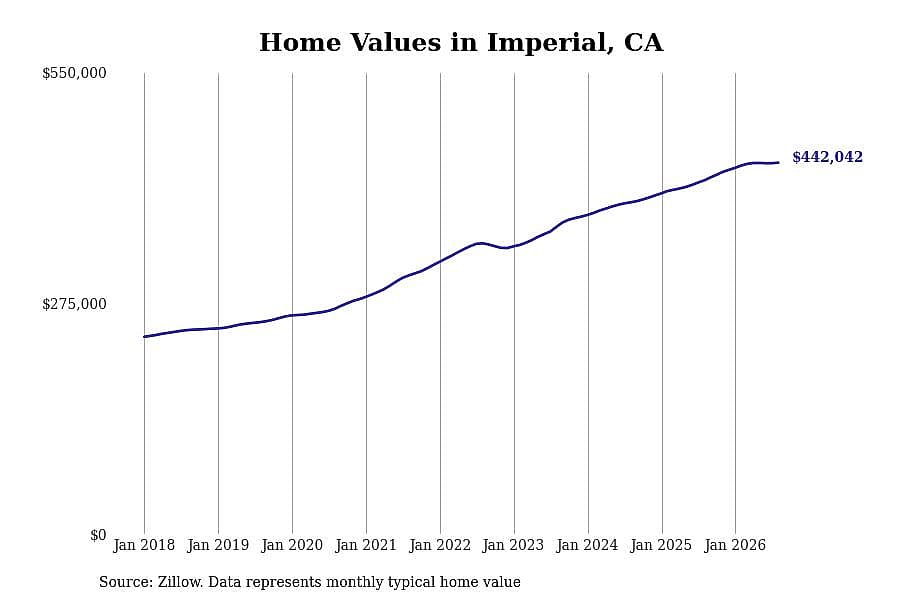
Stacker compiled a list of cities with the most expensive homes in the El Centro metro area using data from Zillow. Charts show the monthly typical home value since January 2018. All 7 cities and towns with data available were included in the list.
You may also like: How many homes are getting built in El Centro in 2026?
Stacker
1 / 7- Typical home value: $270,252
- 1-year price change: +1.8%
- 5-year price change: +18.6%
Stacker
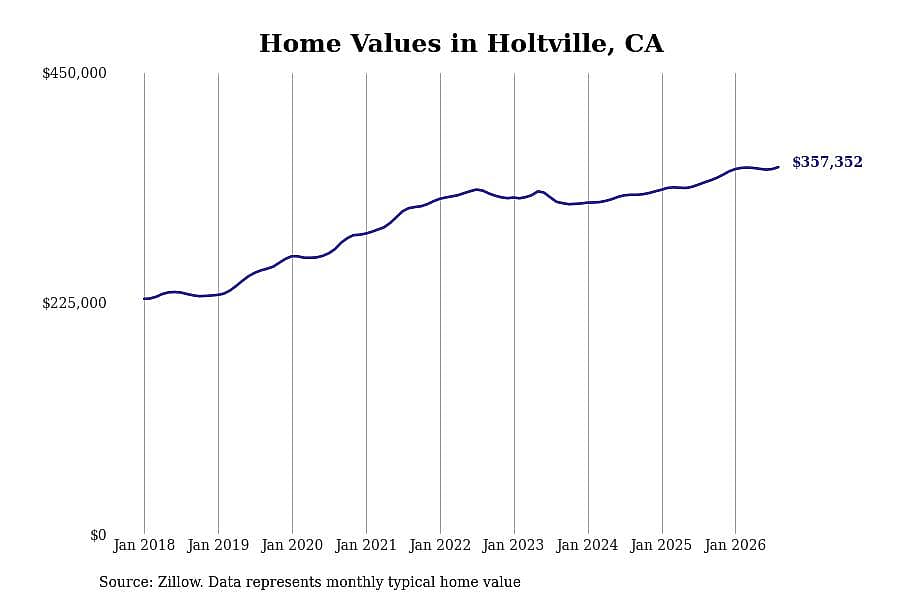
2 / 7- Typical home value: $357,352
- 1-year price change: +4.3%
- 5-year price change: +12.6%
Stacker
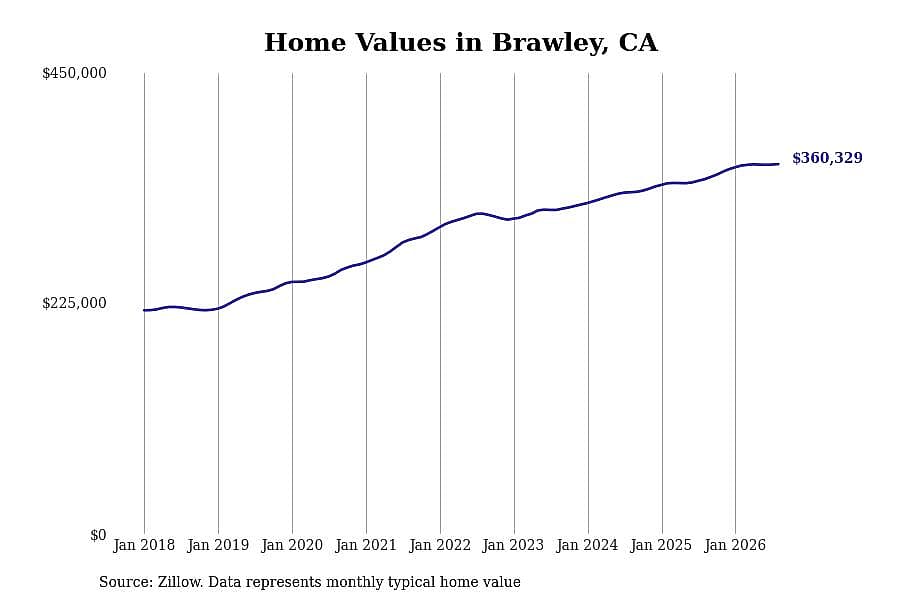
3 / 7- Typical home value: $360,329
- 1-year price change: +4.3%
- 5-year price change: +25.8%
Stacker
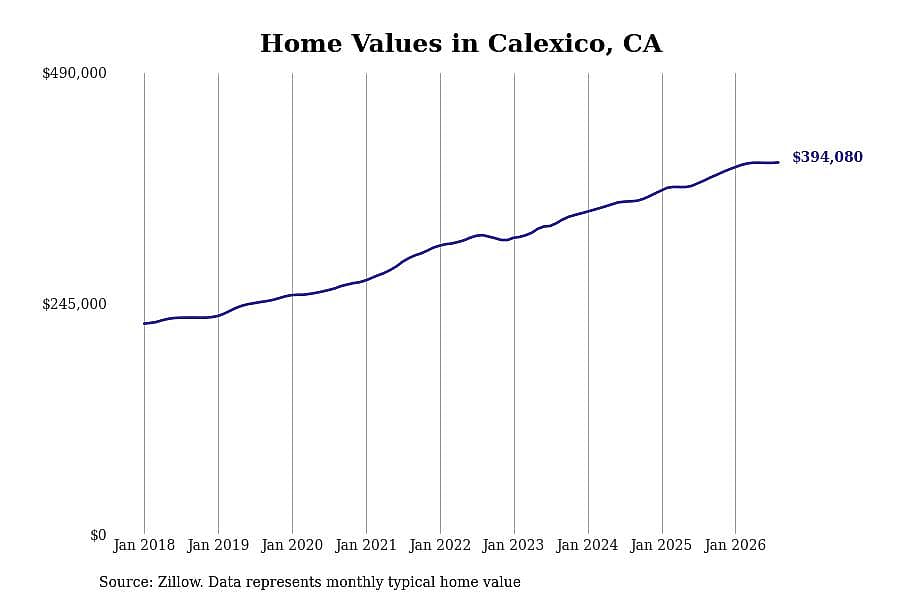
4 / 7- Typical home value: $394,080
- 1-year price change: +5.1%
- 5-year price change: +34.7%
Stacker
5 / 7- Typical home value: $394,564
- 1-year price change: +6.2%
- 5-year price change: +35.3%
You may also like: What salary do I need to afford a house in El Centro in 2026?
Stacker
6 / 7- Typical home value: $398,819
- 1-year price change: +5.1%
- 5-year price change: +28.2%
Stacker
7 / 7- Typical home value: $442,042
- 1-year price change: +5.0%
- 5-year price change: +43.6%



