Stacker
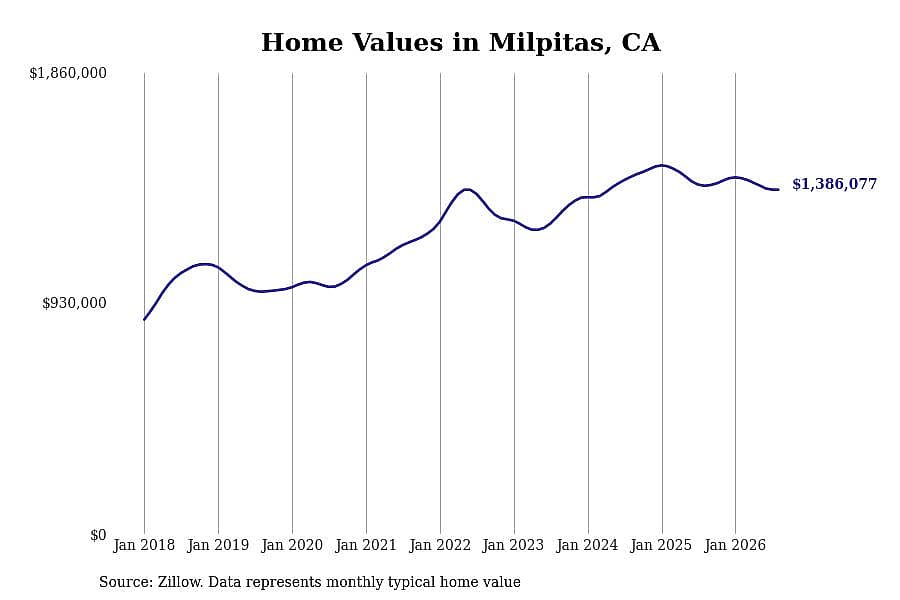
1 / 19#19. Milpitas, CA
- 1-year price change: -$15,799 (-1.1%)
- 5-year price change: +$212,288 (+18.1%)
- Typical home value: $1,386,077 (#13 most expensive city in metro)

The real estate frenzy spurred by the coronavirus pandemic continues, though at a slower pace. Buyers are still competing for a limited supply of housing, driving up prices for affordable properties.
The typical home value in the United States was $369,678 in August, 1.3% higher than the year before.
Increasing mortgage rates have slowed growth, with prices even declining in some places. But some areas are still seeing price jumps compared to the year before.
Stacker compiled a list of cities with the most expensive homes in the San Jose-Sunnyvale-Santa Clara, CA metro area using data from Zillow. Charts show the monthly typical home value since January 2018.
You may also like: What salary do I need to afford a house in San Jose in 2026?
Stacker
1 / 19- 1-year price change: -$15,799 (-1.1%)
- 5-year price change: +$212,288 (+18.1%)
- Typical home value: $1,386,077 (#13 most expensive city in metro)
Stacker
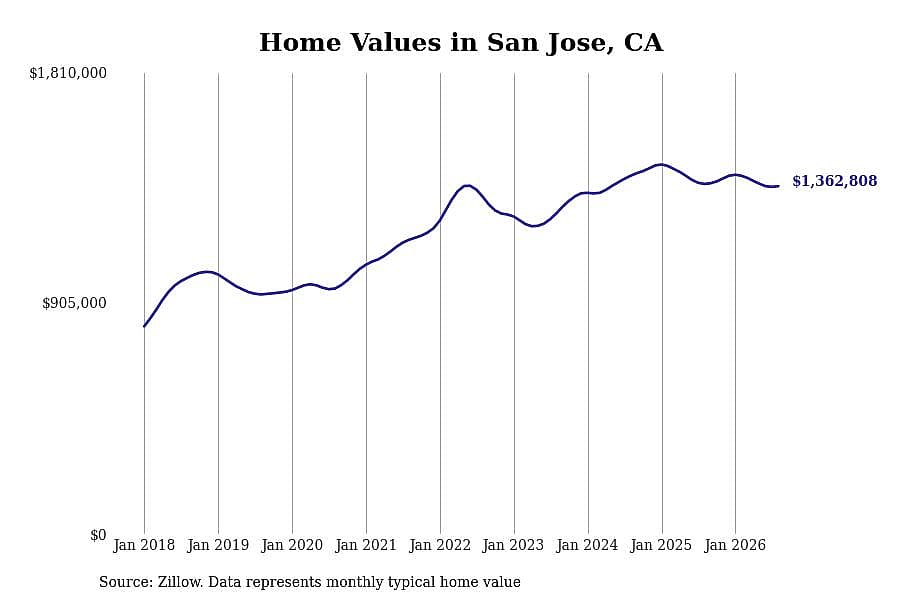
2 / 19- 1-year price change: -$8,601 (-0.6%)
- 5-year price change: +$210,384 (+18.3%)
- Typical home value: $1,362,808 (#14 most expensive city in metro)
Stacker
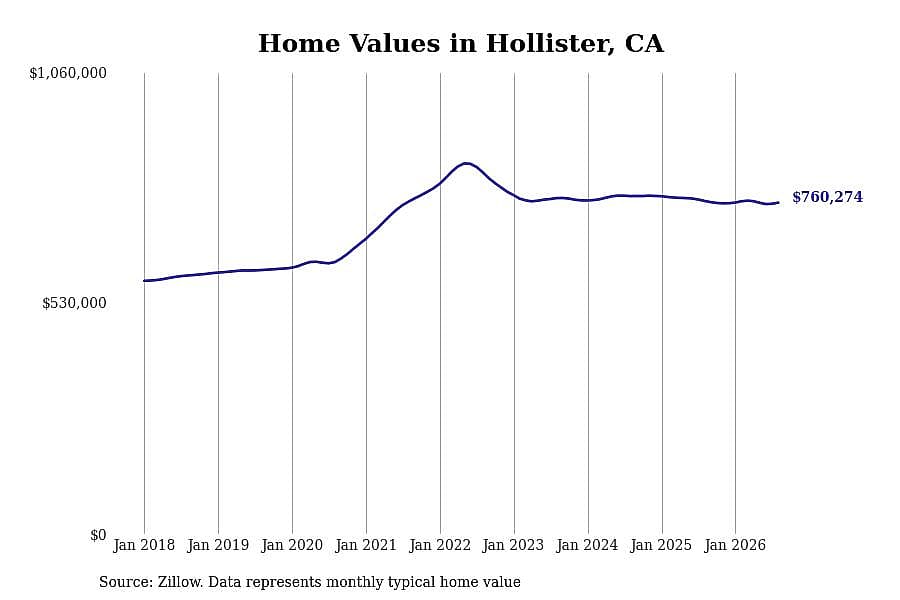
3 / 19- 1-year price change: -$3,928 (-0.5%)
- 5-year price change: $-2,590 (-0.3%)
- Typical home value: $760,274 (#19 most expensive city in metro)
Stacker
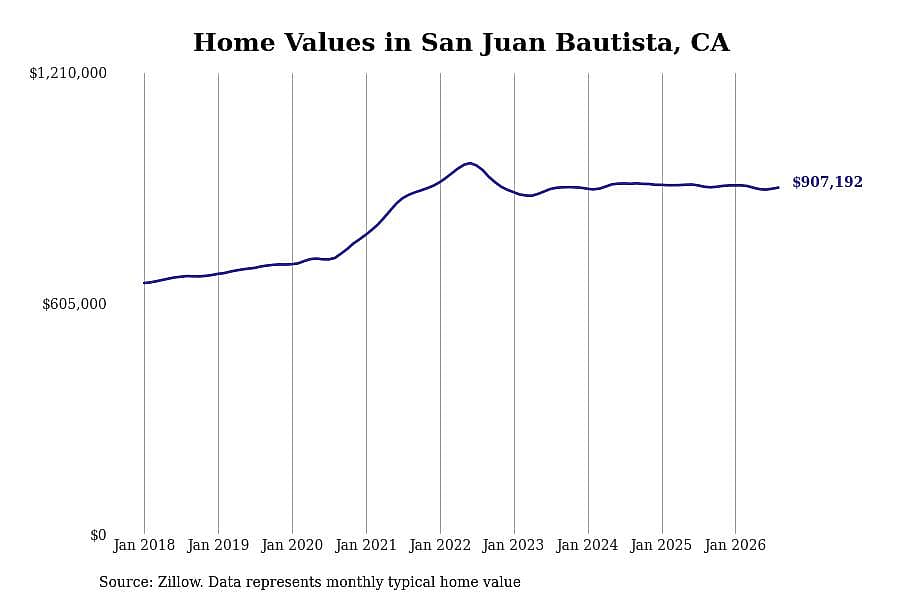
4 / 19- 1-year price change: -$2,196 (-0.2%)
- 5-year price change: +$18,675 (+2.1%)
- Typical home value: $907,192 (#18 most expensive city in metro)
Stacker
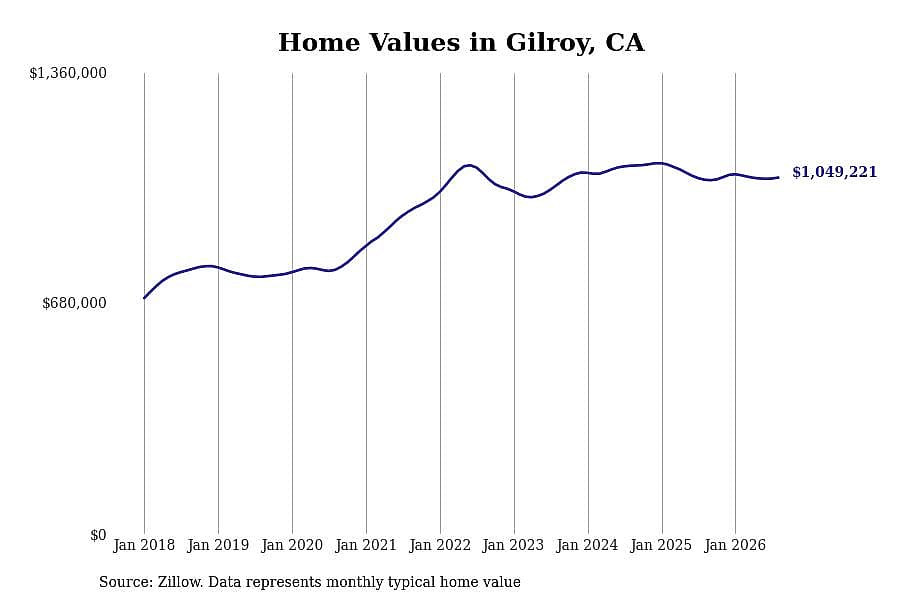
5 / 19- 1-year price change: +$6,262 (+0.6%)
- 5-year price change: +$99,234 (+10.4%)
- Typical home value: $1,049,221 (#17 most expensive city in metro)
You may also like: Top 25 songs in San Jose on Shazam in the past week
Stacker
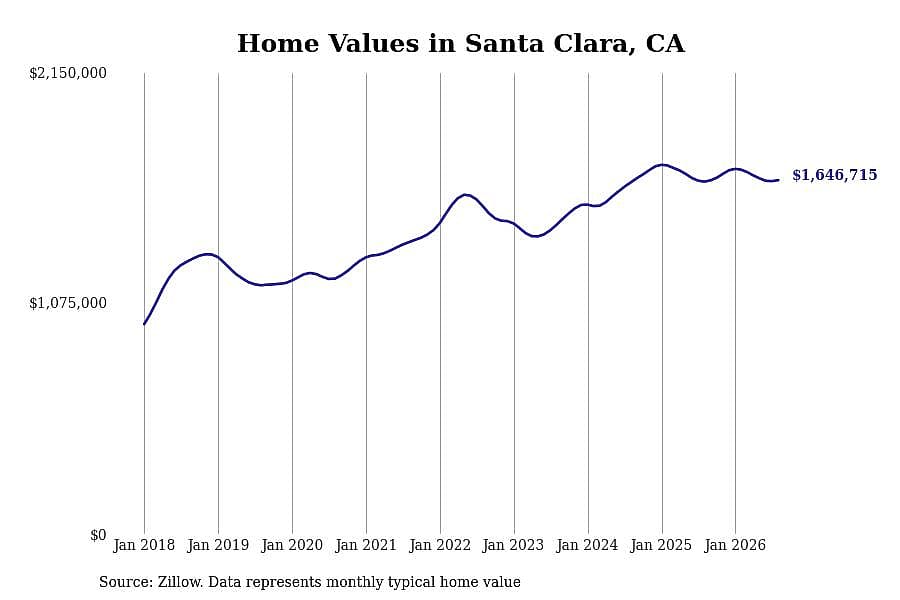
6 / 19- 1-year price change: +$6,861 (+0.4%)
- 5-year price change: +$288,810 (+21.3%)
- Typical home value: $1,646,715 (#11 most expensive city in metro)
Stacker
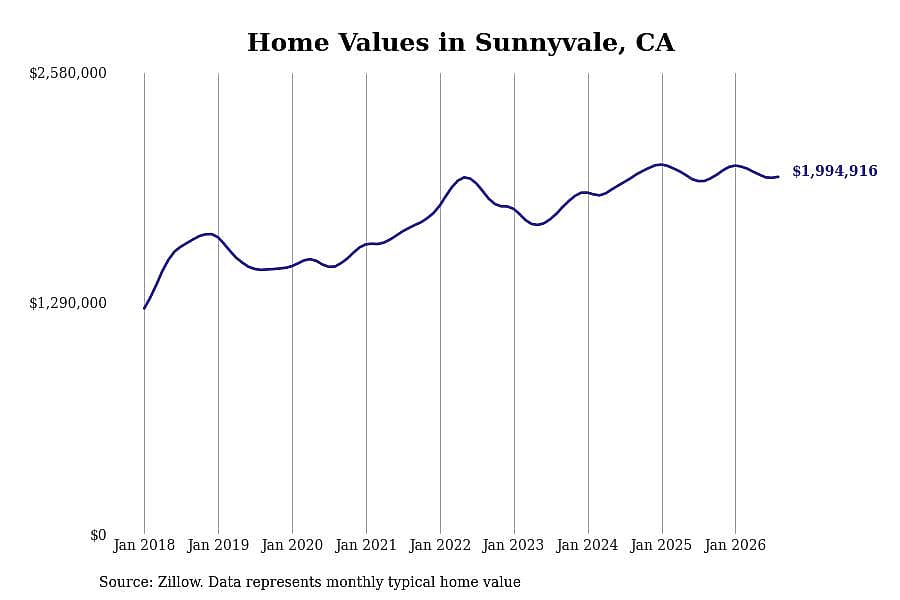
7 / 19- 1-year price change: +$23,553 (+1.2%)
- 5-year price change: +$286,119 (+16.7%)
- Typical home value: $1,994,916 (#8 most expensive city in metro)
Stacker
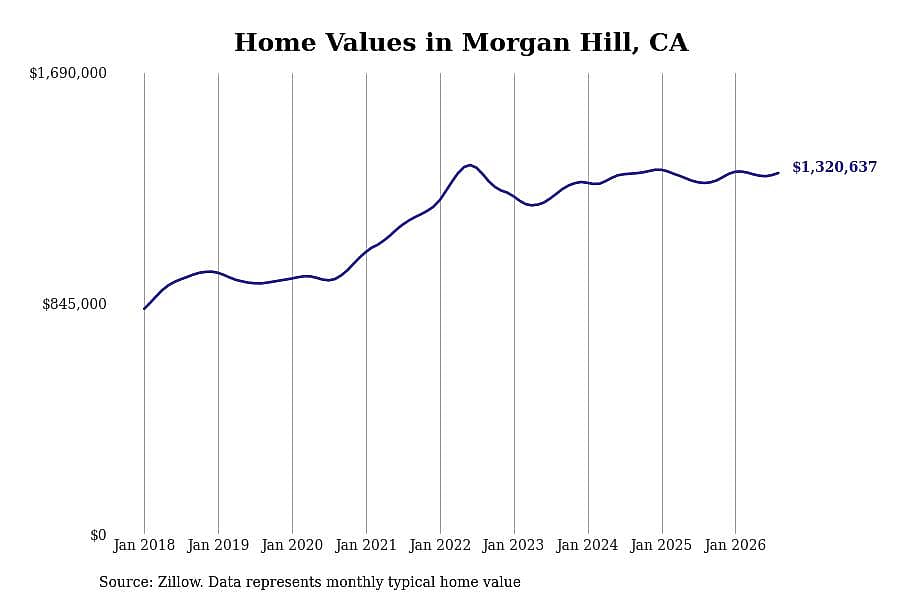
8 / 19- 1-year price change: +$36,647 (+2.9%)
- 5-year price change: +$173,861 (+15.2%)
- Typical home value: $1,320,637 (#15 most expensive city in metro)
Stacker
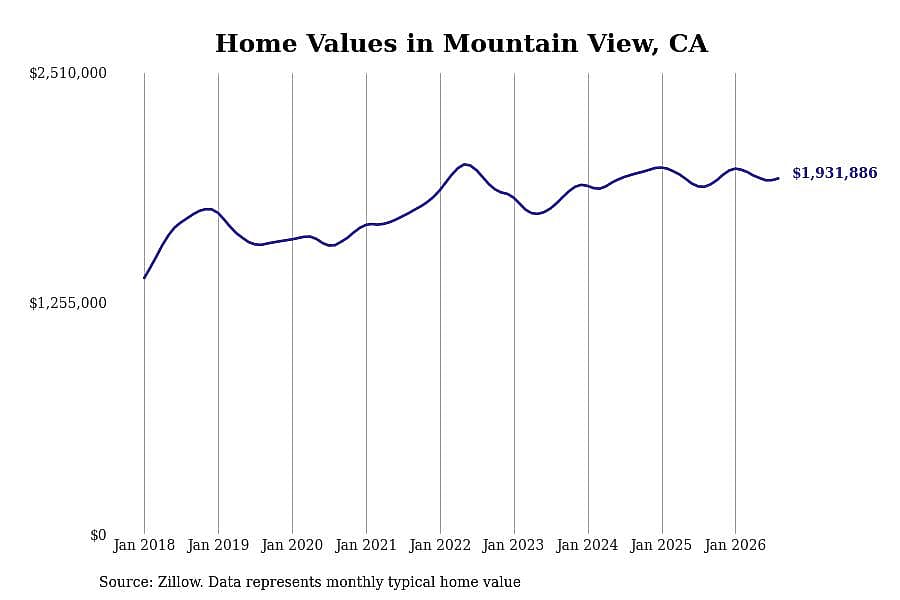
9 / 19- 1-year price change: +$45,576 (+2.4%)
- 5-year price change: +$188,379 (+10.8%)
- Typical home value: $1,931,886 (#9 most expensive city in metro)
Stacker
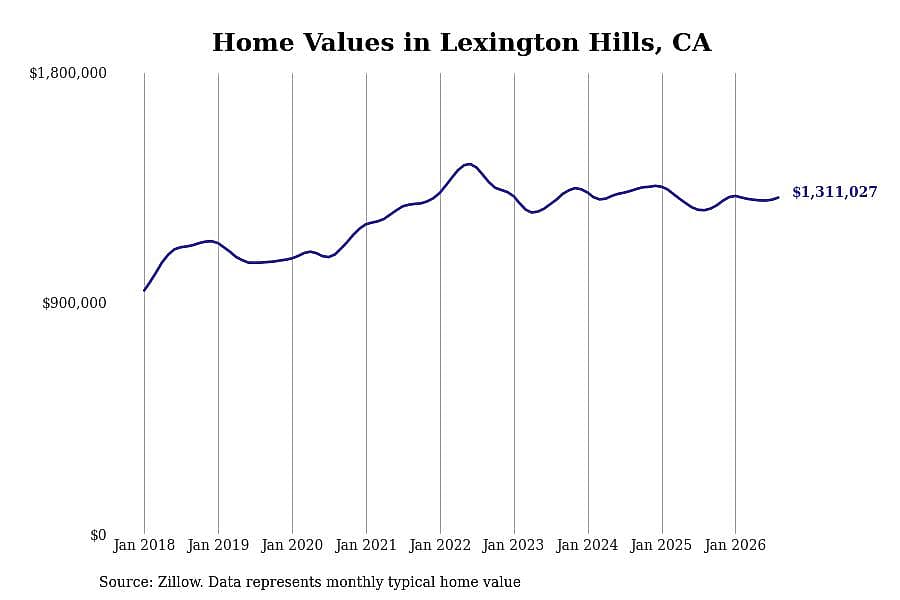
10 / 19- 1-year price change: +$49,532 (+3.9%)
- 5-year price change: +$28,082 (+2.2%)
- Typical home value: $1,311,027 (#16 most expensive city in metro)
You may also like: Are home prices going down in San Jose in 2026?
Stacker
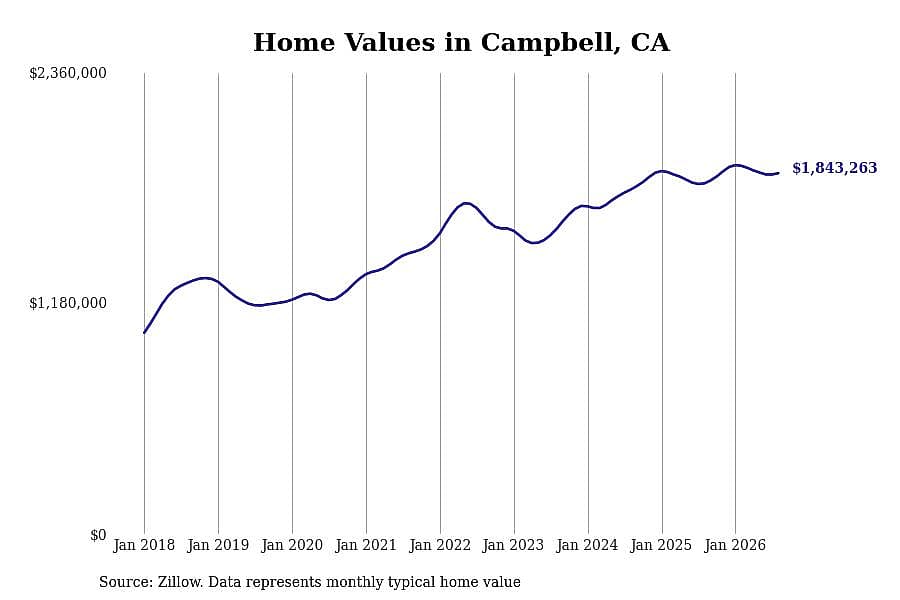
11 / 19- 1-year price change: +$52,104 (+2.9%)
- 5-year price change: +$409,032 (+28.5%)
- Typical home value: $1,843,263 (#10 most expensive city in metro)
Stacker
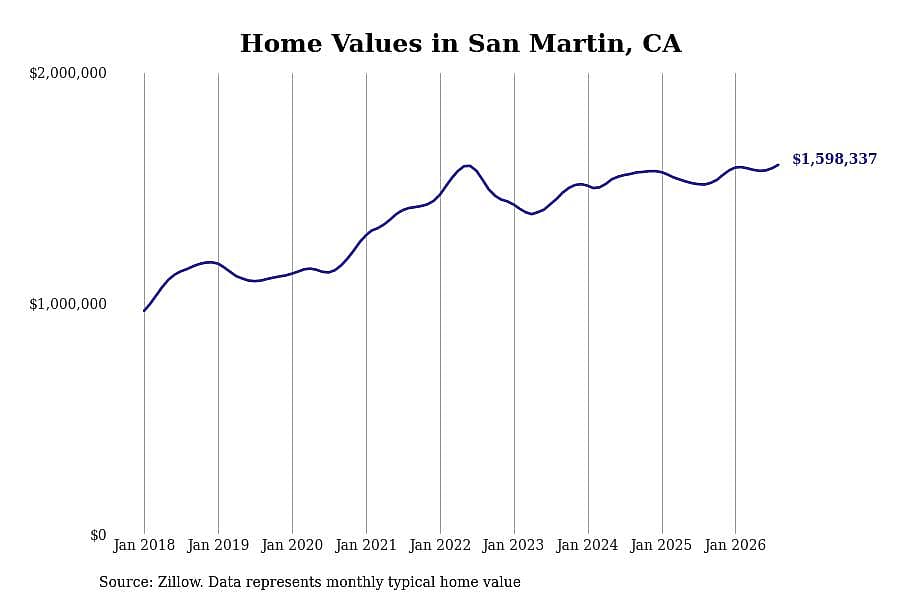
12 / 19- 1-year price change: +$85,493 (+5.7%)
- 5-year price change: +$187,250 (+13.3%)
- Typical home value: $1,598,337 (#12 most expensive city in metro)
Stacker
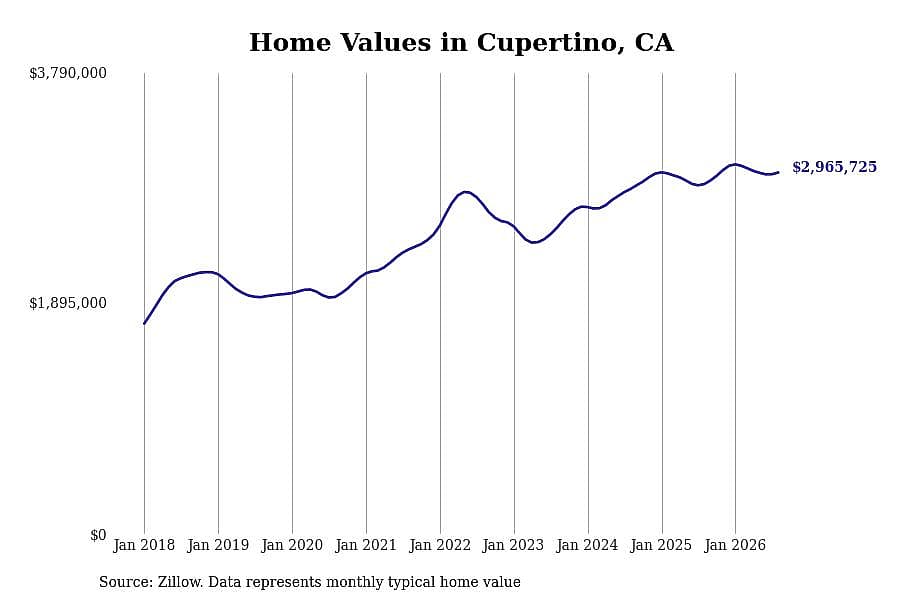
13 / 19- 1-year price change: +$94,846 (+3.3%)
- 5-year price change: +$630,711 (+27.0%)
- Typical home value: $2,965,725 (#6 most expensive city in metro)
Stacker
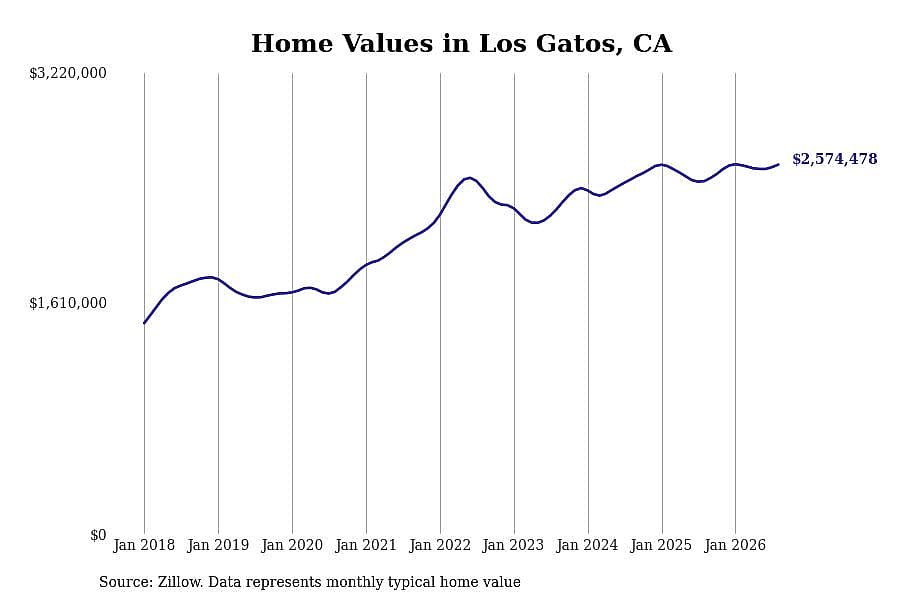
14 / 19- 1-year price change: +$114,841 (+4.7%)
- 5-year price change: +$518,929 (+25.2%)
- Typical home value: $2,574,478 (#7 most expensive city in metro)
Stacker
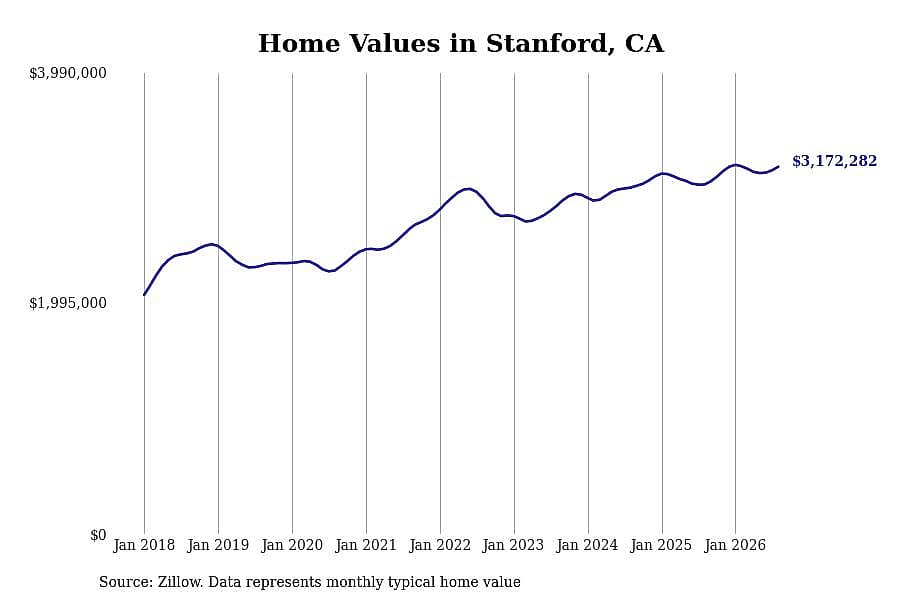
15 / 19- 1-year price change: +$154,064 (+5.1%)
- 5-year price change: +$542,043 (+20.6%)
- Typical home value: $3,172,282 (#5 most expensive city in metro)
You may also like: San Jose's 2025 housing market year in review
Stacker
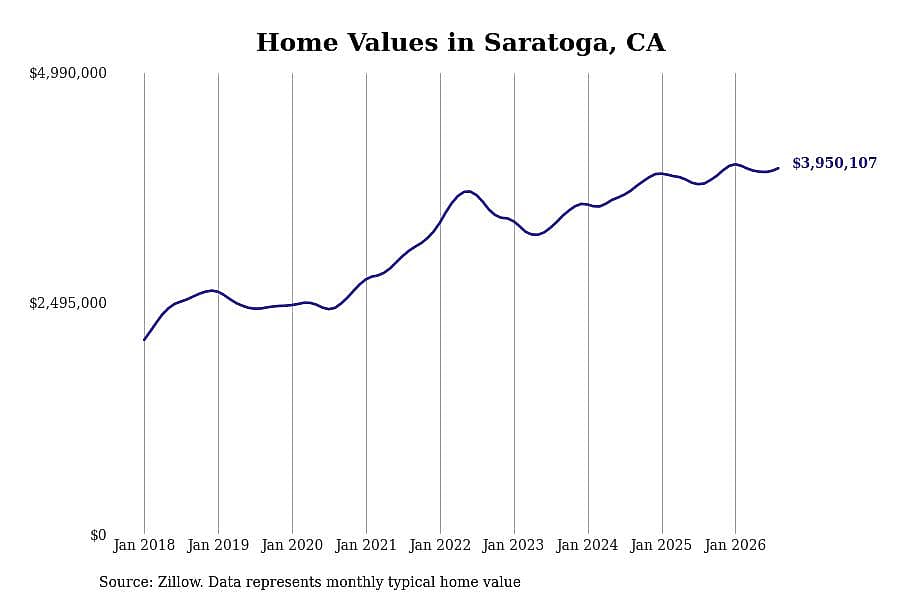
16 / 19- 1-year price change: +$163,615 (+4.3%)
- 5-year price change: +$891,731 (+29.2%)
- Typical home value: $3,950,107 (#3 most expensive city in metro)
Stacker
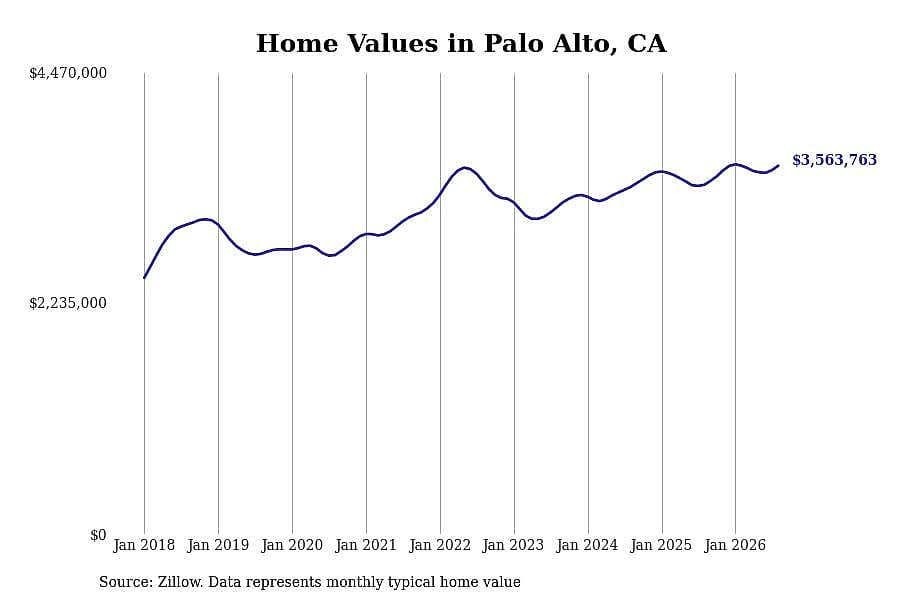
17 / 19- 1-year price change: +$184,736 (+5.5%)
- 5-year price change: +$501,446 (+16.4%)
- Typical home value: $3,563,763 (#4 most expensive city in metro)
Stacker
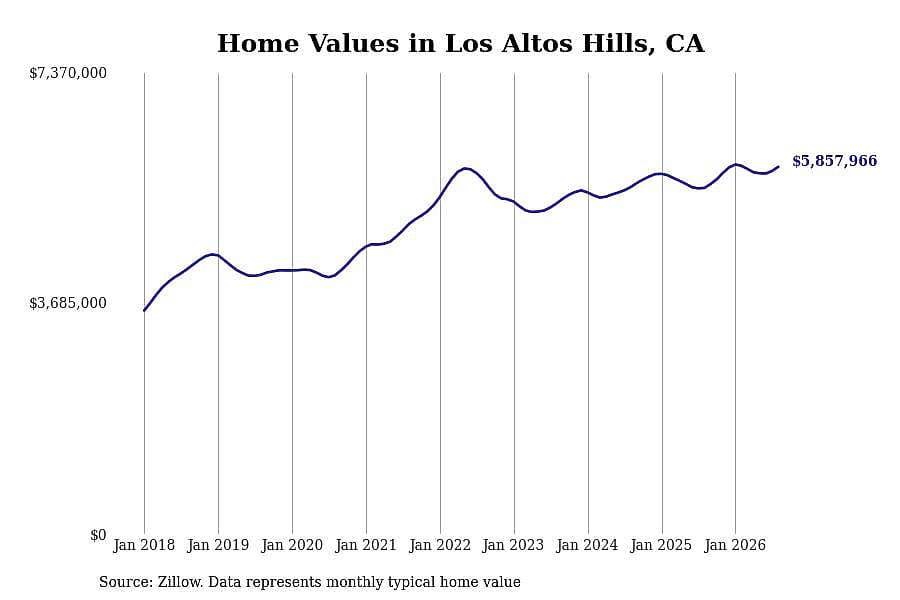
18 / 19- 1-year price change: +$337,259 (+6.1%)
- 5-year price change: +$914,561 (+18.5%)
- Typical home value: $5,857,966 (#1 most expensive city in metro)
Stacker
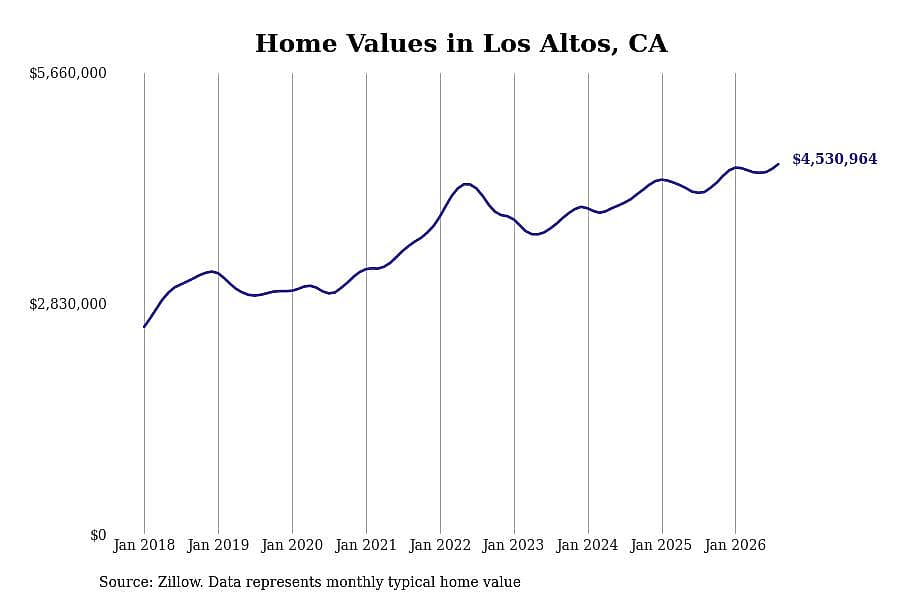
19 / 19- 1-year price change: +$341,360 (+8.1%)
- 5-year price change: +$999,477 (+28.3%)
- Typical home value: $4,530,964 (#2 most expensive city in metro)



