Rain, sleet, snow, hail, wintry mix. Precipitation takes on many forms, and the degree to which climate change affects precipitation levels comes down to something almost everyone learns about in school—Earth's water cycle. A system in endless motion, the water cycle traces the process through which water exists in its three primary phases—liquid, solid, and gas—as it moves perpetually between the Earth and its atmosphere.
Increases in precipitation frequency and intensity are markers of climate change. When temperatures rise and oceans grow warmer, the amount of water that evaporates into the atmosphere—and the speed at which it does so—also increases. As atmospheric circulation carries the moisture-rich air over land or pushes it into a storm system, heavy rain or snow is often the result.
The continental U.S. on average received about 30 inches of precipitation between March 2022 and February 2023. Traditionally "wet" regions—such as Washington state and Alaska in the northwest and Georgia and Mississippi in the southeast—continue to have some of the rainiest counties in the United States. Other areas such as Oklahoma, Kansas, and Nebraska, as well as pockets of the South and of California, experience the opposite extreme: drought, also largely a product of climate change.
Stacker cited data from the National Centers for Environmental Information to identify the counties in California that receive the most precipitation through rain, sleet, or snow. Counties are ranked by five-year precipitation averages in inches as of February 2023 with rainfall over the past year serving as a tiebreaker. Supplementary data on how last year's precipitation compares to the 100-year average for the area is also included.
You may also like: Hottest Novembers in California since 1895
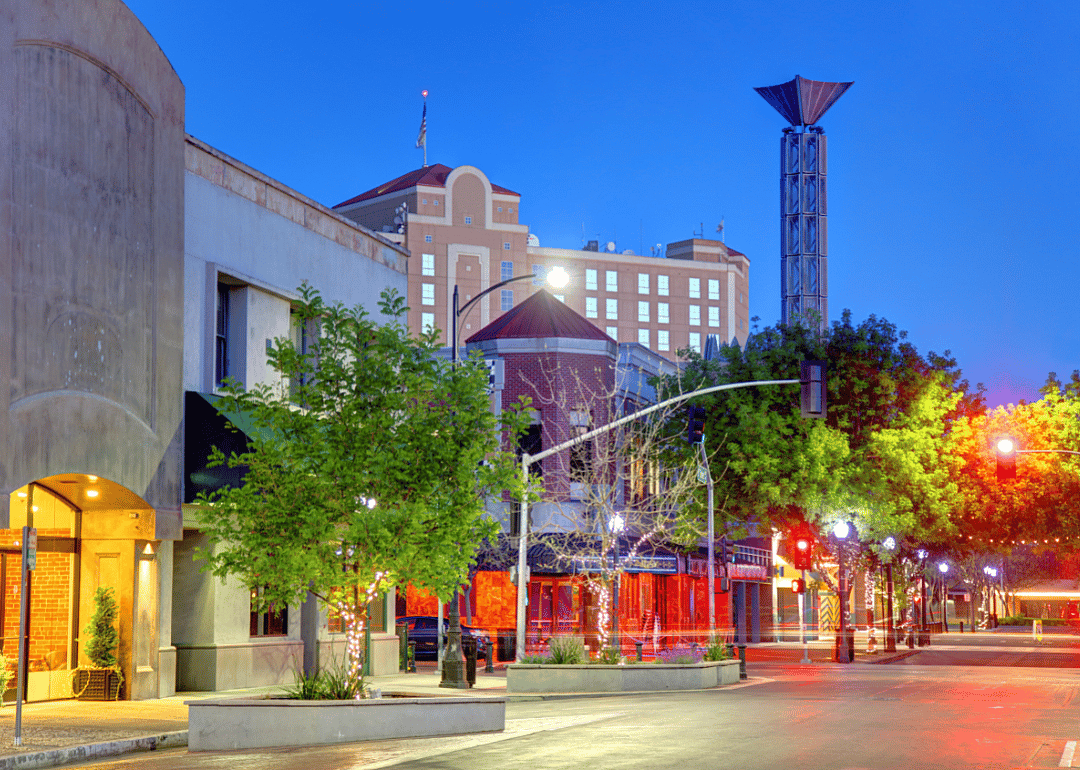
#50. Stanislaus County
- Five-year precipitation average: 13.62 inches
- Precipitation over the past year: 19.04 inches (#118 rainiest year since 1895)
- Precipitation compared to 1901-2000 average: 5.35 inches above norm
#49. San Joaquin County
- Five-year precipitation average: 13.66 inches
- Precipitation over the past year: 19.22 inches (#117 rainiest year since 1895)
- Precipitation compared to 1901-2000 average: 5.12 inches above norm
#48. San Diego County
- Five-year precipitation average: 13.73 inches
- Precipitation over the past year: 17.06 inches (#98 rainiest year since 1895)
- Precipitation compared to 1901-2000 average: 2.74 inches above norm
#47. Los Angeles County
- Five-year precipitation average: 15.20 inches
- Precipitation over the past year: 21.32 inches (#106 rainiest year since 1895)
- Precipitation compared to 1901-2000 average: 5.72 inches above norm
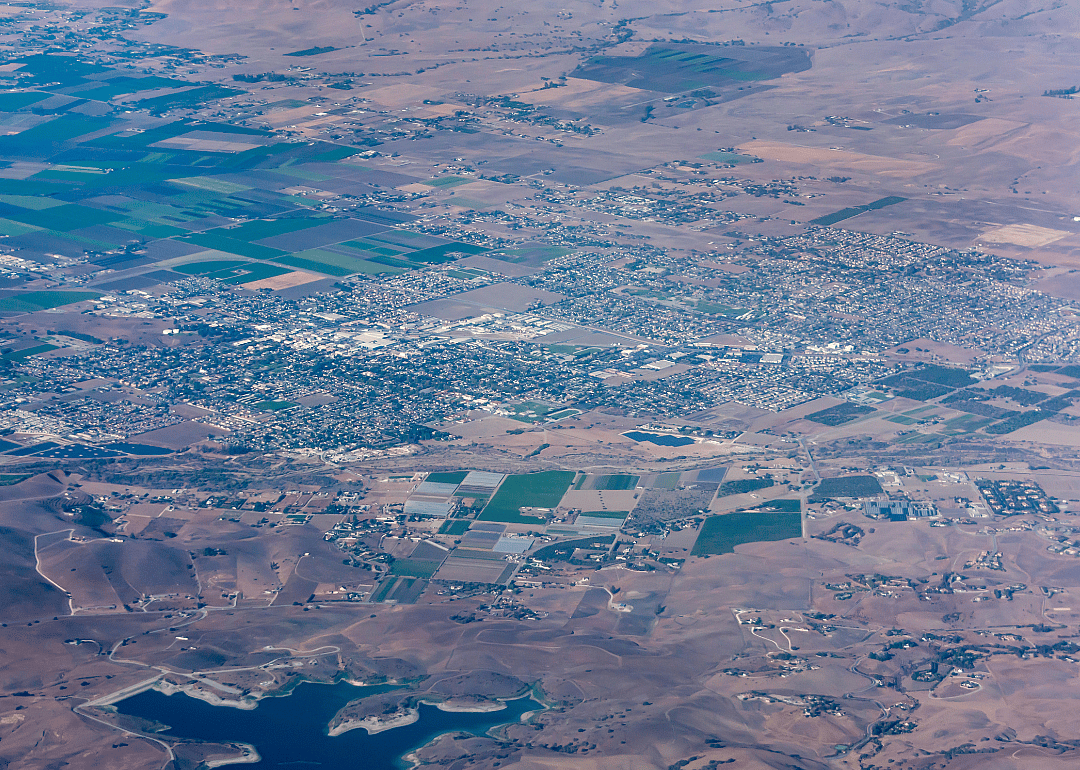
#45. San Benito County
- Five-year precipitation average: 16.23 inches
- Precipitation over the past year: 21.18 inches (#100 rainiest year since 1895)
- Precipitation compared to 1901-2000 average: 4.37 inches above norm
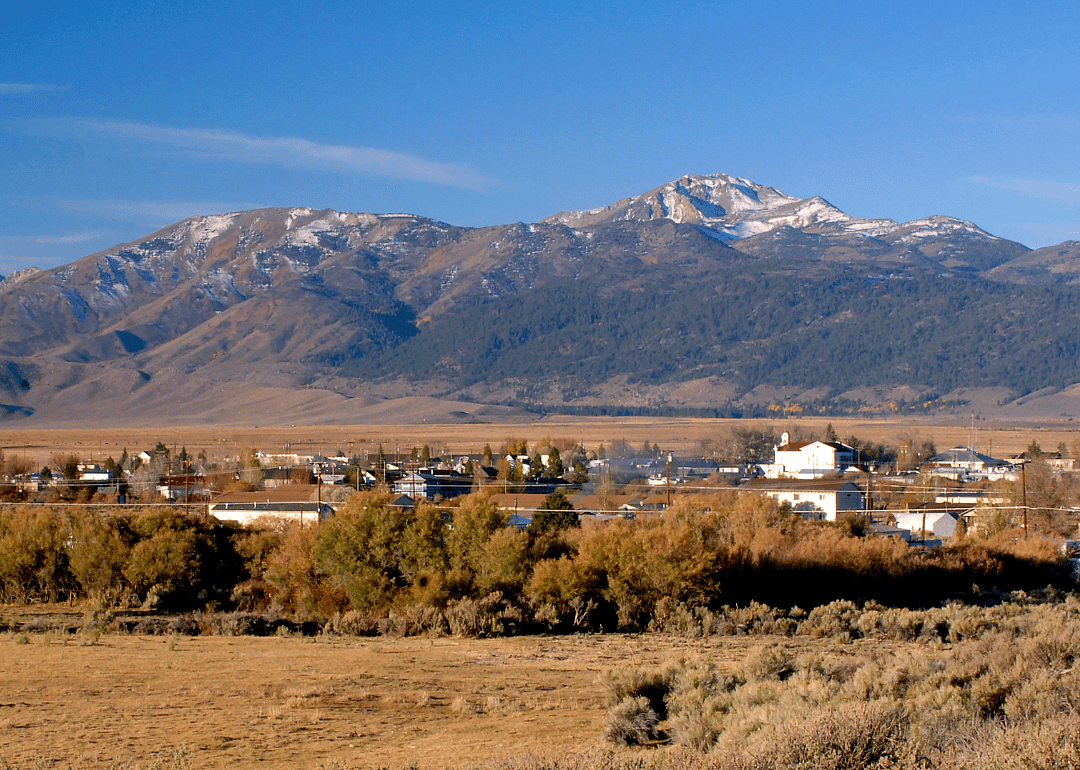
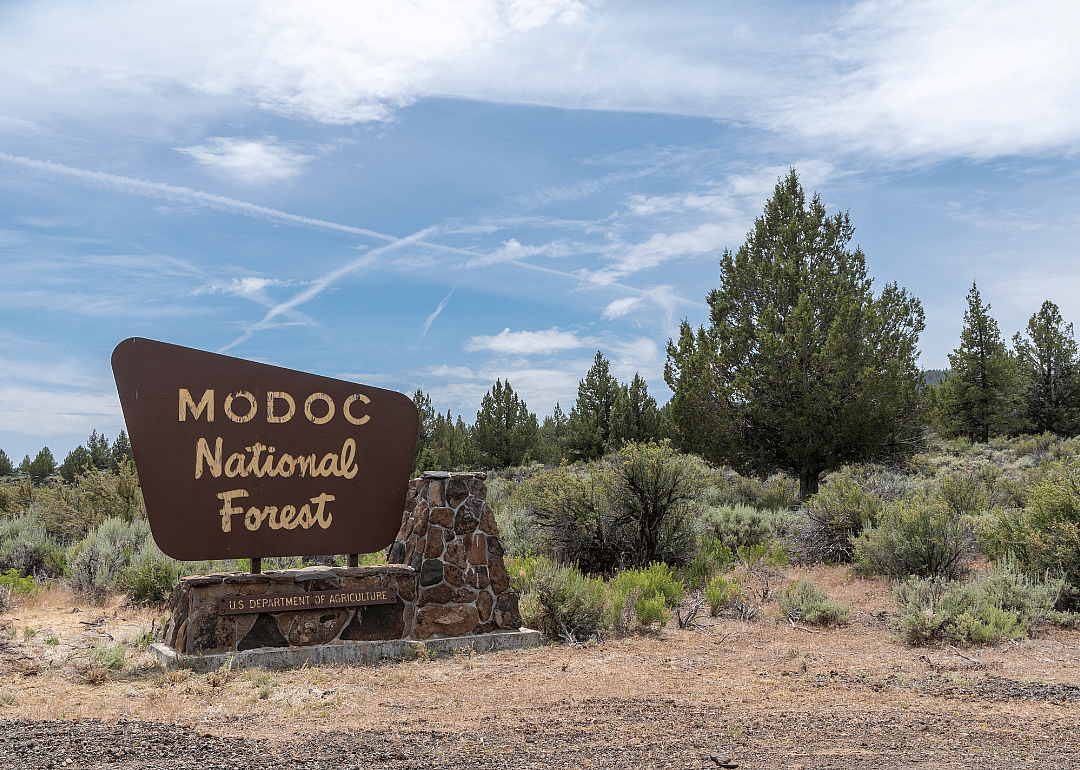
#44. Modoc County
- Five-year precipitation average: 16.29 inches
- Precipitation over the past year: 17.62 inches (#67 rainiest year since 1895)
- Precipitation compared to 1901-2000 average: -0.50 inches below norm
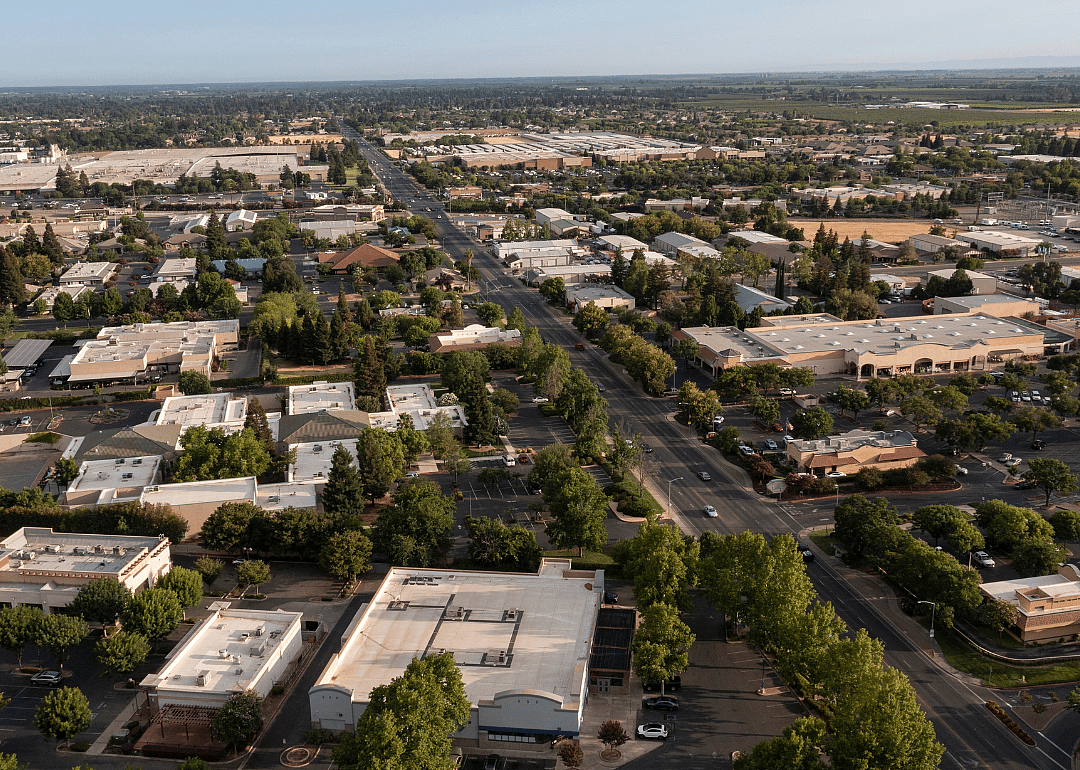
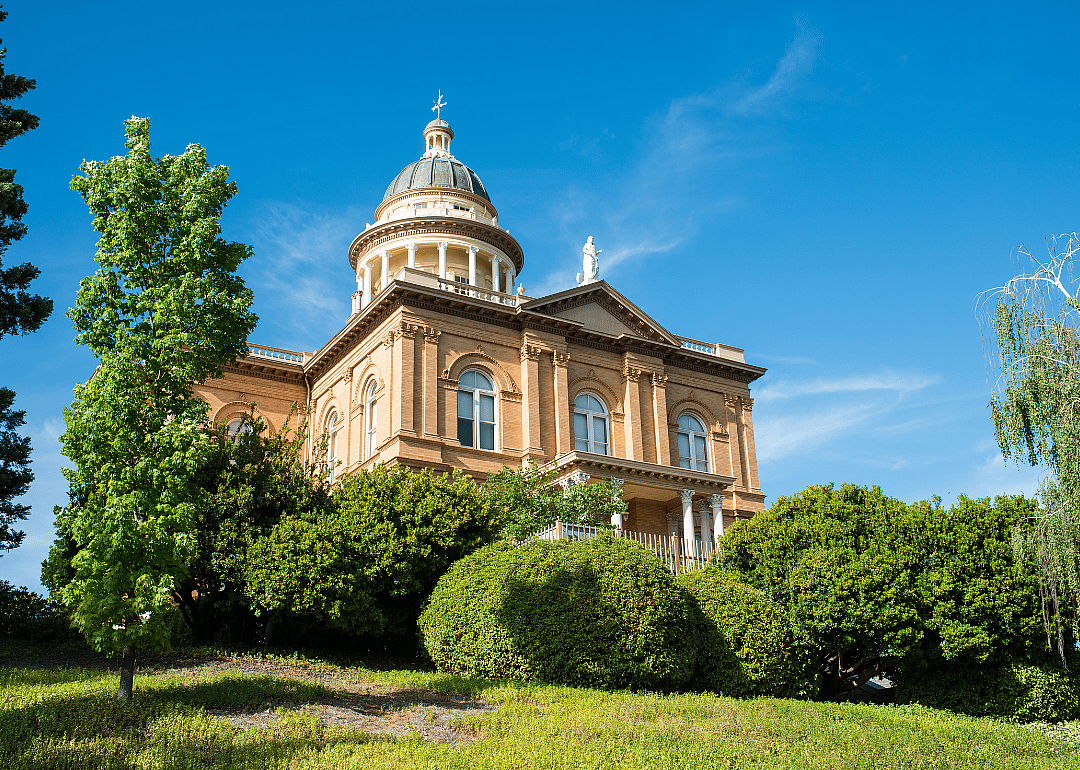
Matt Gush // Shutterstock
8 / 50#43. Sutter County
- Five-year precipitation average: 16.81 inches
- Precipitation over the past year: 20.29 inches (#81 rainiest year since 1895)
- Precipitation compared to 1901-2000 average: 1.27 inches above norm
#42. Contra Costa County
- Five-year precipitation average: 17.20 inches
- Precipitation over the past year: 25.37 inches (#114 rainiest year since 1895)
- Precipitation compared to 1901-2000 average: 6.83 inches above norm
#40. San Luis Obispo County
- Five-year precipitation average: 17.41 inches
- Precipitation over the past year: 25.42 inches (#119 rainiest year since 1895)
- Precipitation compared to 1901-2000 average: 8.20 inches above norm
#39. Sacramento County
- Five-year precipitation average: 17.60 inches
- Precipitation over the past year: 22.43 inches (#95 rainiest year since 1895)
- Precipitation compared to 1901-2000 average: 3.69 inches above norm
#38. Lassen County
- Five-year precipitation average: 17.94 inches
- Precipitation over the past year: 18.81 inches (#56 rainiest year since 1895)
- Precipitation compared to 1901-2000 average: -1.66 inches below norm
#37. Solano County
- Five-year precipitation average: 18.32 inches
- Precipitation over the past year: 24.36 inches (#101 rainiest year since 1895)
- Precipitation compared to 1901-2000 average: 4.52 inches above norm
#36. Santa Barbara County
- Five-year precipitation average: 18.61 inches
- Precipitation over the past year: 28.39 inches (#118 rainiest year since 1895)
- Precipitation compared to 1901-2000 average: 9.53 inches above norm
You may also like: Hottest Septembers in California since 1895
#35. Fresno County
- Five-year precipitation average: 18.92 inches
- Precipitation over the past year: 28.53 inches (#121 rainiest year since 1895)
- Precipitation compared to 1901-2000 average: 8.86 inches above norm
#34. Yolo County
- Five-year precipitation average: 19.12 inches
- Precipitation over the past year: 23.79 inches (#96 rainiest year since 1895)
- Precipitation compared to 1901-2000 average: 3.73 inches above norm
#33. Colusa County
- Five-year precipitation average: 19.32 inches
- Precipitation over the past year: 24.09 inches (#80 rainiest year since 1895)
- Precipitation compared to 1901-2000 average: 2.05 inches above norm
#32. Ventura County
- Five-year precipitation average: 20.24 inches
- Precipitation over the past year: 29.60 inches (#114 rainiest year since 1895)
- Precipitation compared to 1901-2000 average: 9.16 inches above norm
#30. Tulare County
- Five-year precipitation average: 20.53 inches
- Precipitation over the past year: 28.80 inches (#112 rainiest year since 1895)
- Precipitation compared to 1901-2000 average: 6.87 inches above norm
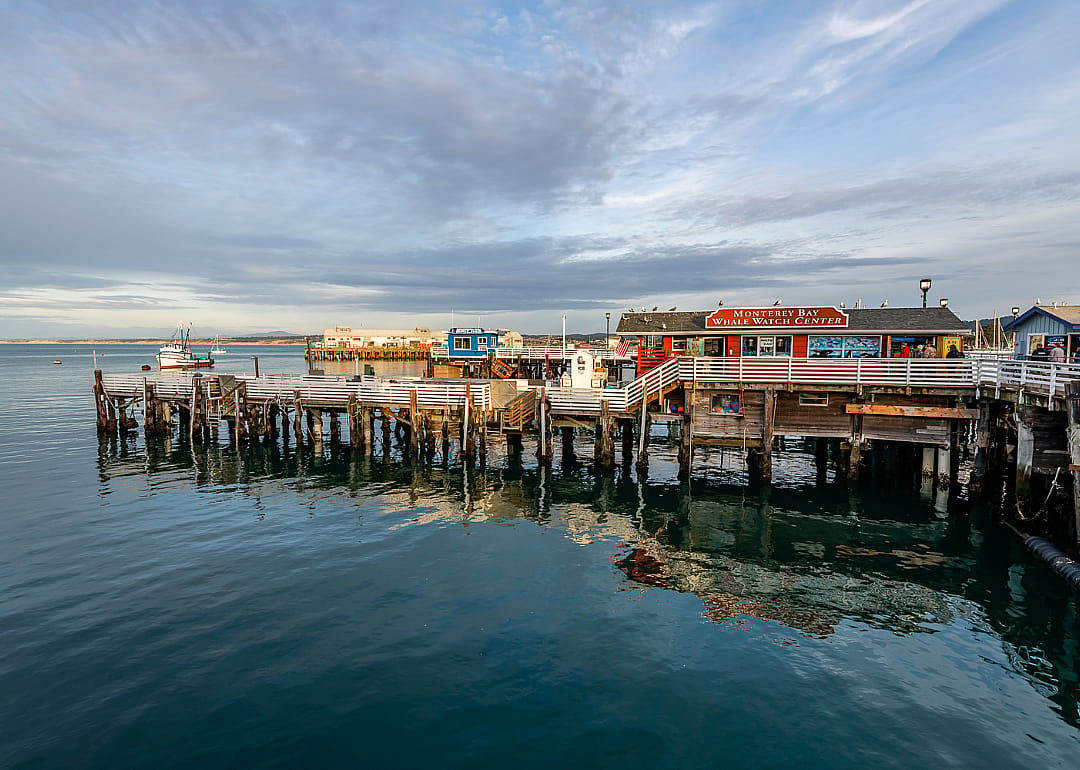
#29. Monterey County
- Five-year precipitation average: 20.72 inches
- Precipitation over the past year: 26.92 inches (#108 rainiest year since 1895)
- Precipitation compared to 1901-2000 average: 6.75 inches above norm
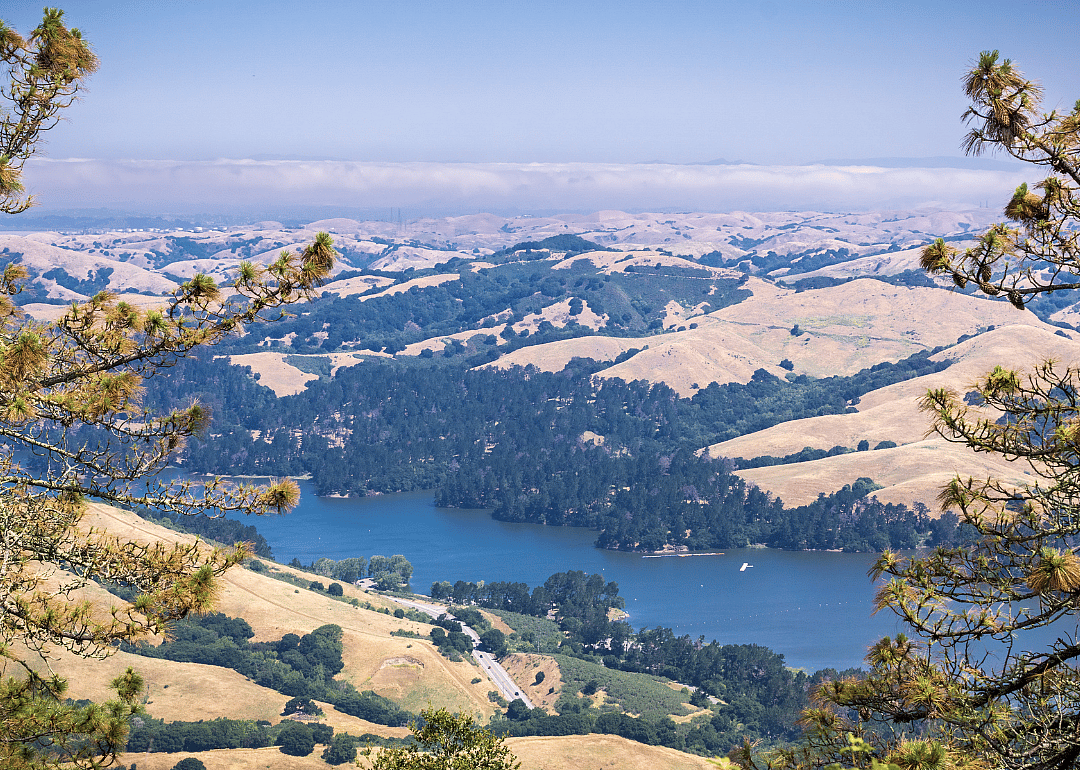
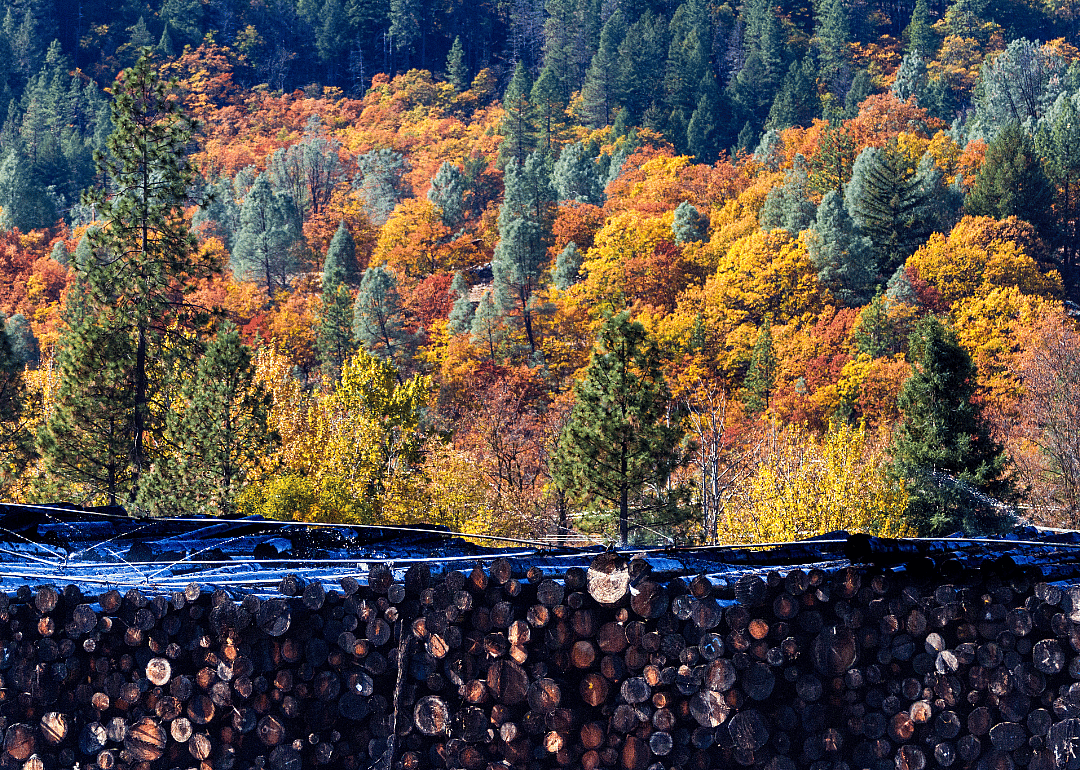
CL Shebley // Shutterstock
23 / 50#28. Glenn County
- Five-year precipitation average: 21.65 inches
- Precipitation over the past year: 26.65 inches (#73 rainiest year since 1895)
- Precipitation compared to 1901-2000 average: 0.72 inches above norm
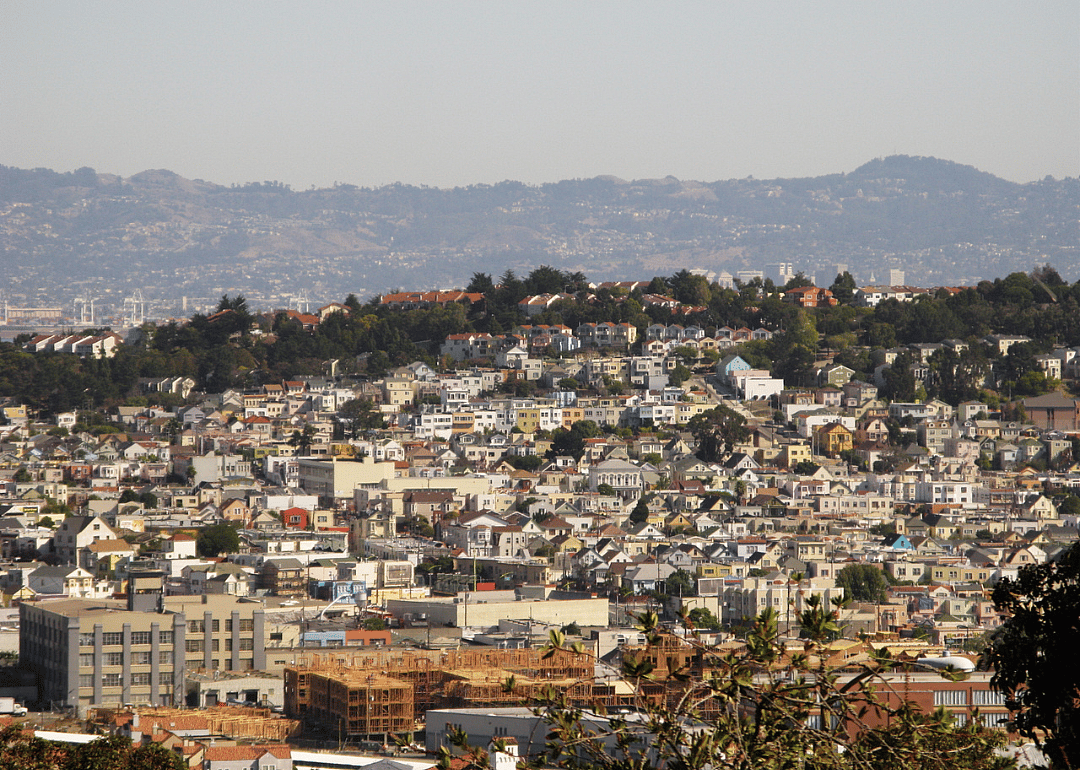
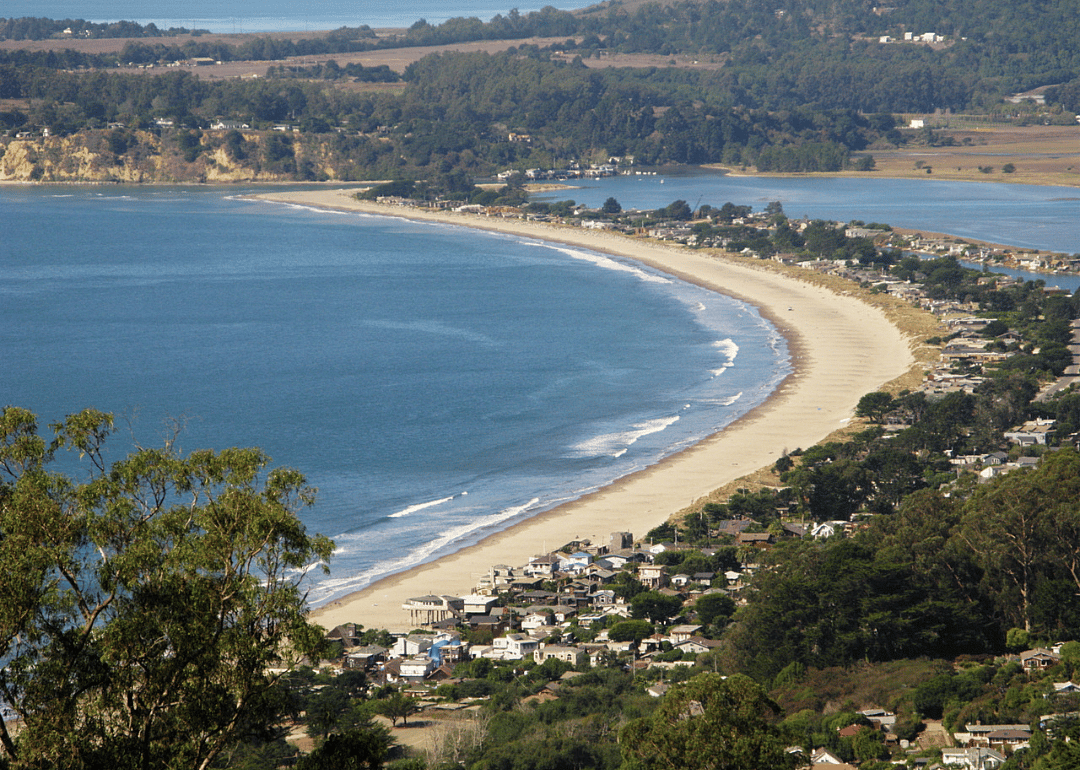
#27. San Francisco County
- Five-year precipitation average: 22.45 inches
- Precipitation over the past year: 31.44 inches (#108 rainiest year since 1895)
- Precipitation compared to 1901-2000 average: 7.08 inches above norm
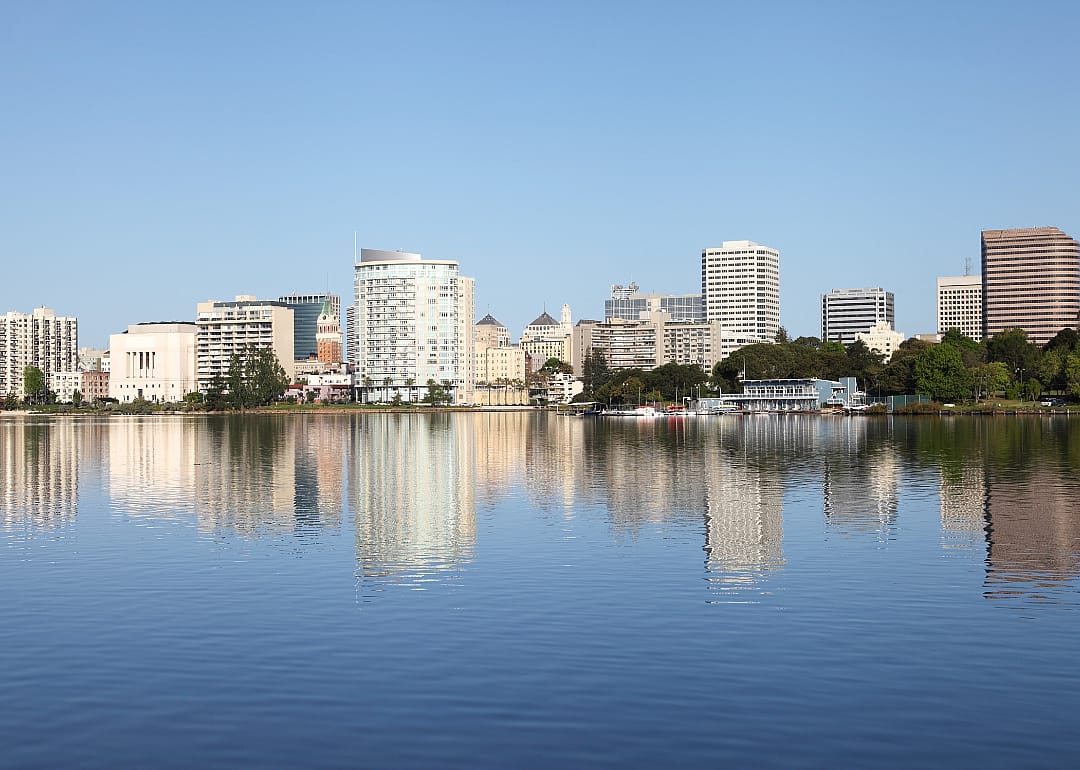
Uladzik Kryhin // Shutterstock
25 / 50#26. Santa Clara County
- Five-year precipitation average: 23.33 inches
- Precipitation over the past year: 33.02 inches (#115 rainiest year since 1895)
- Precipitation compared to 1901-2000 average: 9.82 inches above norm
You may also like: Counties with the highest unemployment in California
#25. San Mateo County
- Five-year precipitation average: 24.93 inches
- Precipitation over the past year: 36.63 inches (#108 rainiest year since 1895)
- Precipitation compared to 1901-2000 average: 7.88 inches above norm
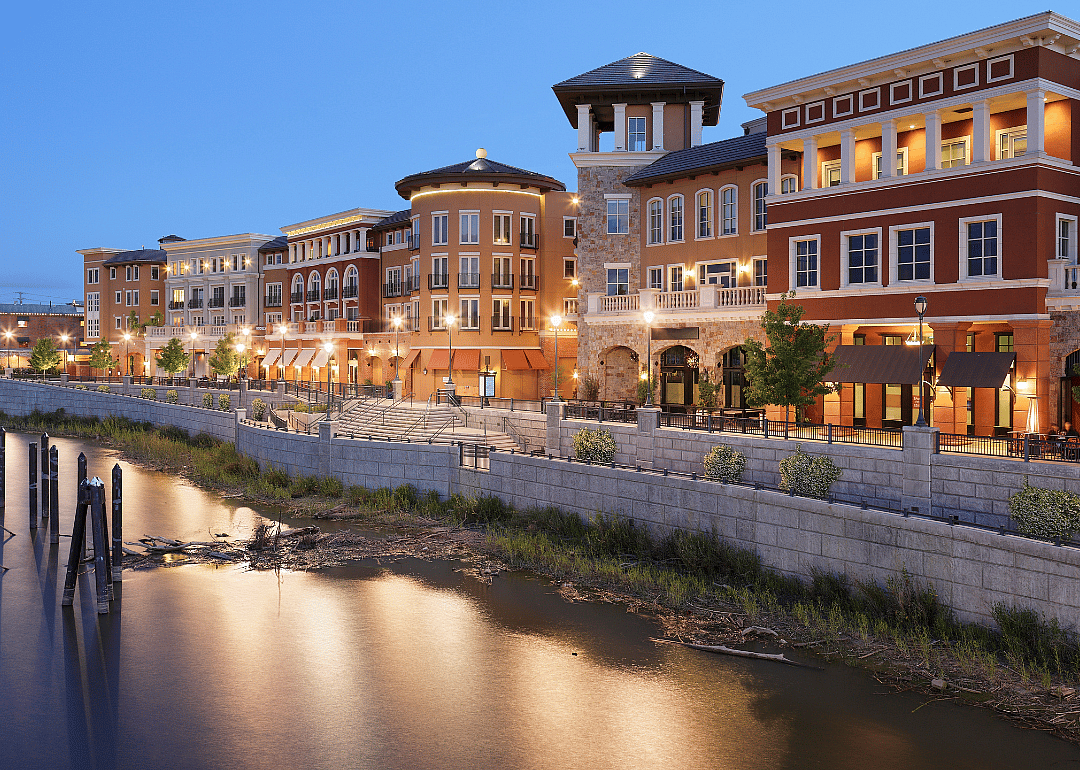
#24. Napa County
- Five-year precipitation average: 26.93 inches
- Precipitation over the past year: 34.04 inches (#87 rainiest year since 1895)
- Precipitation compared to 1901-2000 average: 2.87 inches above norm
#23. Mariposa County
- Five-year precipitation average: 29.55 inches
- Precipitation over the past year: 41.64 inches (#110 rainiest year since 1895)
- Precipitation compared to 1901-2000 average: 8.72 inches above norm
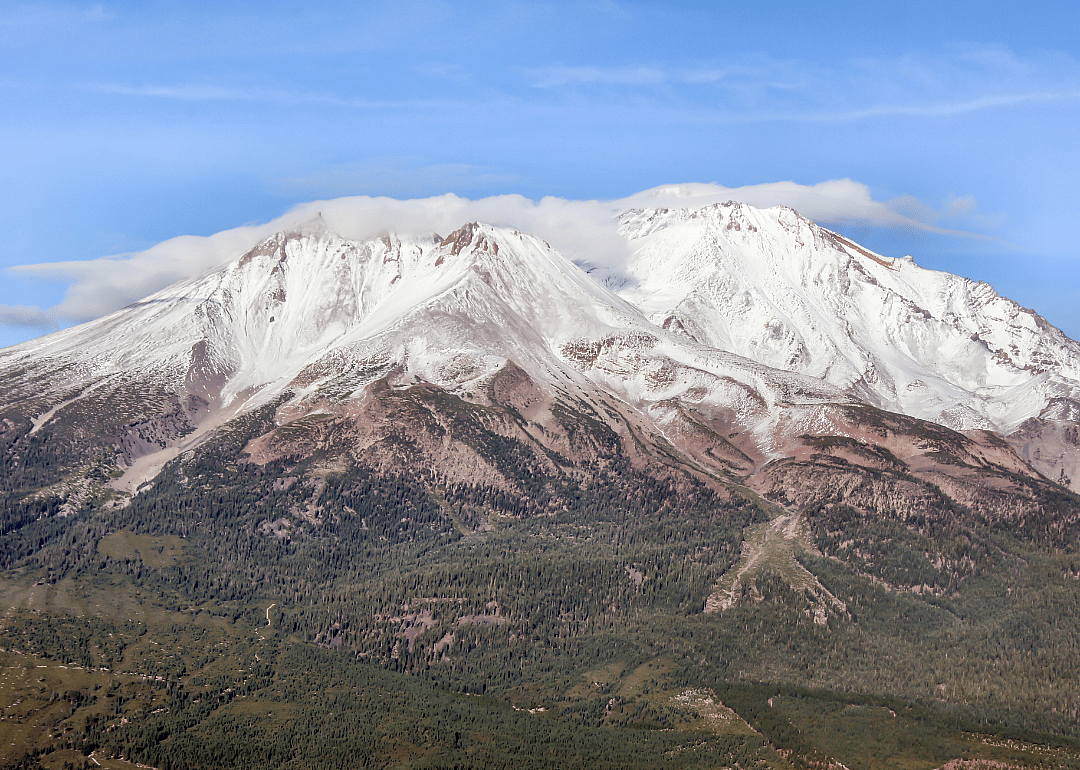
#22. Siskiyou County
- Five-year precipitation average: 29.58 inches
- Precipitation over the past year: 33.12 inches (#40 rainiest year since 1895)
- Precipitation compared to 1901-2000 average: -5.78 inches below norm
#20. Tehama County
- Five-year precipitation average: 31.17 inches
- Precipitation over the past year: 35.18 inches (#64 rainiest year since 1895)
- Precipitation compared to 1901-2000 average: -1.43 inches below norm
#19. Santa Cruz County
- Five-year precipitation average: 32.56 inches
- Precipitation over the past year: 46.66 inches (#117 rainiest year since 1895)
- Precipitation compared to 1901-2000 average: 13.50 inches above norm
#18. Yuba County
- Five-year precipitation average: 33.57 inches
- Precipitation over the past year: 38.46 inches (#74 rainiest year since 1895)
- Precipitation compared to 1901-2000 average: 0.64 inches above norm
#17. Calaveras County
- Five-year precipitation average: 34.39 inches
- Precipitation over the past year: 44.01 inches (#110 rainiest year since 1895)
- Precipitation compared to 1901-2000 average: 9.65 inches above norm
#15. Shasta County
- Five-year precipitation average: 35.84 inches
- Precipitation over the past year: 38.06 inches (#50 rainiest year since 1895)
- Precipitation compared to 1901-2000 average: -3.96 inches below norm
#14. Sonoma County
- Five-year precipitation average: 36.10 inches
- Precipitation over the past year: 43.99 inches (#77 rainiest year since 1895)
- Precipitation compared to 1901-2000 average: 1.84 inches above norm
#13. Alpine County
- Five-year precipitation average: 37.27 inches
- Precipitation over the past year: 53.32 inches (#119 rainiest year since 1895)
- Precipitation compared to 1901-2000 average: 17.05 inches above norm
#12. Butte County
- Five-year precipitation average: 37.29 inches
- Precipitation over the past year: 42.71 inches (#68 rainiest year since 1895)
- Precipitation compared to 1901-2000 average: -1.81 inches below norm
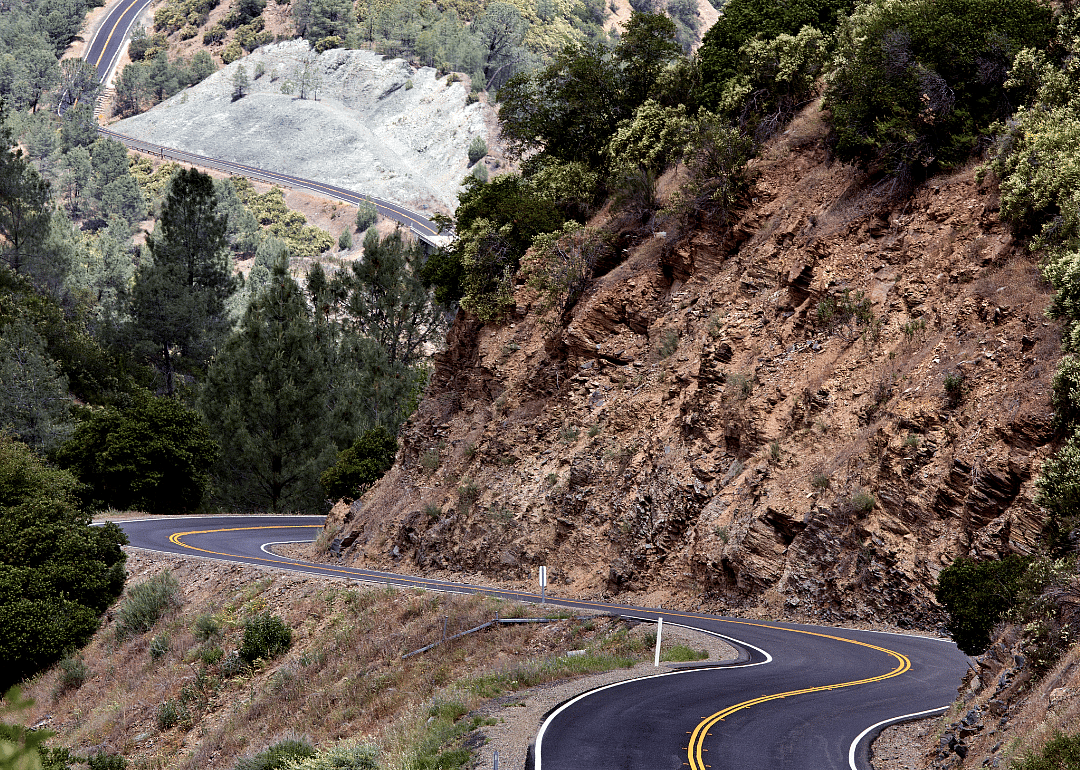
#10. Plumas County
- Five-year precipitation average: 37.84 inches
- Precipitation over the past year: 43.48 inches (#79 rainiest year since 1895)
- Precipitation compared to 1901-2000 average: 2.10 inches above norm
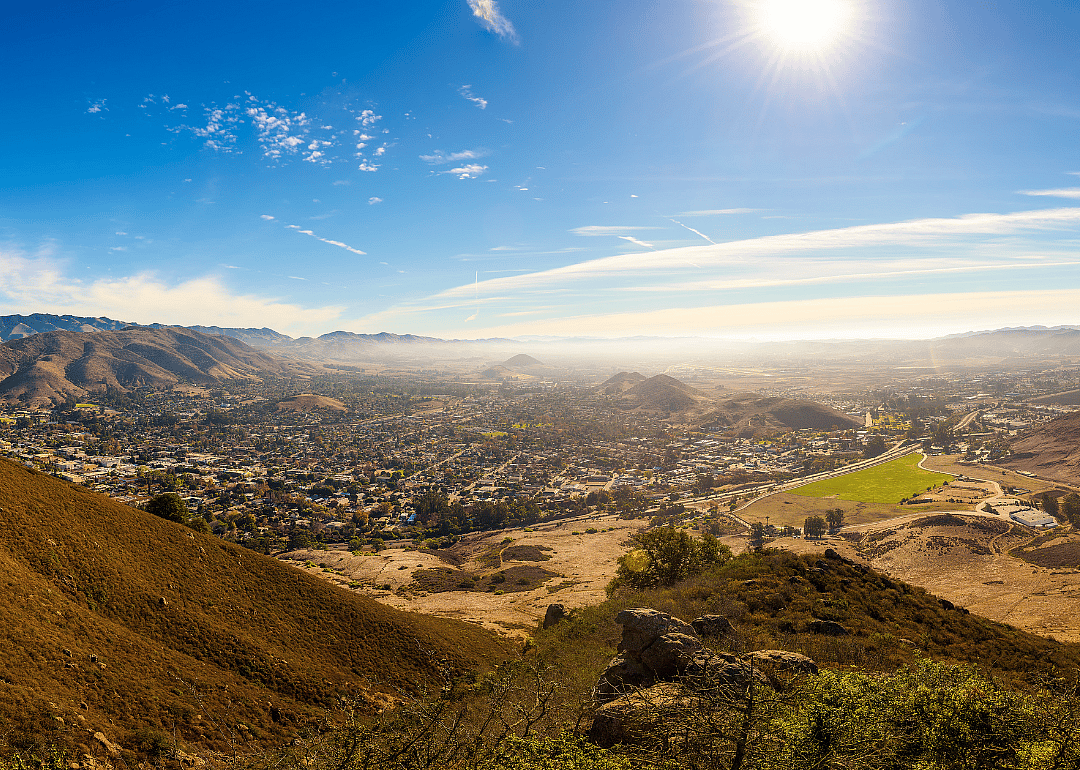
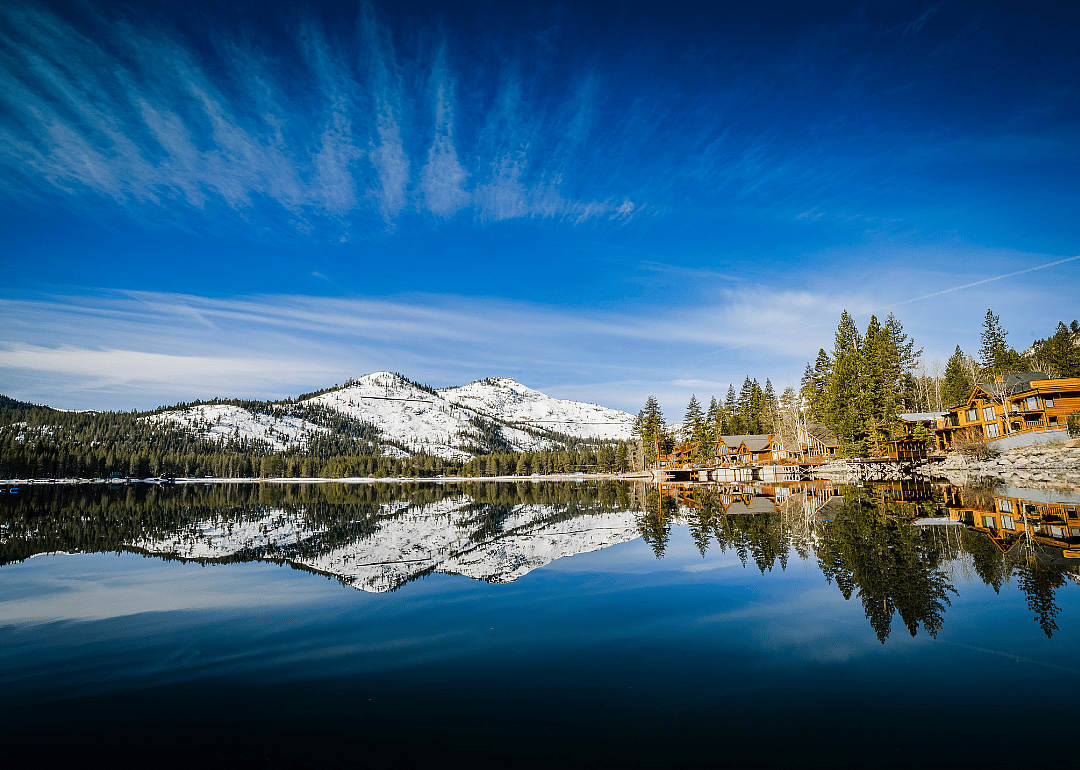
StephanieFarrell // Shutterstock
42 / 50#9. Tuolumne County
- Five-year precipitation average: 39.45 inches
- Precipitation over the past year: 54.20 inches (#113 rainiest year since 1895)
- Precipitation compared to 1901-2000 average: 13.21 inches above norm
#8. Mendocino County
- Five-year precipitation average: 42.92 inches
- Precipitation over the past year: 53.89 inches (#76 rainiest year since 1895)
- Precipitation compared to 1901-2000 average: 2.14 inches above norm
#7. Sierra County
- Five-year precipitation average: 43.11 inches
- Precipitation over the past year: 53.02 inches (#94 rainiest year since 1895)
- Precipitation compared to 1901-2000 average: 7.10 inches above norm
#5. Placer County
- Five-year precipitation average: 44.65 inches
- Precipitation over the past year: 56.99 inches (#105 rainiest year since 1895)
- Precipitation compared to 1901-2000 average: 11.08 inches above norm
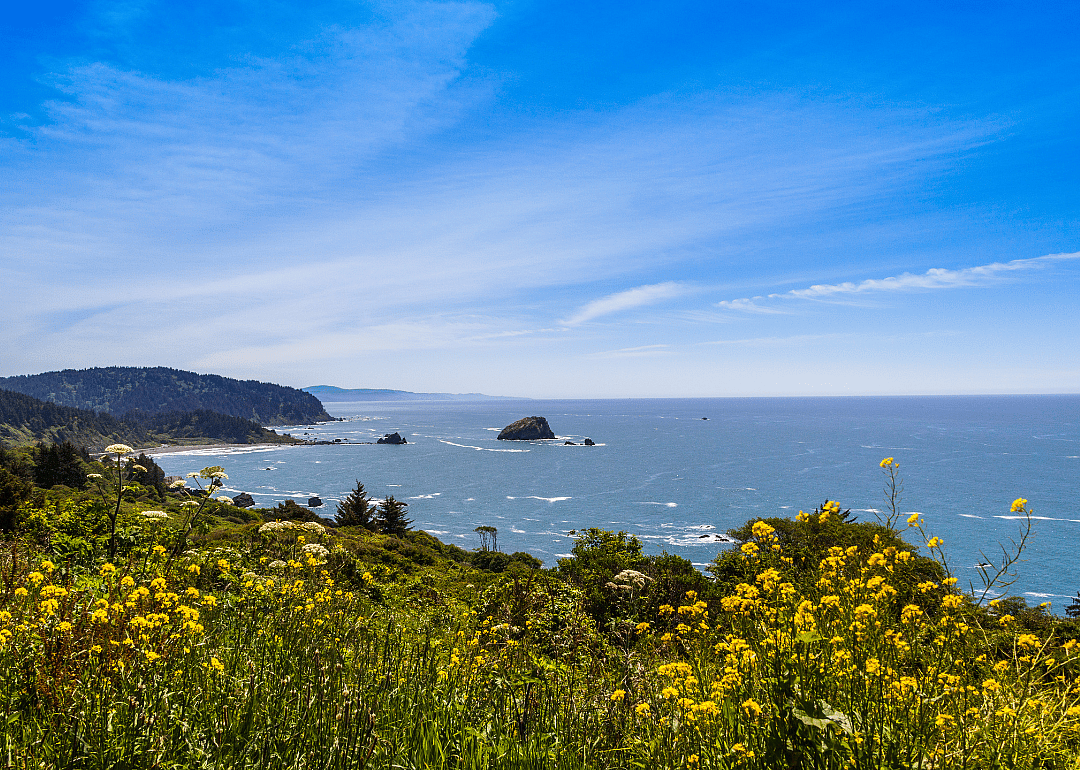
Gibson Outdoor Photo // Shutterstock
47 / 50#4. Trinity County
- Five-year precipitation average: 45.53 inches
- Precipitation over the past year: 55.48 inches (#61 rainiest year since 1895)
- Precipitation compared to 1901-2000 average: -2.14 inches below norm
#3. Nevada County
- Five-year precipitation average: 48.04 inches
- Precipitation over the past year: 59.92 inches (#97 rainiest year since 1895)
- Precipitation compared to 1901-2000 average: 9.40 inches above norm
#2. Humboldt County
- Five-year precipitation average: 52.42 inches
- Precipitation over the past year: 62.13 inches (#62 rainiest year since 1895)
- Precipitation compared to 1901-2000 average: -1.43 inches below norm