Stacker compiled a list of the counties with the best commutes in Colorado using data from the U.S. Census Bureau. Counties are ranked by the shortest average travel time to work, with ties broken by lowest percent of residents that commute over 60 minutes, and any further ties broken by lowest percent of residents that work outside the county of residence.
You may also like: Counties with the most motor vehicle accident fatalities in Colorado
#50. Jefferson County
- Mean travel time to work: 27.3
- Workers with 60+ minute commute: 7.0%
- Worked outside of county of residence: 44.2%
#49. Broomfield County
- Mean travel time to work: 26.7
- Workers with 60+ minute commute: 5.8%
- Worked outside of county of residence: 59.0%
#48. Fremont County
- Mean travel time to work: 25.8
- Workers with 60+ minute commute: 12.9%
- Worked outside of county of residence: 18.5%
#47. Moffat County
- Mean travel time to work: 25.7
- Workers with 60+ minute commute: 17.9%
- Worked outside of county of residence: 34.0%
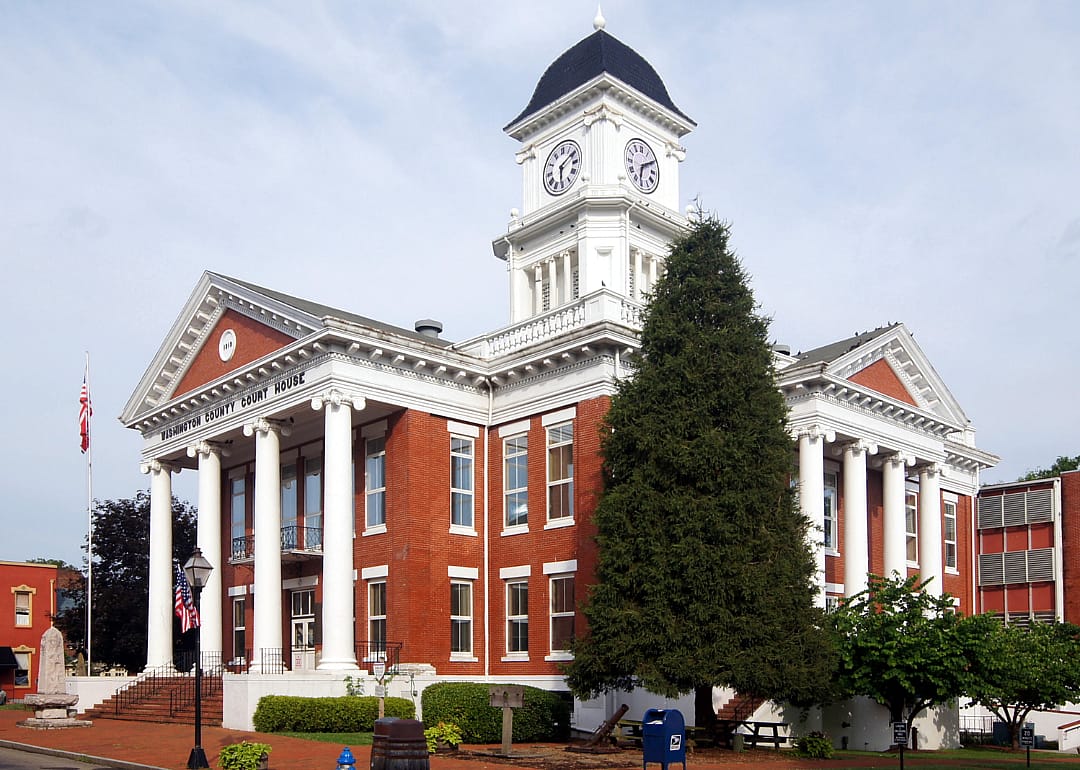
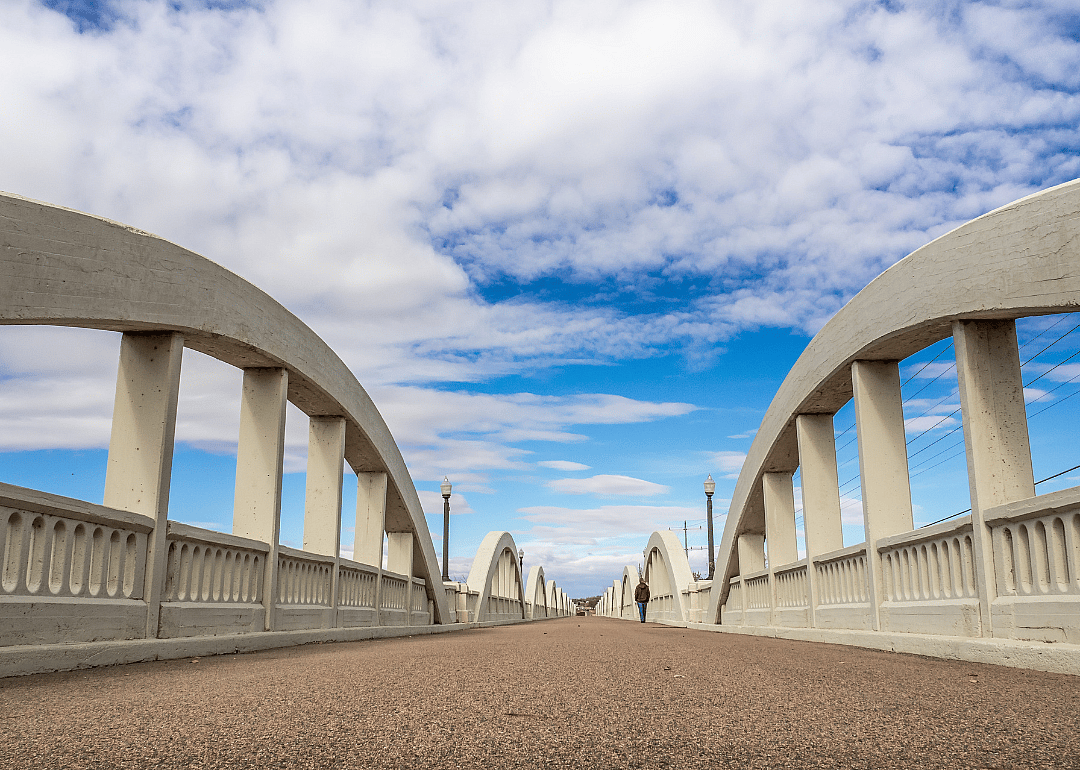
f11photo // Shutterstock
5 / 50#45. Costilla County
- Mean travel time to work: 25.3
- Workers with 60+ minute commute: 5.6%
- Worked outside of county of residence: 32.7%
#44. Conejos County
- Mean travel time to work: 24.9
- Workers with 60+ minute commute: 2.7%
- Worked outside of county of residence: 39.3%
#43. Larimer County
- Mean travel time to work: 23.9
- Workers with 60+ minute commute: 7.1%
- Worked outside of county of residence: 14.6%
#42. El Paso County
- Mean travel time to work: 23.9
- Workers with 60+ minute commute: 5.8%
- Worked outside of county of residence: 5.2%
#40. Grand County
- Mean travel time to work: 23.7
- Workers with 60+ minute commute: 7.0%
- Worked outside of county of residence: 9.7%
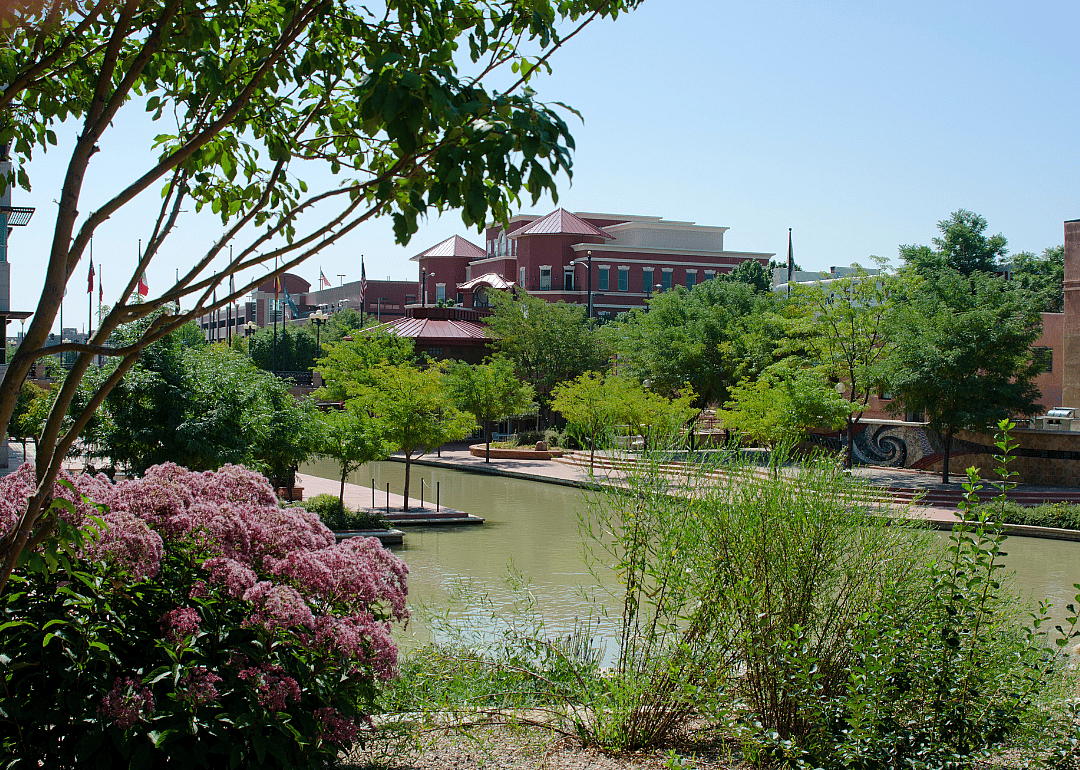
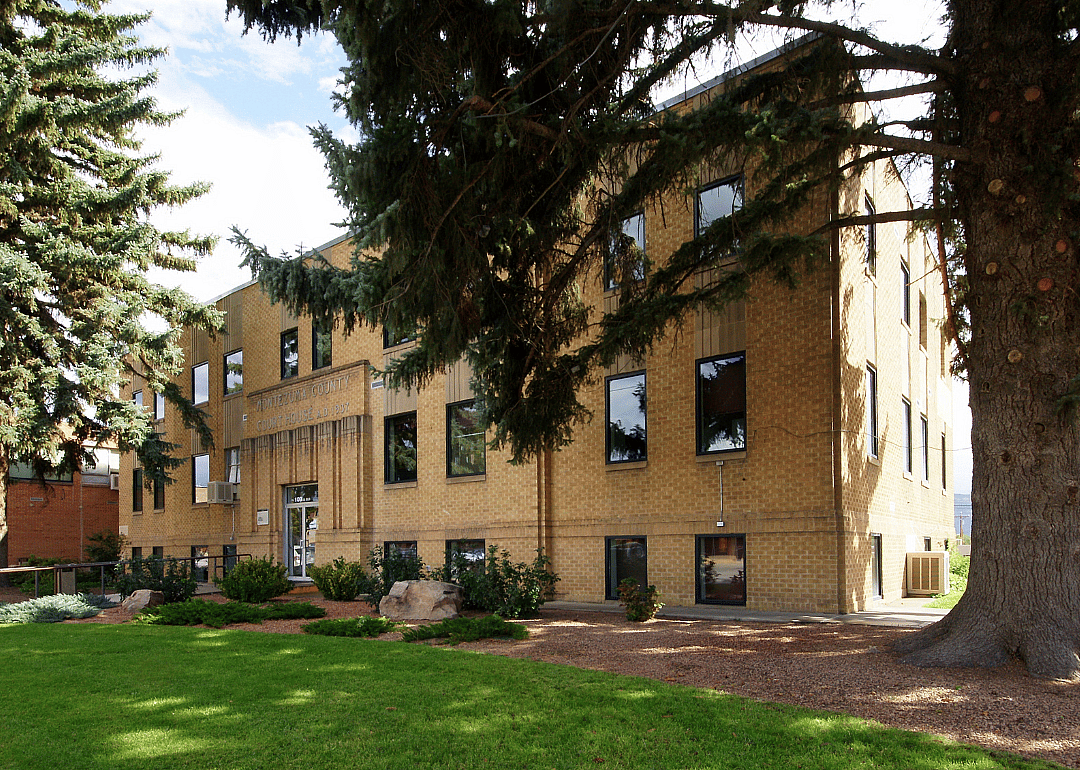
Maciej Bledowski // Shutterstock
12 / 50#39. Boulder County
- Mean travel time to work: 23.7
- Workers with 60+ minute commute: 6.4%
- Worked outside of county of residence: 17.9%
#38. Eagle County
- Mean travel time to work: 23.3
- Workers with 60+ minute commute: 5.0%
- Worked outside of county of residence: 16.4%
#37. Crowley County
- Mean travel time to work: 22.9
- Workers with 60+ minute commute: 12.7%
- Worked outside of county of residence: 57.4%
#35. Pueblo County
- Mean travel time to work: 22.2
- Workers with 60+ minute commute: 6.1%
- Worked outside of county of residence: 10.2%
#34. Jackson County
- Mean travel time to work: 22.1
- Workers with 60+ minute commute: 10.7%
- Worked outside of county of residence: 9.1%
#33. La Plata County
- Mean travel time to work: 21.7
- Workers with 60+ minute commute: 4.1%
- Worked outside of county of residence: 2.1%
#32. Otero County
- Mean travel time to work: 21.4
- Workers with 60+ minute commute: 8.0%
- Worked outside of county of residence: 11.7%
#30. Morgan County
- Mean travel time to work: 20.8
- Workers with 60+ minute commute: 10.4%
- Worked outside of county of residence: 12.5%
#29. Montezuma County
- Mean travel time to work: 20.5
- Workers with 60+ minute commute: 8.0%
- Worked outside of county of residence: 8.5%
#28. Huerfano County
- Mean travel time to work: 20.5
- Workers with 60+ minute commute: 6.6%
- Worked outside of county of residence: 6.8%
#27. Montrose County
- Mean travel time to work: 20.2
- Workers with 60+ minute commute: 7.7%
- Worked outside of county of residence: 13.0%
#25. Saguache County
- Mean travel time to work: 19.7
- Workers with 60+ minute commute: 3.4%
- Worked outside of county of residence: 29.4%
#24. Las Animas County
- Mean travel time to work: 19.6
- Workers with 60+ minute commute: 6.7%
- Worked outside of county of residence: 4.5%
#23. Routt County
- Mean travel time to work: 19.5
- Workers with 60+ minute commute: 4.7%
- Worked outside of county of residence: 3.5%
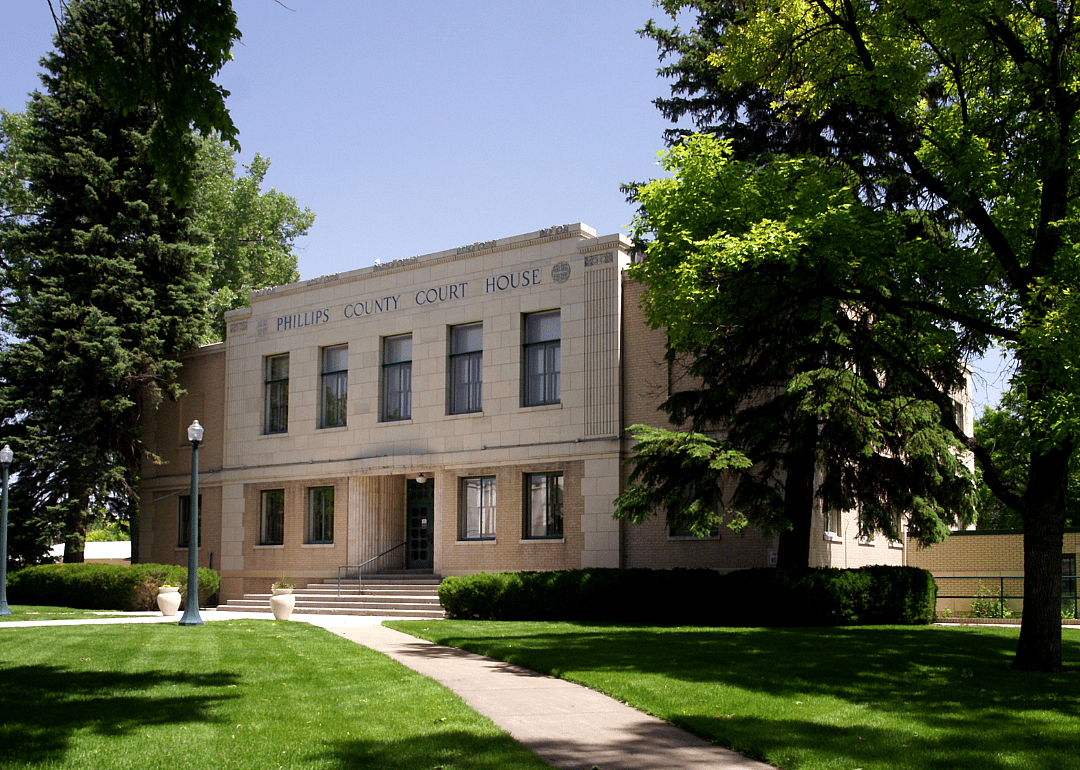
#22. Phillips County
- Mean travel time to work: 19.5
- Workers with 60+ minute commute: 3.7%
- Worked outside of county of residence: 15.9%
#20. Summit County
- Mean travel time to work: 19.2
- Workers with 60+ minute commute: 4.8%
- Worked outside of county of residence: 3.5%
#19. Mesa County
- Mean travel time to work: 18.9
- Workers with 60+ minute commute: 4.3%
- Worked outside of county of residence: 3.6%
#18. Lincoln County
- Mean travel time to work: 18.4
- Workers with 60+ minute commute: 10.3%
- Worked outside of county of residence: 12.3%
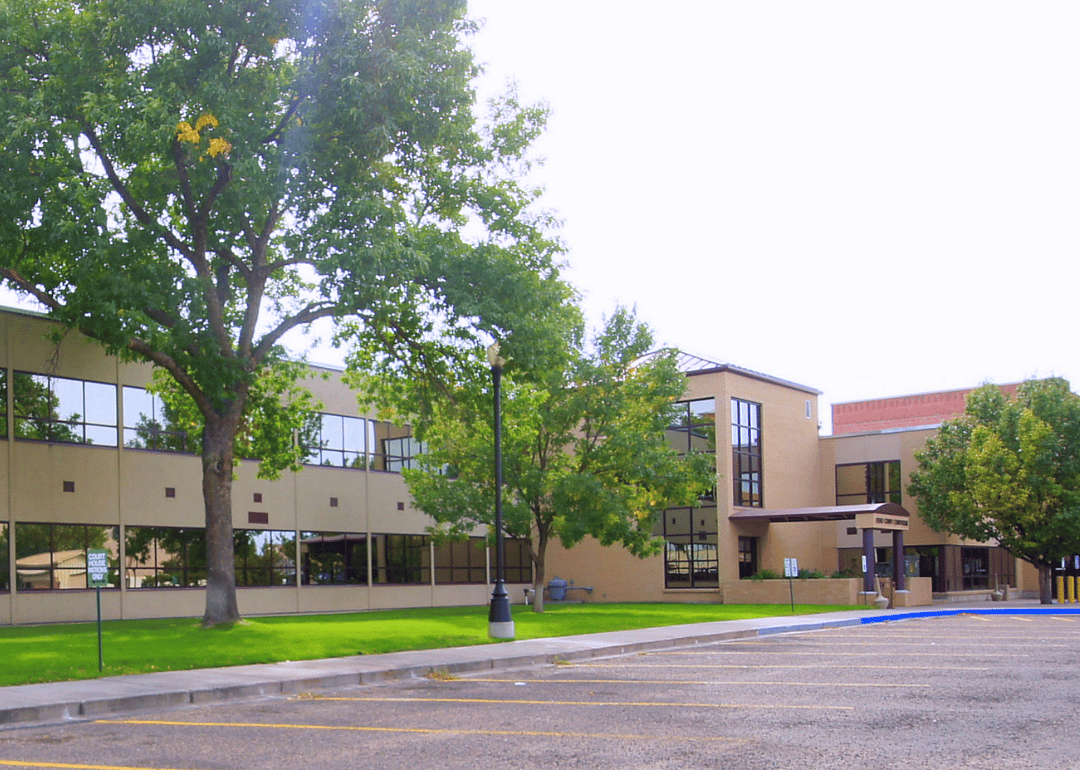
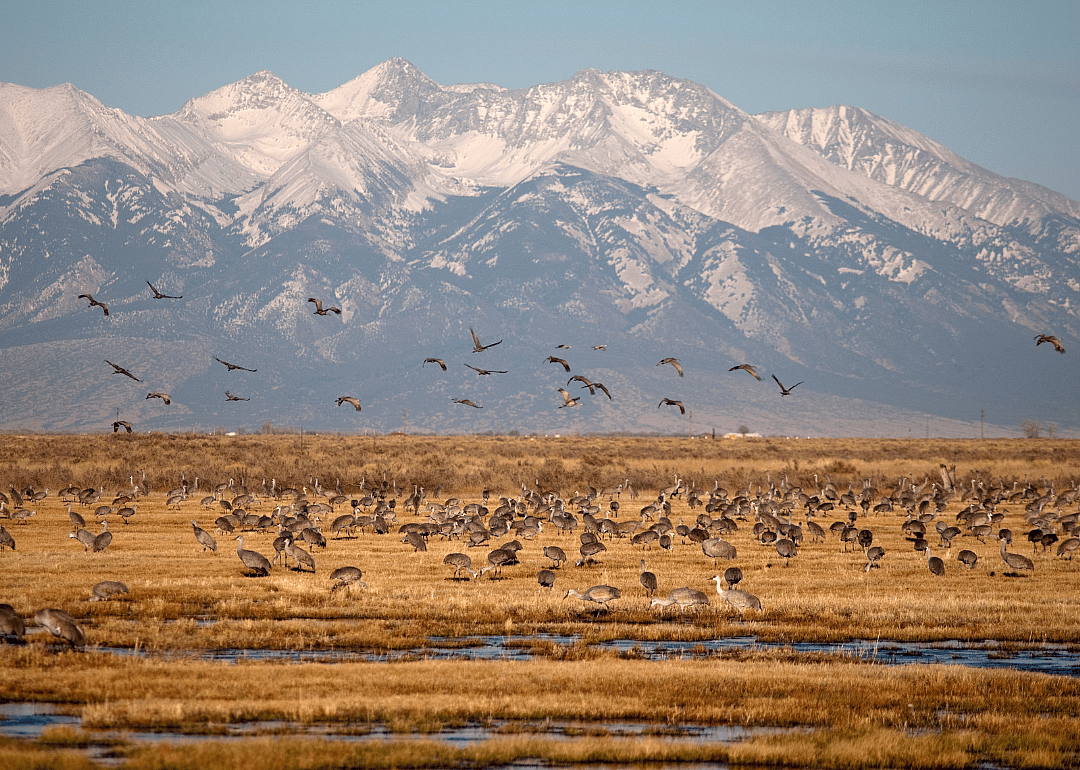
Bob Pool // Shutterstock
34 / 50#17. Logan County
- Mean travel time to work: 17.6
- Workers with 60+ minute commute: 5.7%
- Worked outside of county of residence: 10.8%
#16. San Miguel County
- Mean travel time to work: 17.5
- Workers with 60+ minute commute: 2.5%
- Worked outside of county of residence: 2.5%
You may also like: Best colleges in Colorado
#15. Chaffee County
- Mean travel time to work: 17.0
- Workers with 60+ minute commute: 6.5%
- Worked outside of county of residence: 5.0%
#14. Bent County
- Mean travel time to work: 16.6
- Workers with 60+ minute commute: 5.6%
- Worked outside of county of residence: 34.7%
#13. Gunnison County
- Mean travel time to work: 16.4
- Workers with 60+ minute commute: 2.8%
- Worked outside of county of residence: 4.5%
#12. Dolores County
- Mean travel time to work: 16.3
- Workers with 60+ minute commute: 2.1%
- Worked outside of county of residence: 24.6%
#10. Prowers County
- Mean travel time to work: 15.9
- Workers with 60+ minute commute: 4.0%
- Worked outside of county of residence: 10.3%
#9. Alamosa County
- Mean travel time to work: 15.8
- Workers with 60+ minute commute: 3.7%
- Worked outside of county of residence: 18.8%
#8. Cheyenne County
- Mean travel time to work: 15.0
- Workers with 60+ minute commute: 3.5%
- Worked outside of county of residence: 8.4%
#7. Kit Carson County
- Mean travel time to work: 14.6
- Workers with 60+ minute commute: 3.6%
- Worked outside of county of residence: 5.2%
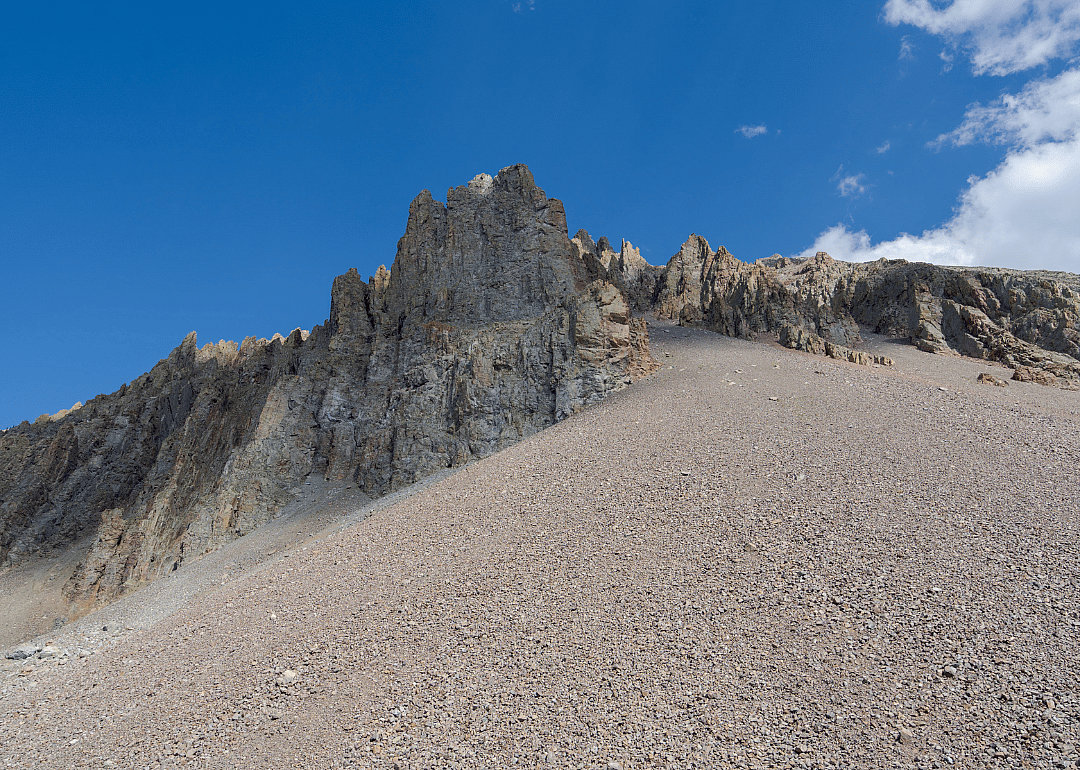
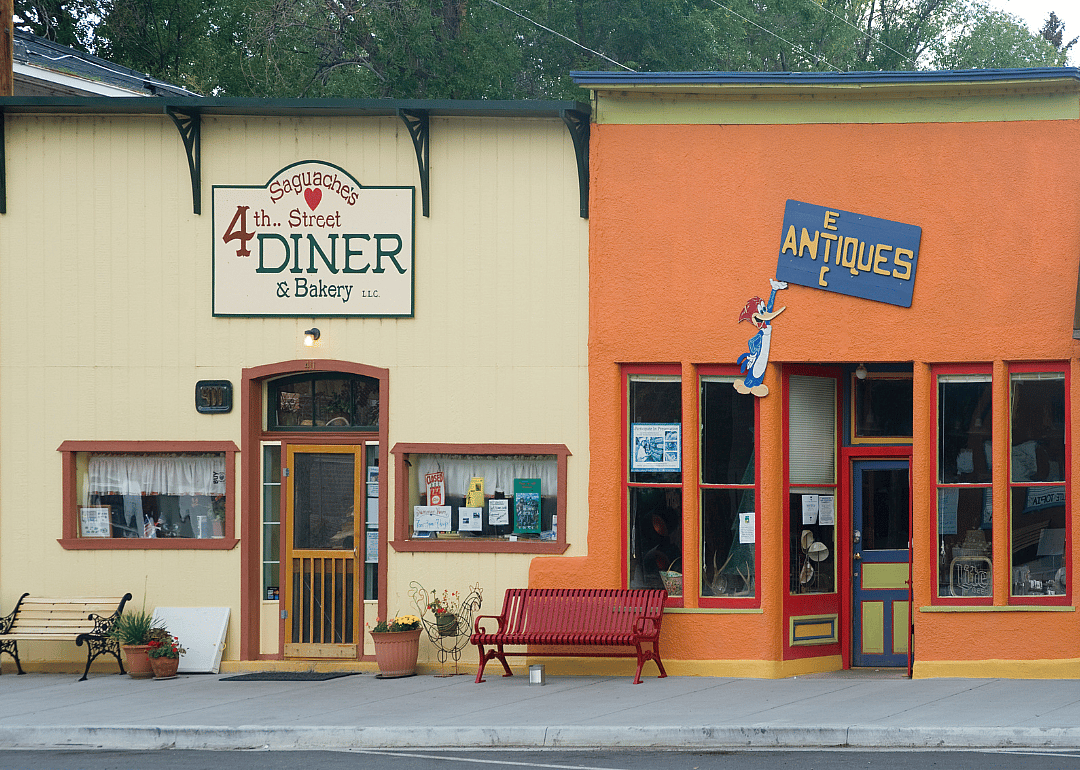
Jacob Boomsma // Shutterstock
46 / 50#5. Kiowa County
- Mean travel time to work: 14.3
- Workers with 60+ minute commute: 2.8%
- Worked outside of county of residence: 12.7%
#4. Yuma County
- Mean travel time to work: 14.0
- Workers with 60+ minute commute: 4.6%
- Worked outside of county of residence: 5.3%
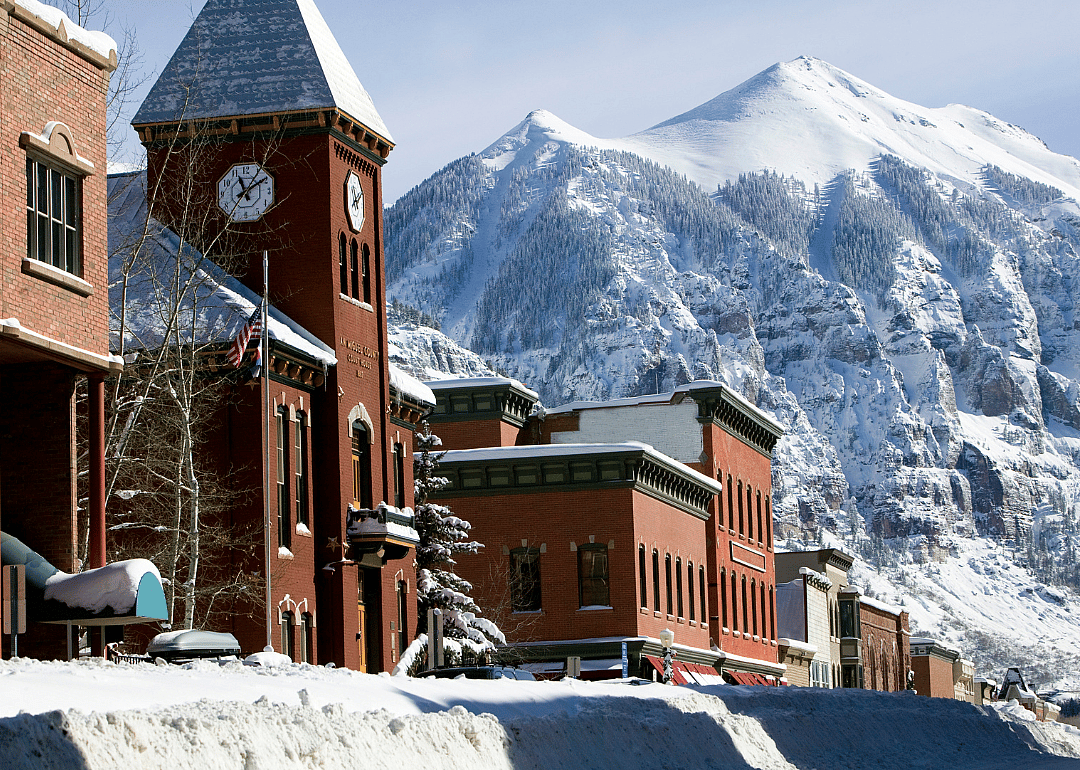
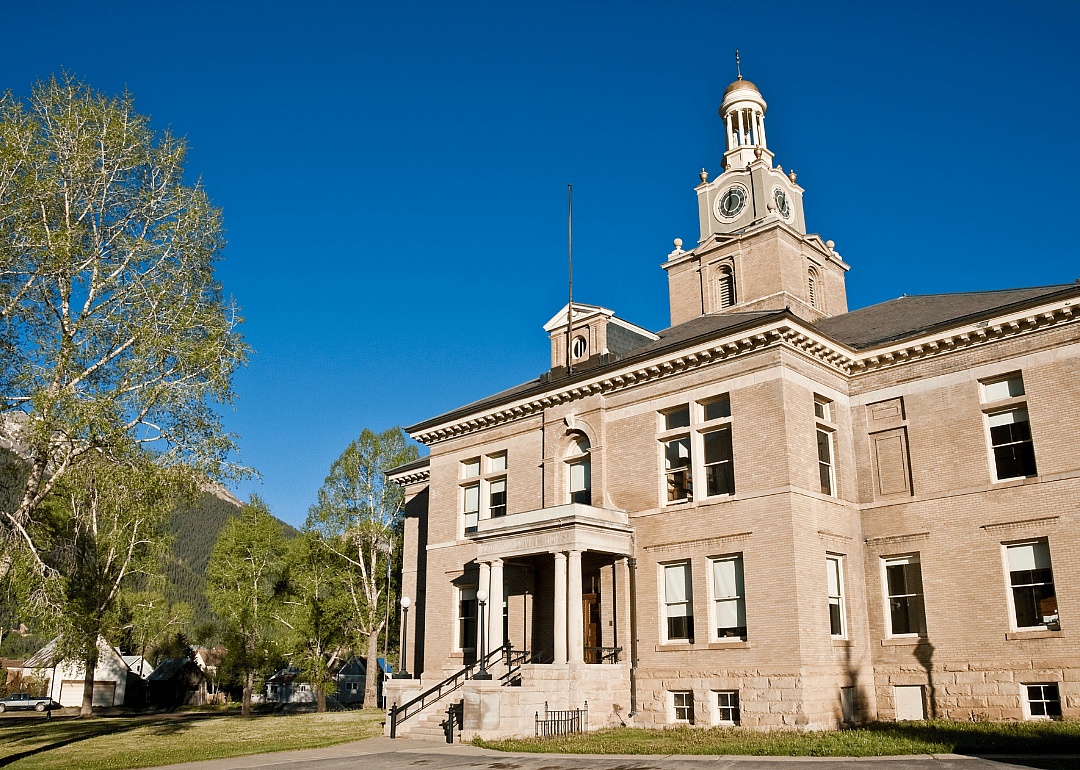
#3. San Juan County
- Mean travel time to work: 13.5
- Workers with 60+ minute commute: 3.8%
- Worked outside of county of residence: 8.1%
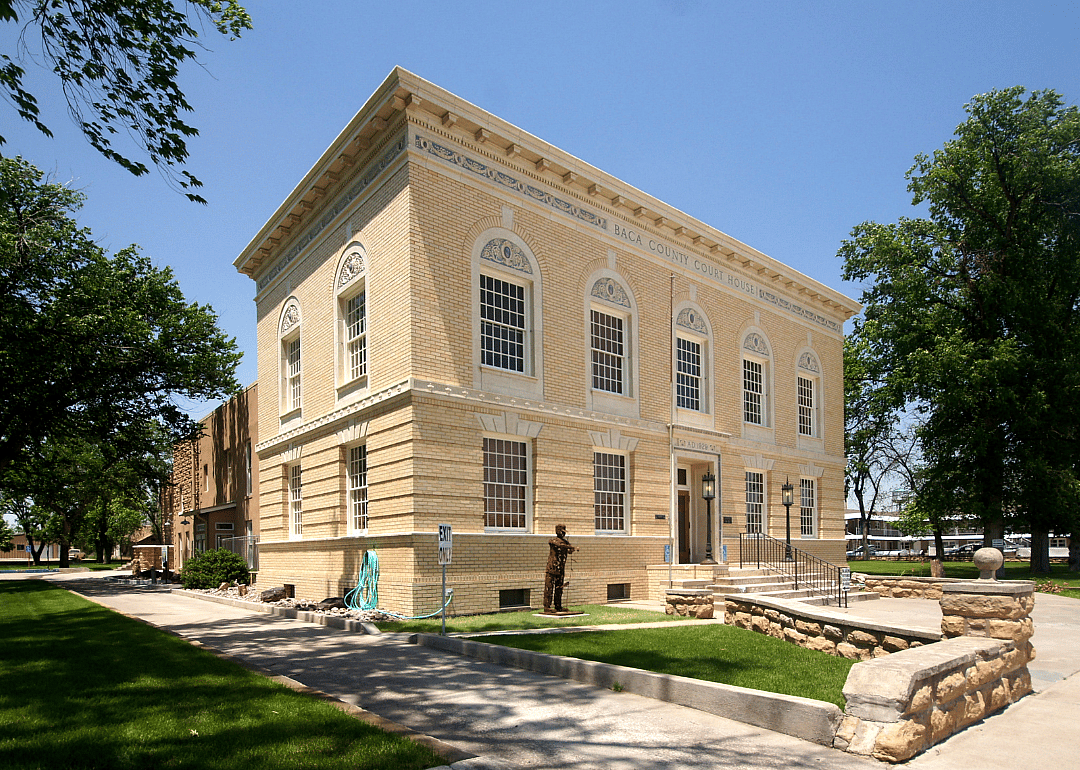
#2. Baca County
- Mean travel time to work: 12.0
- Workers with 60+ minute commute: 1.4%
- Worked outside of county of residence: 8.8%