Most diverse counties in Colorado

·Stacker

Canva
Canva

The United States has a longstanding reputation as being a melting pot (or salad bowl), with its diversity manifesting itself across many different demographics. However, some places across the country are notably more heterogeneous than others.

Stacker compiled a list of the most diverse counties in Colorado using data from using data from the U.S. Census Bureau. Counties are ranked by the highest Simpson's diversity index score. Simpson's diversity index measures community diversity on a scale of 0 (least diverse) to 1 (most diverse), more on the calculation can be read here.

Think you know which counties in your home state might be the most diverse? Keep reading to see if your predictions are correct.

You may also like: Colorado's Halloween sweet tooth: 2025 candy and decor trends from Instacart data

#50. Prowers County

Aualliso // Wikimedia Commons

1 / 50

#50. Prowers County

- Index: 0.108
- Total population: 12,022
- White: 94.4% (11,351)
- Black or African American: 0.8% (95)
- American Indian and Alaska Native: 1.5% (181)
- Asian: 0.6% (70)
- Native Hawaiian and other Pacific Islander: 0.0% (0)
- 2 or more races: 1.7% (202)
- Some other Race: 1.0% (123)
#49. Moffat County

RandieCraft // Wikimedia Commons

2 / 50

#49. Moffat County

- Index: 0.108
- Total population: 13,127
- White: 94.4% (12,388)
- Black or African American: 1.2% (158)
- American Indian and Alaska Native: 0.5% (71)
- Asian: 0.1% (18)
- Native Hawaiian and other Pacific Islander: 0.0% (0)
- 2 or more races: 2.6% (342)
- Some other Race: 1.1% (150)
#48. Park County

Thomson200 // Wikimedia Commons

3 / 50

#48. Park County

- Index: 0.109
- Total population: 17,867
- White: 94.3% (16,856)
- Black or African American: 0.3% (56)
- American Indian and Alaska Native: 0.4% (75)
- Asian: 0.7% (123)
- Native Hawaiian and other Pacific Islander: 0.1% (23)
- 2 or more races: 3.4% (611)
- Some other Race: 0.7% (123)
#47. Baca County

Aualliso // Wikimedia Commons

4 / 50

#47. Baca County

- Index: 0.110
- Total population: 3,561
- White: 94.3% (3,357)
- Black or African American: 1.0% (34)
- American Indian and Alaska Native: 1.6% (57)
- Asian: 0.0% (0)
- Native Hawaiian and other Pacific Islander: 0.1% (3)
- 2 or more races: 2.3% (81)
- Some other Race: 0.8% (29)
#46. Clear Creek County

Dsdugan // Wikimedia Commons

5 / 50

#46. Clear Creek County

- Index: 0.111
- Total population: 9,495
- White: 94.2% (8,947)
- Black or African American: 1.2% (114)
- American Indian and Alaska Native: 0.3% (28)
- Asian: 1.0% (91)
- Native Hawaiian and other Pacific Islander: 0.1% (14)
- 2 or more races: 3.2% (300)
- Some other Race: 0.0% (1)

You may also like: Hottest Novembers in Colorado since 1895

#45. Hinsdale County

Canva

6 / 50

#45. Hinsdale County

- Index: 0.112
- Total population: 857
- White: 94.2% (807)
- Black or African American: 0.0% (0)
- American Indian and Alaska Native: 2.3% (20)
- Asian: 0.5% (4)
- Native Hawaiian and other Pacific Islander: 0.0% (0)
- 2 or more races: 2.1% (18)
- Some other Race: 0.9% (8)
#44. Montrose County

Jeffrey Beall from Colorado, USA // Wikimedia Commons

7 / 50

#44. Montrose County

- Index: 0.113
- Total population: 41,686
- White: 94.2% (39,254)
- Black or African American: 0.4% (163)
- American Indian and Alaska Native: 0.9% (390)
- Asian: 0.9% (386)
- Native Hawaiian and other Pacific Islander: 0.3% (133)
- 2 or more races: 1.6% (665)
- Some other Race: 1.7% (695)
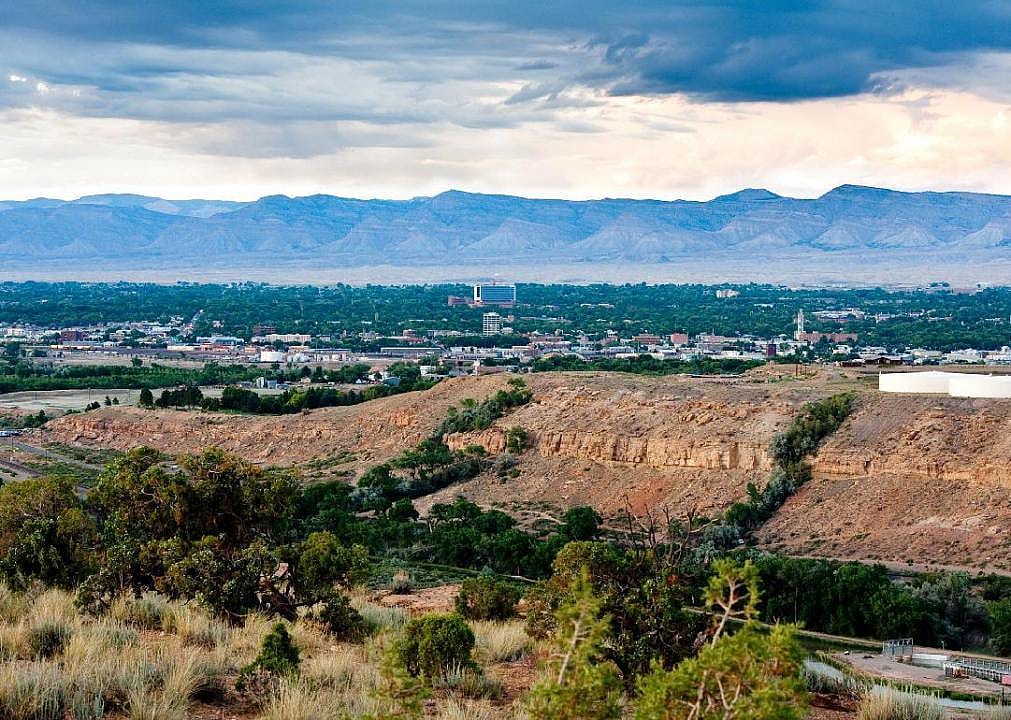
#43. Mesa County

Eleaf // Wikimedia Commons

8 / 50

#43. Mesa County

- Index: 0.115
- Total population: 151,218
- White: 94.0% (142,163)
- Black or African American: 0.7% (1,020)
- American Indian and Alaska Native: 0.9% (1,315)
- Asian: 0.9% (1,411)
- Native Hawaiian and other Pacific Islander: 0.1% (213)
- 2 or more races: 2.3% (3,468)
- Some other Race: 1.1% (1,628)
#42. Chaffee County

Jeffrey Beall // Wikimedia Commons

9 / 50

#42. Chaffee County

- Index: 0.121
- Total population: 19,557
- White: 93.7% (18,324)
- Black or African American: 1.7% (330)
- American Indian and Alaska Native: 0.5% (97)
- Asian: 1.5% (290)
- Native Hawaiian and other Pacific Islander: 0.0% (0)
- 2 or more races: 1.9% (366)
- Some other Race: 0.8% (150)
#41. Sedgwick County

Calvin Beale // Wikimedia Commons

10 / 50

#41. Sedgwick County

- Index: 0.122
- Total population: 2,322
- White: 93.7% (2,175)
- Black or African American: 0.8% (19)
- American Indian and Alaska Native: 0.6% (15)
- Asian: 0.9% (22)
- Native Hawaiian and other Pacific Islander: 0.0% (0)
- 2 or more races: 1.4% (33)
- Some other Race: 2.5% (58)

You may also like: The scoop on Colorado's ice cream preferences, according to Instacart

#40. Elbert County

Jeffrey Beall // Wikimedia Commons

11 / 50

#40. Elbert County

- Index: 0.123
- Total population: 25,717
- White: 93.6% (24,062)
- Black or African American: 0.4% (110)
- American Indian and Alaska Native: 1.0% (251)
- Asian: 1.0% (259)
- Native Hawaiian and other Pacific Islander: 0.1% (21)
- 2 or more races: 3.0% (759)
- Some other Race: 1.0% (255)
#39. Cheyenne County

Aualliso // Wikimedia Commons

12 / 50

#39. Cheyenne County

- Index: 0.124
- Total population: 2,026
- White: 93.5% (1,894)
- Black or African American: 0.1% (2)
- American Indian and Alaska Native: 0.1% (2)
- Asian: 2.2% (44)
- Native Hawaiian and other Pacific Islander: 0.2% (4)
- 2 or more races: 3.9% (80)
- Some other Race: 0.0% (0)
#38. Custer County

Jeffrey Beall // Wikimedia Commons

13 / 50

#38. Custer County

- Index: 0.134
- Total population: 4,776
- White: 93.0% (4,441)
- Black or African American: 2.9% (138)
- American Indian and Alaska Native: 0.9% (44)
- Asian: 0.0% (0)
- Native Hawaiian and other Pacific Islander: 0.0% (0)
- 2 or more races: 2.4% (115)
- Some other Race: 0.8% (38)
#37. Gilpin County

Jeffrey Beall // Wikimedia Commons

14 / 50

#37. Gilpin County

- Index: 0.143
- Total population: 6,018
- White: 92.4% (5,562)
- Black or African American: 0.3% (20)
- American Indian and Alaska Native: 2.7% (163)
- Asian: 0.0% (0)
- Native Hawaiian and other Pacific Islander: 0.0% (0)
- 2 or more races: 4.5% (270)
- Some other Race: 0.0% (3)
#36. Rio Blanco County

Jeffrey Beall // Wikimedia Commons

15 / 50

#36. Rio Blanco County

- Index: 0.143
- Total population: 6,384
- White: 92.4% (5,898)
- Black or African American: 0.5% (30)
- American Indian and Alaska Native: 1.1% (73)
- Asian: 0.1% (8)
- Native Hawaiian and other Pacific Islander: 0.0% (0)
- 2 or more races: 5.6% (357)
- Some other Race: 0.3% (18)

You may also like: Highest-rated free things to do in Colorado by visitors

#35. Kit Carson County

Jeffrey Beall // Wikimedia Commons

16 / 50

#35. Kit Carson County

- Index: 0.149
- Total population: 7,447
- White: 92.1% (6,861)
- Black or African American: 2.5% (186)
- American Indian and Alaska Native: 0.4% (31)
- Asian: 0.2% (14)
- Native Hawaiian and other Pacific Islander: 0.3% (19)
- 2 or more races: 0.7% (55)
- Some other Race: 3.8% (281)
#34. Huerfano County

Jeffrey Beall // Wikimedia Commons

17 / 50

#34. Huerfano County

- Index: 0.153
- Total population: 6,679
- White: 91.9% (6,140)
- Black or African American: 0.5% (34)
- American Indian and Alaska Native: 1.8% (120)
- Asian: 0.0% (0)
- Native Hawaiian and other Pacific Islander: 0.0% (0)
- 2 or more races: 4.2% (282)
- Some other Race: 1.5% (103)
#33. Rio Grande County

Jeffrey Beall // Wikimedia Commons

18 / 50

#33. Rio Grande County

- Index: 0.161
- Total population: 11,305
- White: 91.5% (10,346)
- Black or African American: 0.9% (106)
- American Indian and Alaska Native: 2.4% (266)
- Asian: 0.1% (8)
- Native Hawaiian and other Pacific Islander: 0.1% (14)
- 2 or more races: 2.1% (239)
- Some other Race: 2.9% (326)
#32. Logan County

Acutemi // Wikimedia Commons

19 / 50

#32. Logan County

- Index: 0.163
- Total population: 22,380
- White: 91.4% (20,452)
- Black or African American: 0.8% (189)
- American Indian and Alaska Native: 0.8% (176)
- Asian: 0.8% (185)
- Native Hawaiian and other Pacific Islander: 0.9% (210)
- 2 or more races: 4.1% (917)
- Some other Race: 1.1% (251)
#31. Bent County

Billy Hathorn // Wikimedia Commons

20 / 50

#31. Bent County

- Index: 0.163
- Total population: 5,787
- White: 91.4% (5,287)
- Black or African American: 4.1% (238)
- American Indian and Alaska Native: 1.0% (60)
- Asian: 0.2% (12)
- Native Hawaiian and other Pacific Islander: 0.0% (0)
- 2 or more races: 1.4% (82)
- Some other Race: 1.9% (108)

You may also like: Best counties to retire to in Colorado

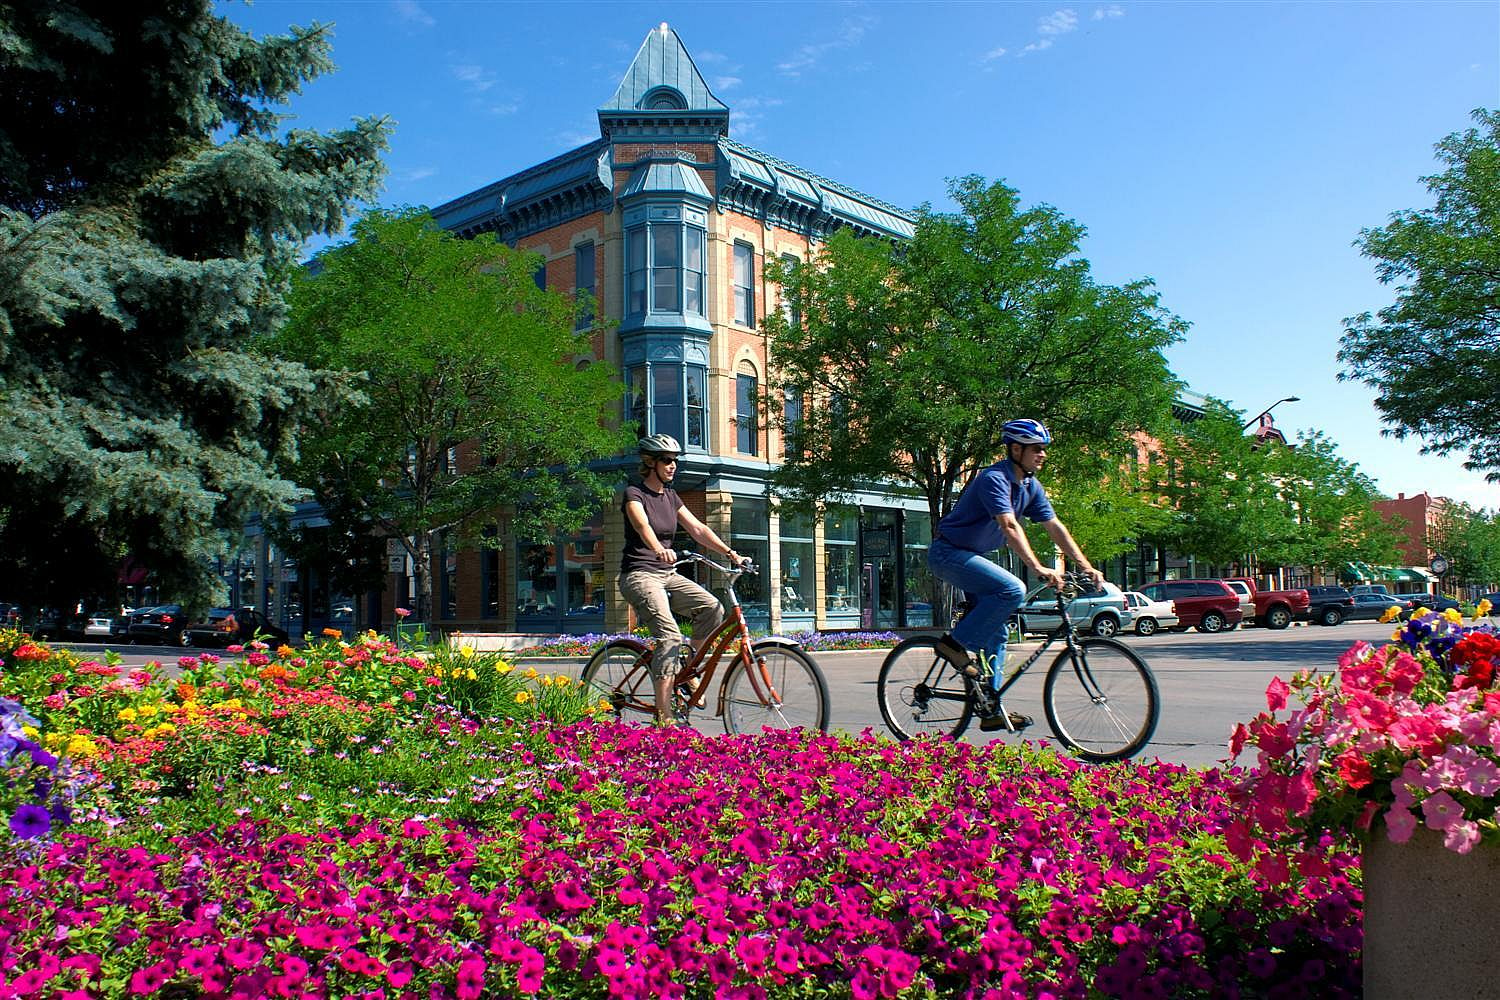
#30. Larimer County

Citycommunications // Wikicommons

21 / 50

#30. Larimer County

- Index: 0.164
- Total population: 344,786
- White: 91.3% (314,957)
- Black or African American: 1.0% (3,387)
- American Indian and Alaska Native: 0.8% (2,661)
- Asian: 2.2% (7,546)
- Native Hawaiian and other Pacific Islander: 0.1% (261)
- 2 or more races: 3.2% (10,945)
- Some other Race: 1.5% (5,029)
#29. Summit County

Canva

22 / 50

#29. Summit County

- Index: 0.164
- Total population: 30,649
- White: 91.3% (27,978)
- Black or African American: 1.1% (342)
- American Indian and Alaska Native: 0.4% (111)
- Asian: 0.6% (179)
- Native Hawaiian and other Pacific Islander: 0.3% (79)
- 2 or more races: 1.9% (580)
- Some other Race: 4.5% (1,380)
#28. Pitkin County

Canva

23 / 50

#28. Pitkin County

- Index: 0.167
- Total population: 17,926
- White: 91.1% (16,339)
- Black or African American: 1.0% (174)
- American Indian and Alaska Native: 0.1% (18)
- Asian: 2.2% (403)
- Native Hawaiian and other Pacific Islander: 0.0% (0)
- 2 or more races: 1.4% (250)
- Some other Race: 4.1% (742)
#27. Jefferson County

Yassie // Wikimedia Commons

24 / 50

#27. Jefferson County

- Index: 0.178
- Total population: 574,798
- White: 90.6% (520,619)
- Black or African American: 1.2% (6,839)
- American Indian and Alaska Native: 0.7% (3,974)
- Asian: 2.8% (16,256)
- Native Hawaiian and other Pacific Islander: 0.1% (321)
- 2 or more races: 2.8% (16,136)
- Some other Race: 1.9% (10,653)
#26. Weld County

Peter Romero // Wikimedia Commons

25 / 50

#26. Weld County

- Index: 0.182
- Total population: 305,345
- White: 90.3% (275,792)
- Black or African American: 1.2% (3,643)
- American Indian and Alaska Native: 0.8% (2,331)
- Asian: 1.6% (4,833)
- Native Hawaiian and other Pacific Islander: 0.1% (361)
- 2 or more races: 3.0% (9,176)
- Some other Race: 3.0% (9,209)

You may also like: Counties in Colorado with the most car repair shops

#25. Saguache County

Jeffrey Beall // Wikimedia Commons

26 / 50

#25. Saguache County

- Index: 0.183
- Total population: 6,592
- White: 90.2% (5,948)
- Black or African American: 0.5% (33)
- American Indian and Alaska Native: 2.0% (130)
- Asian: 0.0% (0)
- Native Hawaiian and other Pacific Islander: 0.0% (0)
- 2 or more races: 4.4% (292)
- Some other Race: 2.9% (189)
#24. Otero County

Billy Hathorn // Wikimedia Commons

27 / 50

#24. Otero County

- Index: 0.185
- Total population: 18,282
- White: 90.1% (16,479)
- Black or African American: 0.6% (113)
- American Indian and Alaska Native: 1.2% (218)
- Asian: 0.9% (167)
- Native Hawaiian and other Pacific Islander: 0.1% (13)
- 2 or more races: 3.1% (560)
- Some other Race: 4.0% (732)
#23. Fremont County

Jeffrey Beall // Wikimedia Commons

28 / 50

#23. Fremont County

- Index: 0.190
- Total population: 47,321
- White: 89.8% (42,504)
- Black or African American: 4.6% (2,177)
- American Indian and Alaska Native: 1.4% (649)
- Asian: 0.7% (320)
- Native Hawaiian and other Pacific Islander: 0.0% (5)
- 2 or more races: 2.2% (1,049)
- Some other Race: 1.3% (617)
#22. Lincoln County

Ammodramus // Wikimedia Commons

29 / 50

#22. Lincoln County

- Index: 0.201
- Total population: 5,585
- White: 89.0% (4,971)
- Black or African American: 8.2% (459)
- American Indian and Alaska Native: 0.8% (46)
- Asian: 0.4% (23)
- Native Hawaiian and other Pacific Islander: 0.2% (13)
- 2 or more races: 0.9% (52)
- Some other Race: 0.4% (21)
#21. Eagle County

Jeffrey Beall // Wikimedia Commons

30 / 50

#21. Eagle County

- Index: 0.205
- Total population: 54,681
- White: 88.9% (48,591)
- Black or African American: 1.2% (642)
- American Indian and Alaska Native: 0.2% (135)
- Asian: 0.7% (357)
- Native Hawaiian and other Pacific Islander: 0.1% (34)
- 2 or more races: 1.8% (967)
- Some other Race: 7.2% (3,955)

You may also like: Counties with the most veterans in Colorado

#20. Boulder County

Maciej Bledowski // Shutterstock

31 / 50

#20. Boulder County

- Index: 0.205
- Total population: 322,510
- White: 89.0% (286,950)
- Black or African American: 0.9% (2,944)
- American Indian and Alaska Native: 0.4% (1,416)
- Asian: 4.7% (15,281)
- Native Hawaiian and other Pacific Islander: 0.1% (203)
- 2 or more races: 3.0% (9,782)
- Some other Race: 1.8% (5,934)
#19. Douglas County

Billy Hathorn // Wikimedia Commons

32 / 50

#19. Douglas County

- Index: 0.206
- Total population: 336,041
- White: 88.9% (298,665)
- Black or African American: 1.5% (4,874)
- American Indian and Alaska Native: 0.4% (1,270)
- Asian: 4.8% (16,079)
- Native Hawaiian and other Pacific Islander: 0.1% (272)
- 2 or more races: 3.0% (9,958)
- Some other Race: 1.5% (4,923)
#18. Conejos County

Jeffrey Beall // Wikimedia Commons

33 / 50

#18. Conejos County

- Index: 0.208
- Total population: 8,128
- White: 88.8% (7,216)
- Black or African American: 0.5% (40)
- American Indian and Alaska Native: 2.5% (207)
- Asian: 0.2% (15)
- Native Hawaiian and other Pacific Islander: 0.3% (27)
- 2 or more races: 2.6% (209)
- Some other Race: 5.1% (414)
#17. Morgan County

Jeffrey Beall // Wikimedia Commons

34 / 50

#17. Morgan County

- Index: 0.208
- Total population: 28,517
- White: 88.8% (25,319)
- Black or African American: 3.6% (1,038)
- American Indian and Alaska Native: 0.4% (114)
- Asian: 0.5% (152)
- Native Hawaiian and other Pacific Islander: 0.2% (50)
- 2 or more races: 3.4% (982)
- Some other Race: 3.0% (862)
#16. Crowley County

Jeffrey Beall // Wikimedia Commons

35 / 50

#16. Crowley County

- Index: 0.211
- Total population: 5,754
- White: 88.6% (5,098)
- Black or African American: 3.5% (203)
- American Indian and Alaska Native: 1.4% (80)
- Asian: 0.6% (34)
- Native Hawaiian and other Pacific Islander: 0.0% (0)
- 2 or more races: 4.8% (274)
- Some other Race: 1.1% (65)

You may also like: Highest scoring NBA players born in Colorado

#15. Costilla County

Jeffrey Beall // Wikimedia Commons

36 / 50

#15. Costilla County

- Index: 0.215
- Total population: 3,745
- White: 88.4% (3,311)
- Black or African American: 0.4% (14)
- American Indian and Alaska Native: 2.1% (79)
- Asian: 1.3% (48)
- Native Hawaiian and other Pacific Islander: 0.0% (0)
- 2 or more races: 4.0% (148)
- Some other Race: 3.9% (145)
#14. La Plata County

Canva

37 / 50

#14. La Plata County

- Index: 0.221
- Total population: 55,617
- White: 88.0% (48,924)
- Black or African American: 0.5% (276)
- American Indian and Alaska Native: 6.6% (3,663)
- Asian: 0.7% (406)
- Native Hawaiian and other Pacific Islander: 0.0% (4)
- 2 or more races: 2.3% (1,298)
- Some other Race: 1.9% (1,046)
#13. Mineral County

Canva

38 / 50

#13. Mineral County

- Index: 0.232
- Total population: 824
- White: 87.4% (720)
- Black or African American: 1.1% (9)
- American Indian and Alaska Native: 1.5% (12)
- Asian: 0.5% (4)
- Native Hawaiian and other Pacific Islander: 0.0% (0)
- 2 or more races: 4.4% (36)
- Some other Race: 5.2% (43)
#12. Garfield County

GSpics // Wikimedia Commons

39 / 50

#12. Garfield County

- Index: 0.249
- Total population: 59,055
- White: 86.1% (50,833)
- Black or African American: 0.5% (286)
- American Indian and Alaska Native: 0.7% (400)
- Asian: 0.9% (532)
- Native Hawaiian and other Pacific Islander: 0.1% (30)
- 2 or more races: 1.9% (1,131)
- Some other Race: 9.9% (5,843)
#11. Alamosa County

Milan Suvajac // Wikimedia Commons

40 / 50

#11. Alamosa County

- Index: 0.249
- Total population: 16,107
- White: 86.4% (13,918)
- Black or African American: 0.9% (144)
- American Indian and Alaska Native: 3.3% (534)
- Asian: 1.3% (213)
- Native Hawaiian and other Pacific Islander: 0.5% (74)
- 2 or more races: 2.7% (441)
- Some other Race: 4.9% (783)

You may also like: Cities with the most expensive homes in Colorado

#10. Broomfield County

Canva

41 / 50

#10. Broomfield County

- Index: 0.249
- Total population: 67,886
- White: 86.3% (58,579)
- Black or African American: 1.3% (875)
- American Indian and Alaska Native: 0.4% (298)
- Asian: 6.5% (4,420)
- Native Hawaiian and other Pacific Islander: 0.0% (0)
- 2 or more races: 3.6% (2,443)
- Some other Race: 1.9% (1,271)
#9. Lake County

Daniel Schwen // Wikimedia Commons

42 / 50

#9. Lake County

- Index: 0.260
- Total population: 7,751
- White: 85.3% (6,614)
- Black or African American: 0.1% (9)
- American Indian and Alaska Native: 1.5% (118)
- Asian: 0.8% (65)
- Native Hawaiian and other Pacific Islander: 0.0% (3)
- 2 or more races: 1.6% (126)
- Some other Race: 10.5% (816)
#8. Las Animas County

Jeffrey Beall // Wikimedia Commons

43 / 50

#8. Las Animas County

- Index: 0.273
- Total population: 14,266
- White: 84.9% (12,111)
- Black or African American: 0.9% (125)
- American Indian and Alaska Native: 3.8% (544)
- Asian: 1.0% (137)
- Native Hawaiian and other Pacific Islander: 0.0% (0)
- 2 or more races: 5.2% (746)
- Some other Race: 4.2% (603)
#7. Archuleta County

Milan Suvajac // Wikimedia Commons

44 / 50

#7. Archuleta County

- Index: 0.283
- Total population: 13,253
- White: 84.0% (11,136)
- Black or African American: 1.7% (230)
- American Indian and Alaska Native: 1.4% (184)
- Asian: 1.0% (126)
- Native Hawaiian and other Pacific Islander: 0.1% (15)
- 2 or more races: 1.5% (194)
- Some other Race: 10.3% (1,368)
#6. Adams County

Bdearthco // Wikimedia Commons

45 / 50

#6. Adams County

- Index: 0.327
- Total population: 504,108
- White: 81.6% (411,153)
- Black or African American: 3.4% (17,014)
- American Indian and Alaska Native: 1.1% (5,526)
- Asian: 4.0% (19,930)
- Native Hawaiian and other Pacific Islander: 0.1% (584)
- 2 or more races: 4.3% (21,861)
- Some other Race: 5.6% (28,040)

You may also like: Hottest Septembers in Colorado since 1895

#5. Montezuma County

Jeffrey Beall // Wikimedia Commons

46 / 50

#5. Montezuma County

- Index: 0.328
- Total population: 26,031
- White: 81.0% (21,077)
- Black or African American: 0.3% (72)
- American Indian and Alaska Native: 12.3% (3,193)
- Asian: 0.8% (196)
- Native Hawaiian and other Pacific Islander: 0.1% (17)
- 2 or more races: 2.1% (536)
- Some other Race: 3.6% (940)
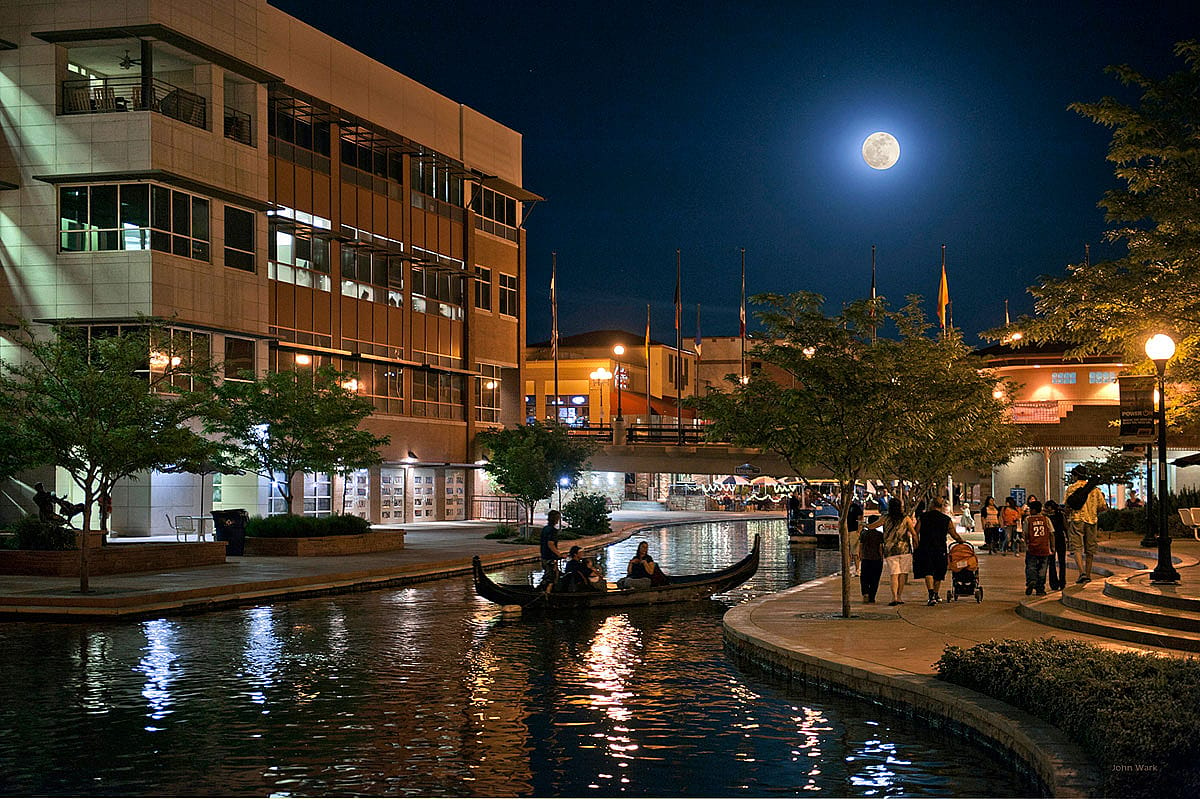
#4. Pueblo County

John Wark // Wikicommons

47 / 50

#4. Pueblo County

- Index: 0.342
- Total population: 165,982
- White: 80.4% (133,497)
- Black or African American: 2.1% (3,494)
- American Indian and Alaska Native: 4.0% (6,688)
- Asian: 0.9% (1,489)
- Native Hawaiian and other Pacific Islander: 0.1% (170)
- 2 or more races: 4.0% (6,681)
- Some other Race: 8.4% (13,963)
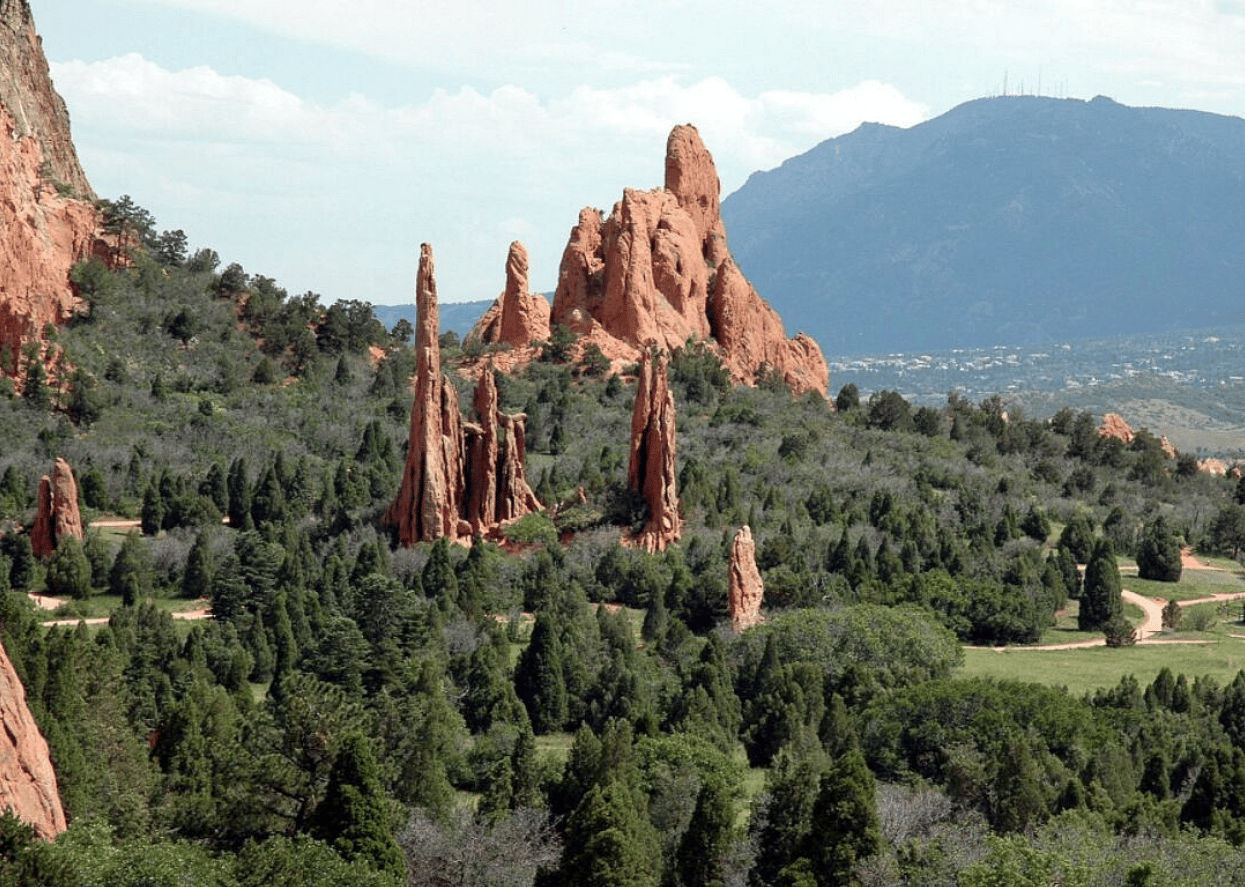
#3. El Paso County

Robert Corby // Wikimedia Commons

48 / 50

#3. El Paso County

- Index: 0.357
- Total population: 698,974
- White: 79.6% (556,174)
- Black or African American: 6.4% (44,801)
- American Indian and Alaska Native: 0.8% (5,377)
- Asian: 2.8% (19,567)
- Native Hawaiian and other Pacific Islander: 0.4% (2,744)
- 2 or more races: 6.0% (41,765)
- Some other Race: 4.1% (28,546)
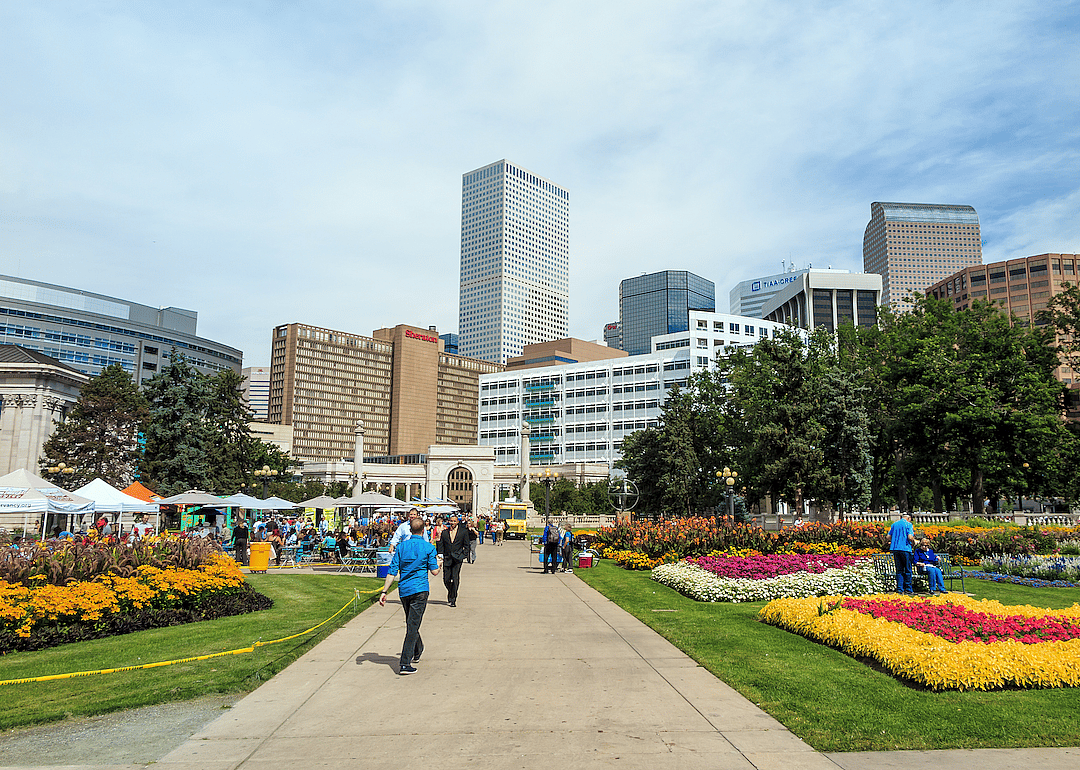
#2. Denver County

f11photo // Shutterstock

49 / 50

#2. Denver County

- Index: 0.406
- Total population: 705,576
- White: 76.1% (537,029)
- Black or African American: 9.2% (65,215)
- American Indian and Alaska Native: 0.9% (6,144)
- Asian: 3.7% (26,156)
- Native Hawaiian and other Pacific Islander: 0.2% (1,176)
- 2 or more races: 3.8% (26,636)
- Some other Race: 6.1% (43,220)
#1. Arapahoe County

Mountain Mike Johans // Wikimedia Commons

50 / 50

#1. Arapahoe County

- Index: 0.467
- Total population: 644,560
- White: 71.5% (461,113)
- Black or African American: 10.8% (69,853)
- American Indian and Alaska Native: 0.7% (4,482)
- Asian: 6.0% (38,957)
- Native Hawaiian and other Pacific Islander: 0.2% (1,464)
- 2 or more races: 4.5% (28,821)
- Some other Race: 6.2% (39,870)

You may also like: Coldest Octobers in Colorado since 1895