Rain, sleet, snow, hail, wintry mix. Precipitation takes on many forms, and the degree to which climate change affects precipitation levels comes down to something almost everyone learns about in school—Earth's water cycle. A system in endless motion, the water cycle traces the process through which water exists in its three primary phases—liquid, solid, and gas—as it moves perpetually between the Earth and its atmosphere.
Increases in precipitation frequency and intensity are markers of climate change. When temperatures rise and oceans grow warmer, the amount of water that evaporates into the atmosphere—and the speed at which it does so—also increases. As atmospheric circulation carries the moisture-rich air over land or pushes it into a storm system, heavy rain or snow is often the result.
The continental U.S. on average received about 30 inches of precipitation between March 2022 and February 2023. Traditionally "wet" regions—such as Washington state and Alaska in the northwest and Georgia and Mississippi in the southeast—continue to have some of the rainiest counties in the United States. Other areas such as Oklahoma, Kansas, and Nebraska, as well as pockets of the South and of California, experience the opposite extreme: drought, also largely a product of climate change.
Stacker cited data from the National Centers for Environmental Information to identify the counties in Florida that receive the most precipitation through rain, sleet, or snow. Counties are ranked by five-year precipitation averages in inches as of February 2023 with rainfall over the past year serving as a tiebreaker. Supplementary data on how last year's precipitation compares to the 100-year average for the area is also included.
You may also like: Most popular diamond shapes in the South
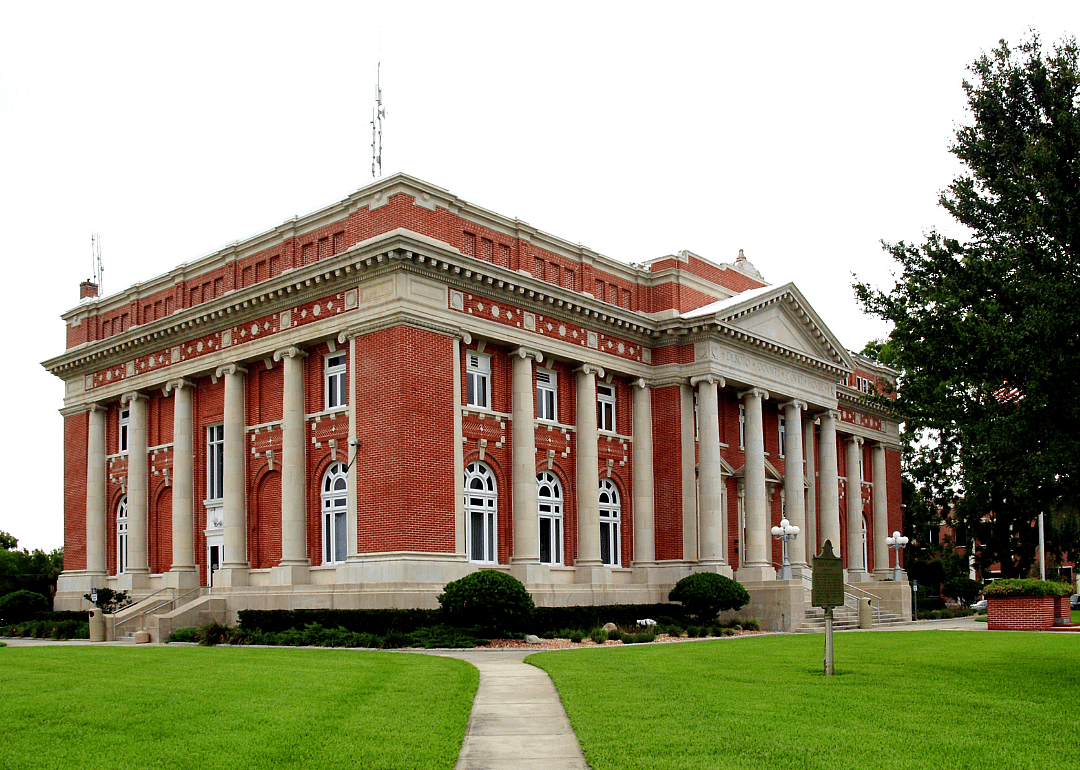
#50. Polk County
- Five-year precipitation average: 53.70 inches
- Precipitation over the past year: 56.12 inches (#94 rainiest year since 1895)
- Precipitation compared to 1901-2000 average: 4.23 inches above norm
#49. DeSoto County
- Five-year precipitation average: 53.72 inches
- Precipitation over the past year: 58.12 inches (#101 rainiest year since 1895)
- Precipitation compared to 1901-2000 average: 6.65 inches above norm
Creative Couple Media // Shutterstock
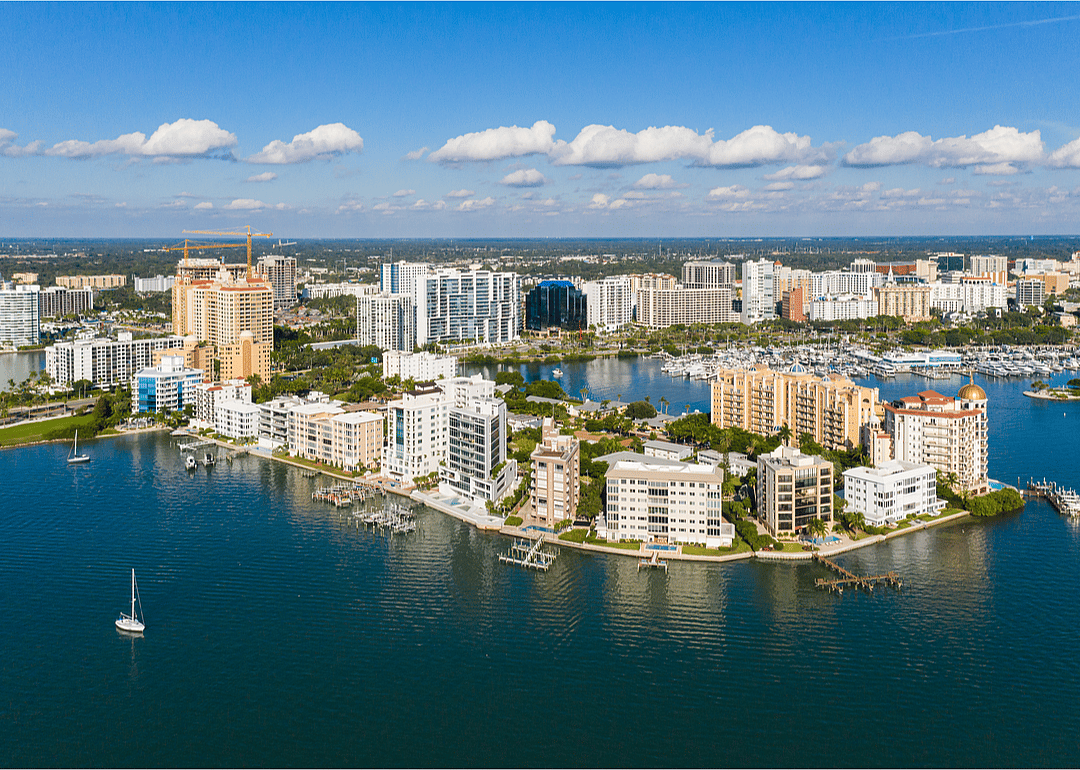
3 / 50#48. Sarasota County
- Five-year precipitation average: 53.73 inches
- Precipitation over the past year: 60.91 inches (#108 rainiest year since 1895)
- Precipitation compared to 1901-2000 average: 8.71 inches above norm
Brittx // Shutterstock
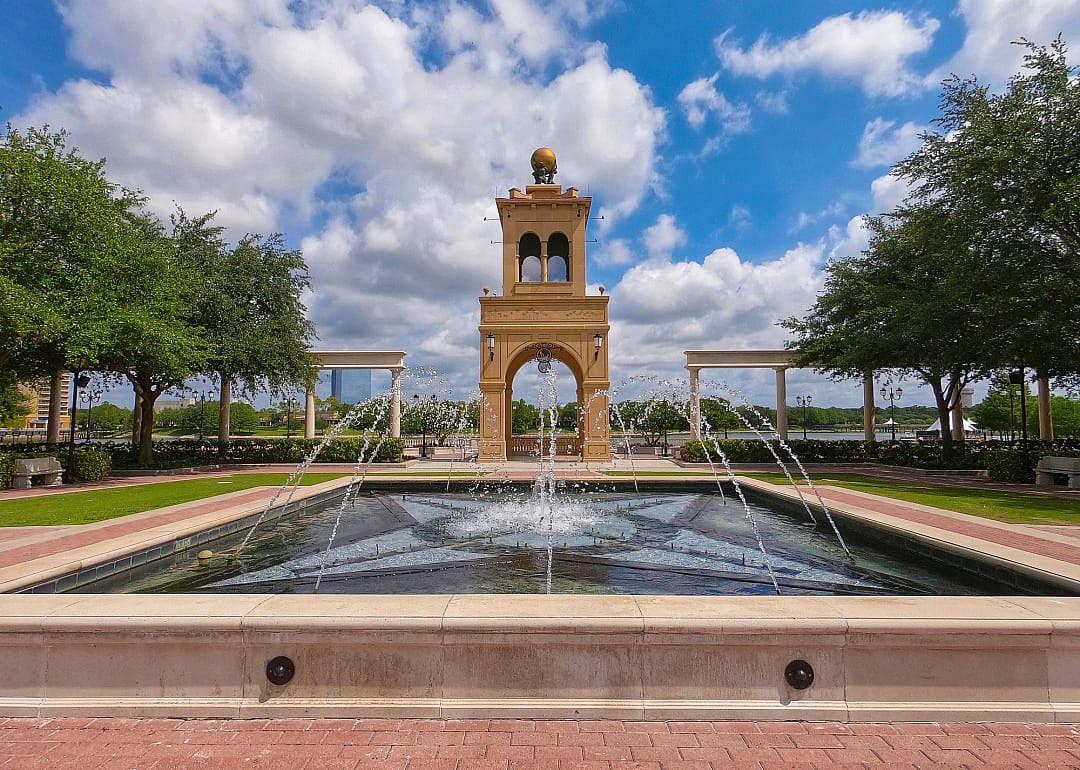
4 / 50#47. Seminole County
- Five-year precipitation average: 53.78 inches
- Precipitation over the past year: 60.46 inches (#113 rainiest year since 1895)
- Precipitation compared to 1901-2000 average: 9.76 inches above norm
Roberto Galan // Shutterstock
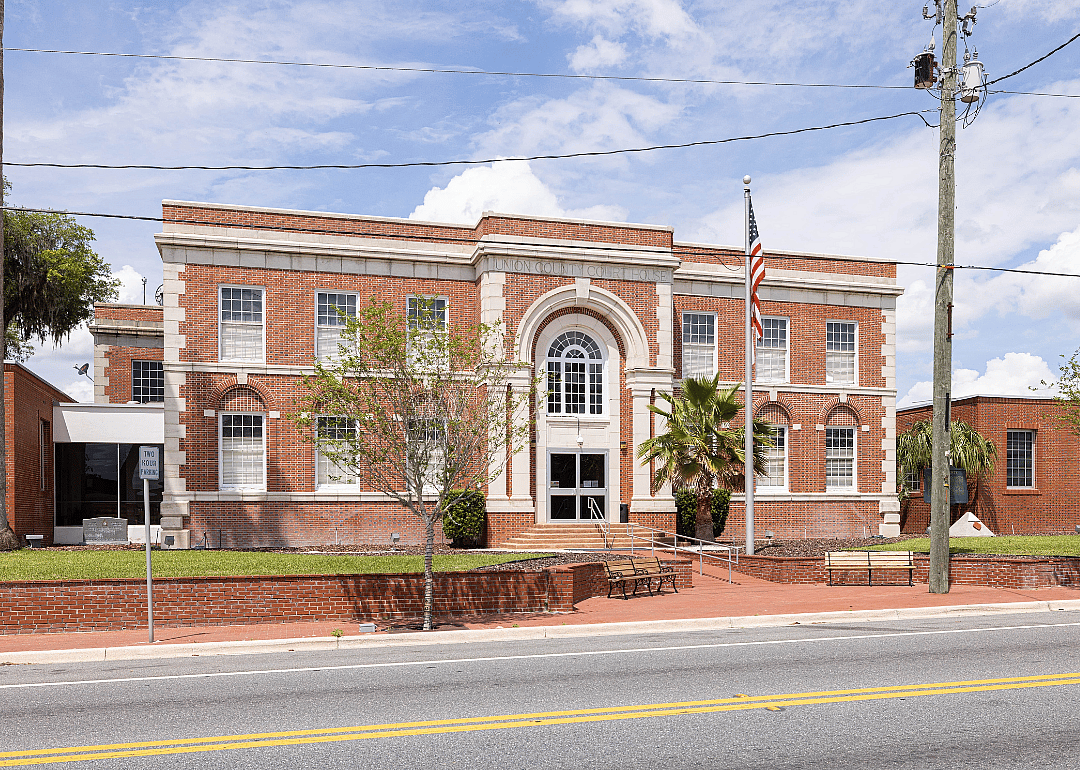
5 / 50#46. Union County
- Five-year precipitation average: 53.85 inches
- Precipitation over the past year: 56.30 inches (#93 rainiest year since 1895)
- Precipitation compared to 1901-2000 average: 4.52 inches above norm
You may also like: Richest billionaires in Florida
#45. Sumter County
- Five-year precipitation average: 53.89 inches
- Precipitation over the past year: 54.11 inches (#86 rainiest year since 1895)
- Precipitation compared to 1901-2000 average: 1.63 inches above norm
#44. St. Johns County
- Five-year precipitation average: 53.91 inches
- Precipitation over the past year: 53.16 inches (#76 rainiest year since 1895)
- Precipitation compared to 1901-2000 average: 2.09 inches above norm
#43. Manatee County
- Five-year precipitation average: 53.94 inches
- Precipitation over the past year: 58.19 inches (#95 rainiest year since 1895)
- Precipitation compared to 1901-2000 average: 5.52 inches above norm
#42. Pinellas County
- Five-year precipitation average: 54.03 inches
- Precipitation over the past year: 52.70 inches (#73 rainiest year since 1895)
- Precipitation compared to 1901-2000 average: 0.99 inches above norm
JFFC // Shutterstock
10 / 50#41. Clay County
- Five-year precipitation average: 54.34 inches
- Precipitation over the past year: 53.56 inches (#78 rainiest year since 1895)
- Precipitation compared to 1901-2000 average: 1.61 inches above norm
You may also like: Fastest-growing jobs in Florida
#40. Volusia County
- Five-year precipitation average: 54.46 inches
- Precipitation over the past year: 56.61 inches (#96 rainiest year since 1895)
- Precipitation compared to 1901-2000 average: 5.55 inches above norm
#39. Suwannee County
- Five-year precipitation average: 54.84 inches
- Precipitation over the past year: 50.94 inches (#53 rainiest year since 1895)
- Precipitation compared to 1901-2000 average: -2.28 inches below norm
#38. Charlotte County
- Five-year precipitation average: 54.91 inches
- Precipitation over the past year: 58.45 inches (#108 rainiest year since 1895)
- Precipitation compared to 1901-2000 average: 7.48 inches above norm
#37. St. Lucie County
- Five-year precipitation average: 54.94 inches
- Precipitation over the past year: 53.27 inches (#70 rainiest year since 1895)
- Precipitation compared to 1901-2000 average: 0.33 inches above norm
#36. Hernando County
- Five-year precipitation average: 55.01 inches
- Precipitation over the past year: 50.17 inches (#45 rainiest year since 1895)
- Precipitation compared to 1901-2000 average: -3.48 inches below norm
You may also like: Best public colleges in Florida
Nadezda Murmakova // Shutterstock
16 / 50#35. Lee County
- Five-year precipitation average: 55.08 inches
- Precipitation over the past year: 60.27 inches (#111 rainiest year since 1895)
- Precipitation compared to 1901-2000 average: 10.15 inches above norm
Victoria1988 // Shutterstock
17 / 50#34. Bradford County
- Five-year precipitation average: 55.08 inches
- Precipitation over the past year: 56.50 inches (#87 rainiest year since 1895)
- Precipitation compared to 1901-2000 average: 4.13 inches above norm
#33. Madison County
- Five-year precipitation average: 55.29 inches
- Precipitation over the past year: 51.00 inches (#56 rainiest year since 1895)
- Precipitation compared to 1901-2000 average: -2.67 inches below norm
#32. Pasco County
- Five-year precipitation average: 55.34 inches
- Precipitation over the past year: 53.09 inches (#71 rainiest year since 1895)
- Precipitation compared to 1901-2000 average: -0.09 inches below norm
#31. Marion County
- Five-year precipitation average: 55.36 inches
- Precipitation over the past year: 54.23 inches (#77 rainiest year since 1895)
- Precipitation compared to 1901-2000 average: 1.35 inches above norm
You may also like: Best counties to retire to in Florida
#30. Martin County
- Five-year precipitation average: 55.44 inches
- Precipitation over the past year: 50.22 inches (#43 rainiest year since 1895)
- Precipitation compared to 1901-2000 average: -4.01 inches below norm
#29. Hillsborough County
- Five-year precipitation average: 55.80 inches
- Precipitation over the past year: 56.50 inches (#90 rainiest year since 1895)
- Precipitation compared to 1901-2000 average: 4.03 inches above norm
#28. Gadsden County
- Five-year precipitation average: 56.30 inches
- Precipitation over the past year: 52.40 inches (#45 rainiest year since 1895)
- Precipitation compared to 1901-2000 average: -4.28 inches below norm
#27. Jefferson County
- Five-year precipitation average: 56.31 inches
- Precipitation over the past year: 54.46 inches (#65 rainiest year since 1895)
- Precipitation compared to 1901-2000 average: -0.72 inches below norm
#26. Leon County
- Five-year precipitation average: 56.37 inches
- Precipitation over the past year: 56.65 inches (#62 rainiest year since 1895)
- Precipitation compared to 1901-2000 average: -0.72 inches below norm
You may also like: Coldest Septembers in Florida since 1895
#25. Levy County
- Five-year precipitation average: 56.40 inches
- Precipitation over the past year: 48.02 inches (#36 rainiest year since 1895)
- Precipitation compared to 1901-2000 average: -5.06 inches below norm
#24. Palm Beach County
- Five-year precipitation average: 56.44 inches
- Precipitation over the past year: 49.77 inches (#28 rainiest year since 1895)
- Precipitation compared to 1901-2000 average: -7.25 inches below norm
#23. Miami-Dade County
- Five-year precipitation average: 56.51 inches
- Precipitation over the past year: 55.98 inches (#71 rainiest year since 1895)
- Precipitation compared to 1901-2000 average: 0.75 inches above norm
#22. Putnam County
- Five-year precipitation average: 56.75 inches
- Precipitation over the past year: 55.82 inches (#79 rainiest year since 1895)
- Precipitation compared to 1901-2000 average: 2.58 inches above norm
#21. Wakulla County
- Five-year precipitation average: 57.27 inches
- Precipitation over the past year: 58.98 inches (#72 rainiest year since 1895)
- Precipitation compared to 1901-2000 average: 0.66 inches above norm
You may also like: Coldest Decembers in Florida since 1895
#20. Citrus County
- Five-year precipitation average: 57.37 inches
- Precipitation over the past year: 52.78 inches (#69 rainiest year since 1895)
- Precipitation compared to 1901-2000 average: -0.65 inches below norm
#19. Collier County
- Five-year precipitation average: 57.46 inches
- Precipitation over the past year: 59.39 inches (#104 rainiest year since 1895)
- Precipitation compared to 1901-2000 average: 7.19 inches above norm
#18. Alachua County
- Five-year precipitation average: 58.07 inches
- Precipitation over the past year: 56.27 inches (#87 rainiest year since 1895)
- Precipitation compared to 1901-2000 average: 3.59 inches above norm
#17. Lafayette County
- Five-year precipitation average: 58.21 inches
- Precipitation over the past year: 50.01 inches (#46 rainiest year since 1895)
- Precipitation compared to 1901-2000 average: -4.47 inches below norm
#15. Gilchrist County
- Five-year precipitation average: 58.49 inches
- Precipitation over the past year: 49.47 inches (#45 rainiest year since 1895)
- Precipitation compared to 1901-2000 average: -3.35 inches below norm
#14. Jackson County
- Five-year precipitation average: 59.11 inches
- Precipitation over the past year: 52.40 inches (#52 rainiest year since 1895)
- Precipitation compared to 1901-2000 average: -2.39 inches below norm
SevenMaps // Shutterstock
38 / 50#13. Liberty County
- Five-year precipitation average: 59.33 inches
- Precipitation over the past year: 58.50 inches (#67 rainiest year since 1895)
- Precipitation compared to 1901-2000 average: -0.46 inches below norm
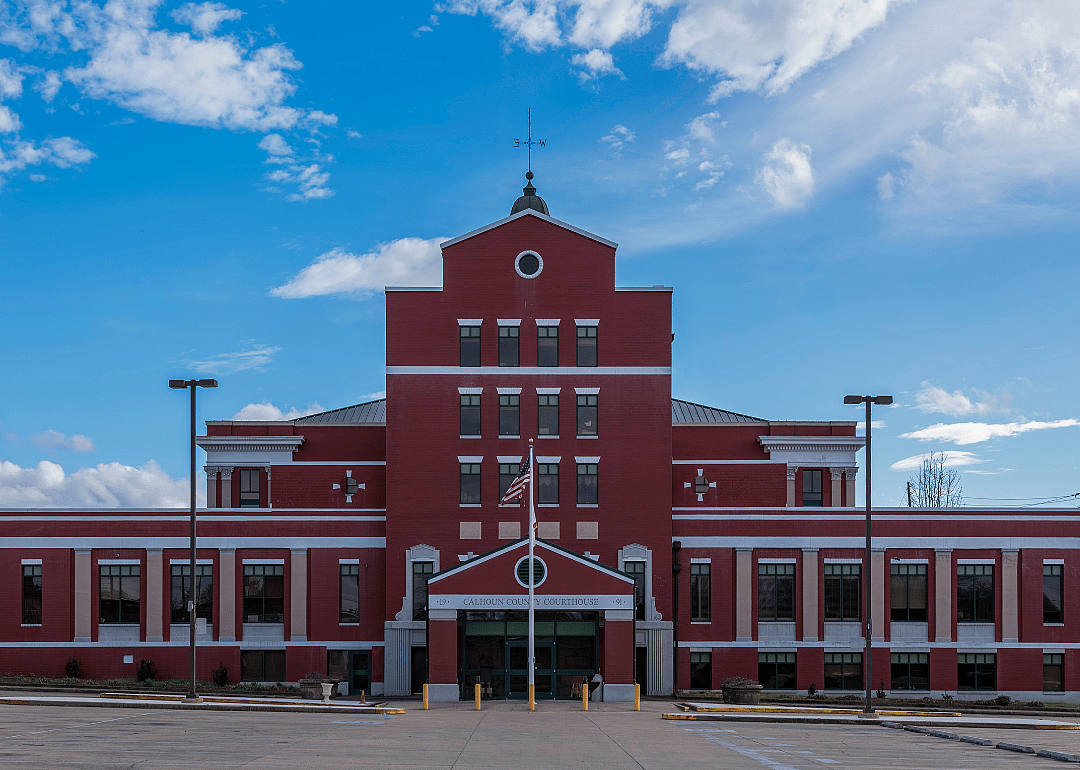
#12. Calhoun County
- Five-year precipitation average: 59.56 inches
- Precipitation over the past year: 55.43 inches (#56 rainiest year since 1895)
- Precipitation compared to 1901-2000 average: -2.80 inches below norm
#11. Franklin County
- Five-year precipitation average: 60.17 inches
- Precipitation over the past year: 63.95 inches (#97 rainiest year since 1895)
- Precipitation compared to 1901-2000 average: 5.58 inches above norm
You may also like: Counties with the oldest homes in Florida
#10. Bay County
- Five-year precipitation average: 60.67 inches
- Precipitation over the past year: 56.72 inches (#59 rainiest year since 1895)
- Precipitation compared to 1901-2000 average: -1.89 inches below norm
#9. Gulf County
- Five-year precipitation average: 60.80 inches
- Precipitation over the past year: 62.27 inches (#86 rainiest year since 1895)
- Precipitation compared to 1901-2000 average: 3.65 inches above norm
#8. Dixie County
- Five-year precipitation average: 60.97 inches
- Precipitation over the past year: 48.32 inches (#40 rainiest year since 1895)
- Precipitation compared to 1901-2000 average: -5.45 inches below norm
#7. Broward County
- Five-year precipitation average: 61.17 inches
- Precipitation over the past year: 58.08 inches (#69 rainiest year since 1895)
- Precipitation compared to 1901-2000 average: 0.92 inches above norm
Terry Kelly // Shutterstock
45 / 50Susan C. Brown // Shutterstock
46 / 50#5. Holmes County
- Five-year precipitation average: 63.01 inches
- Precipitation over the past year: 55.55 inches (#55 rainiest year since 1895)
- Precipitation compared to 1901-2000 average: -2.27 inches below norm
#4. Santa Rosa County
- Five-year precipitation average: 64.35 inches
- Precipitation over the past year: 58.96 inches (#48 rainiest year since 1895)
- Precipitation compared to 1901-2000 average: -3.24 inches below norm
#3. Okaloosa County
- Five-year precipitation average: 64.47 inches
- Precipitation over the past year: 57.02 inches (#47 rainiest year since 1895)
- Precipitation compared to 1901-2000 average: -3.82 inches below norm
#2. Walton County
- Five-year precipitation average: 64.47 inches
- Precipitation over the past year: 57.07 inches (#53 rainiest year since 1895)
- Precipitation compared to 1901-2000 average: -3.21 inches below norm
#1. Escambia County
- Five-year precipitation average: 66.52 inches
- Precipitation over the past year: 63.74 inches (#65 rainiest year since 1895)
- Precipitation compared to 1901-2000 average: 1.28 inches above norm
You may also like: Most common jobs 150 years ago in Florida