Stacker compiled a list of the counties with the best commutes in Indiana using data from the U.S. Census Bureau. Counties are ranked by the shortest average travel time to work, with ties broken by lowest percent of residents that commute over 60 minutes, and any further ties broken by lowest percent of residents that work outside the county of residence.
You may also like: Highest-rated Class of 2025 men's basketball recruits from Indiana
#50. Miami County
- Mean travel time to work: 24.7
- Workers with 60+ minute commute: 8.2%
- Worked outside of county of residence: 49.4%
Roberto Galan // Shutterstock
2 / 50#49. Sullivan County
- Mean travel time to work: 24.6
- Workers with 60+ minute commute: 6.5%
- Worked outside of county of residence: 41.2%
#48. Randolph County
- Mean travel time to work: 24.5
- Workers with 60+ minute commute: 6.9%
- Worked outside of county of residence: 38.6%
Roberto Galan // Shutterstock
4 / 50#47. Daviess County
- Mean travel time to work: 24.3
- Workers with 60+ minute commute: 9.2%
- Worked outside of county of residence: 31.3%
Roberto Galan // Shutterstock
5 / 50Roberto Galan // Shutterstock
6 / 50#45. Whitley County
- Mean travel time to work: 24.1
- Workers with 60+ minute commute: 4.8%
- Worked outside of county of residence: 49.5%
Roberto Galan // Shutterstock
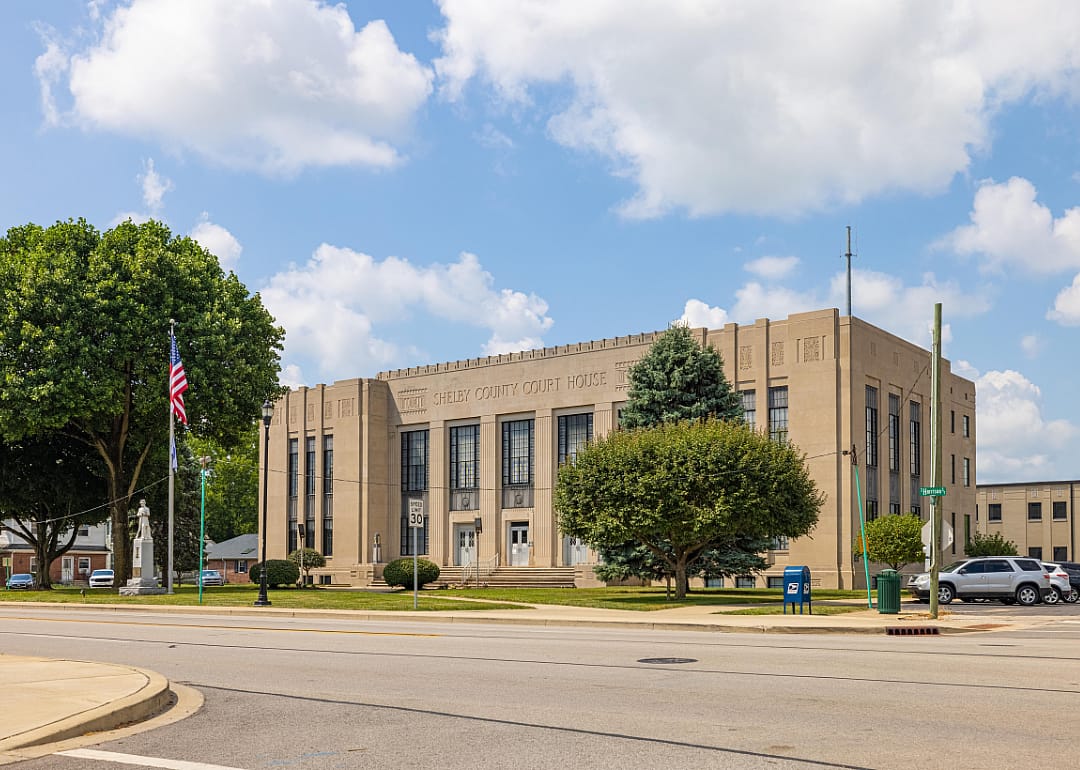
7 / 50#44. Shelby County
- Mean travel time to work: 24.0
- Workers with 60+ minute commute: 5.2%
- Worked outside of county of residence: 42.5%
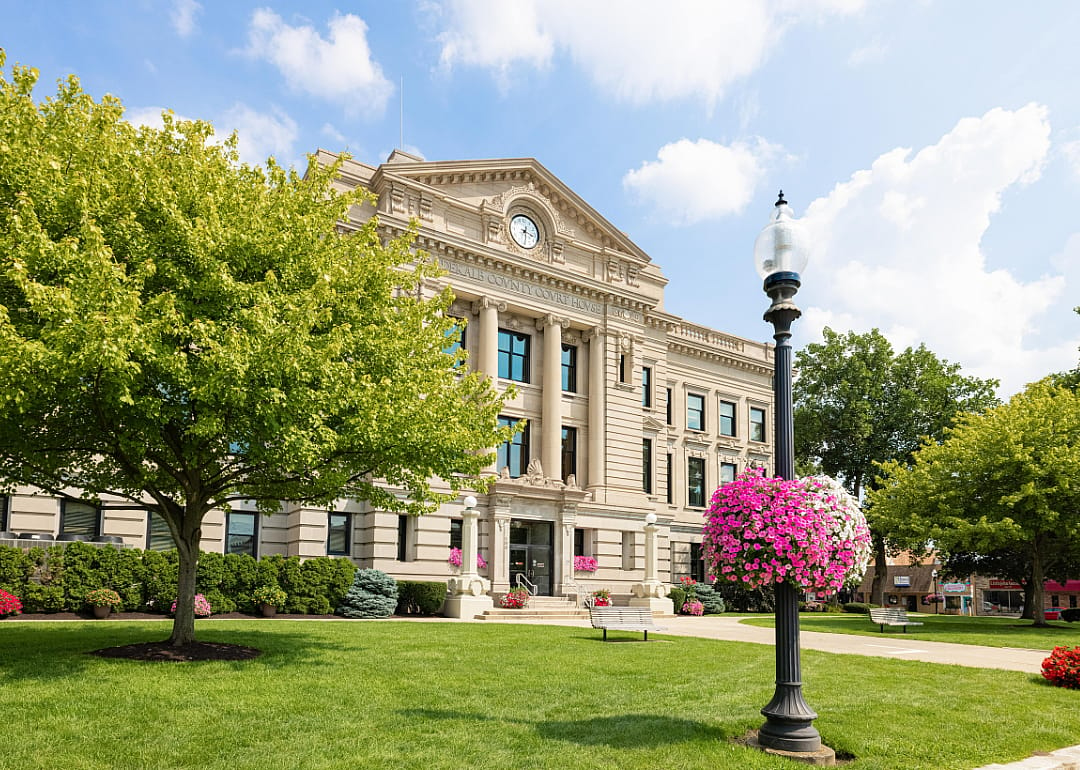
#43. LaPorte County
- Mean travel time to work: 23.9
- Workers with 60+ minute commute: 7.3%
- Worked outside of county of residence: 24.9%
Sean Pavone // Shutterstock
9 / 50#42. Marion County
- Mean travel time to work: 23.9
- Workers with 60+ minute commute: 4.2%
- Worked outside of county of residence: 18.8%
Roberto Galan // Shutterstock
11 / 50#40. Wells County
- Mean travel time to work: 23.8
- Workers with 60+ minute commute: 4.5%
- Worked outside of county of residence: 44.9%
#39. Jefferson County
- Mean travel time to work: 23.7
- Workers with 60+ minute commute: 7.3%
- Worked outside of county of residence: 17.0%
Kenneth Keifer // Shutterstock
13 / 50#38. Fountain County
- Mean travel time to work: 23.7
- Workers with 60+ minute commute: 4.4%
- Worked outside of county of residence: 40.6%
#37. Perry County
- Mean travel time to work: 23.6
- Workers with 60+ minute commute: 8.7%
- Worked outside of county of residence: 30.4%
#35. Fulton County
- Mean travel time to work: 23.4
- Workers with 60+ minute commute: 7.5%
- Worked outside of county of residence: 45.4%
Felix Mizioznikov // Shutterstock
17 / 50#34. White County
- Mean travel time to work: 23.4
- Workers with 60+ minute commute: 6.0%
- Worked outside of county of residence: 38.9%
Henryk Sadura // Shutterstock
18 / 50#33. Marshall County
- Mean travel time to work: 23.3
- Workers with 60+ minute commute: 6.2%
- Worked outside of county of residence: 37.0%
shutter_breaker // Shutterstock
19 / 50#32. Scott County
- Mean travel time to work: 23.3
- Workers with 60+ minute commute: 4.7%
- Worked outside of county of residence: 34.3%
#30. LaGrange County
- Mean travel time to work: 23.0
- Workers with 60+ minute commute: 6.7%
- Worked outside of county of residence: 36.2%
Roberto Galan // Shutterstock
22 / 50#29. Blackford County
- Mean travel time to work: 23.0
- Workers with 60+ minute commute: 4.9%
- Worked outside of county of residence: 53.8%
#28. Floyd County
- Mean travel time to work: 23.0
- Workers with 60+ minute commute: 3.0%
- Worked outside of county of residence: 23.8%
#27. Jackson County
- Mean travel time to work: 22.8
- Workers with 60+ minute commute: 6.9%
- Worked outside of county of residence: 25.7%
Roberto Galan // Shutterstock
26 / 50#25. Steuben County
- Mean travel time to work: 22.1
- Workers with 60+ minute commute: 6.9%
- Worked outside of county of residence: 27.0%
#24. Montgomery County
- Mean travel time to work: 22.1
- Workers with 60+ minute commute: 6.5%
- Worked outside of county of residence: 25.7%
Roberto Galan // Shutterstock
28 / 50#23. Huntington County
- Mean travel time to work: 22.1
- Workers with 60+ minute commute: 4.5%
- Worked outside of county of residence: 37.8%
#22. Allen County
- Mean travel time to work: 21.8
- Workers with 60+ minute commute: 4.2%
- Worked outside of county of residence: 10.5%
#21. Clinton County
- Mean travel time to work: 21.5
- Workers with 60+ minute commute: 3.3%
- Worked outside of county of residence: 41.7%
You may also like: Best private colleges in Indiana
#20. Cass County
- Mean travel time to work: 21.3
- Workers with 60+ minute commute: 4.9%
- Worked outside of county of residence: 33.7%
#19. Wabash County
- Mean travel time to work: 21.3
- Workers with 60+ minute commute: 4.5%
- Worked outside of county of residence: 32.8%
#18. Grant County
- Mean travel time to work: 21.2
- Workers with 60+ minute commute: 6.6%
- Worked outside of county of residence: 20.3%
#17. St. Joseph County
- Mean travel time to work: 21.2
- Workers with 60+ minute commute: 3.4%
- Worked outside of county of residence: 15.1%
Roberto Galan // Shutterstock
35 / 50#15. Adams County
- Mean travel time to work: 20.9
- Workers with 60+ minute commute: 7.1%
- Worked outside of county of residence: 25.7%
Roberto Galan // Shutterstock
37 / 50#14. Delaware County
- Mean travel time to work: 20.9
- Workers with 60+ minute commute: 6.3%
- Worked outside of county of residence: 19.5%
#13. Gibson County
- Mean travel time to work: 20.9
- Workers with 60+ minute commute: 2.9%
- Worked outside of county of residence: 29.5%
#12. Wayne County
- Mean travel time to work: 20.4
- Workers with 60+ minute commute: 6.0%
- Worked outside of county of residence: 11.3%
Roberto Galan // Shutterstock
40 / 50#10. Knox County
- Mean travel time to work: 20.2
- Workers with 60+ minute commute: 5.7%
- Worked outside of county of residence: 17.6%
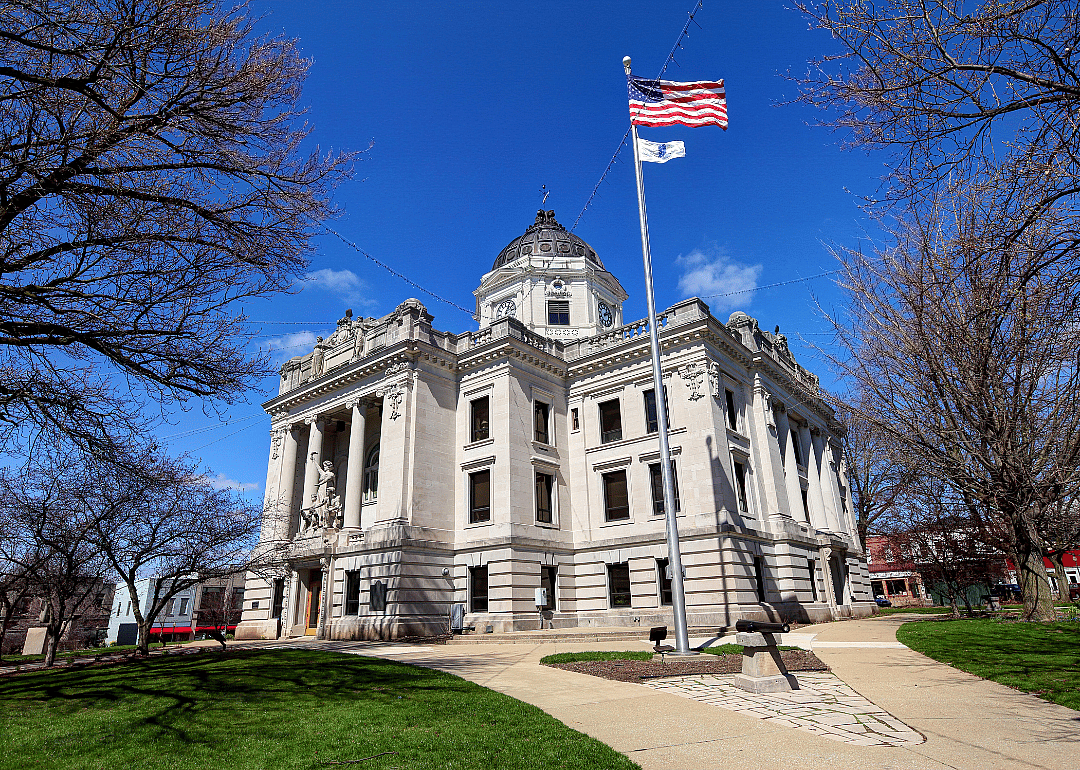
#9. Monroe County
- Mean travel time to work: 20.1
- Workers with 60+ minute commute: 5.6%
- Worked outside of county of residence: 10.7%
#8. Howard County
- Mean travel time to work: 19.8
- Workers with 60+ minute commute: 6.4%
- Worked outside of county of residence: 21.2%
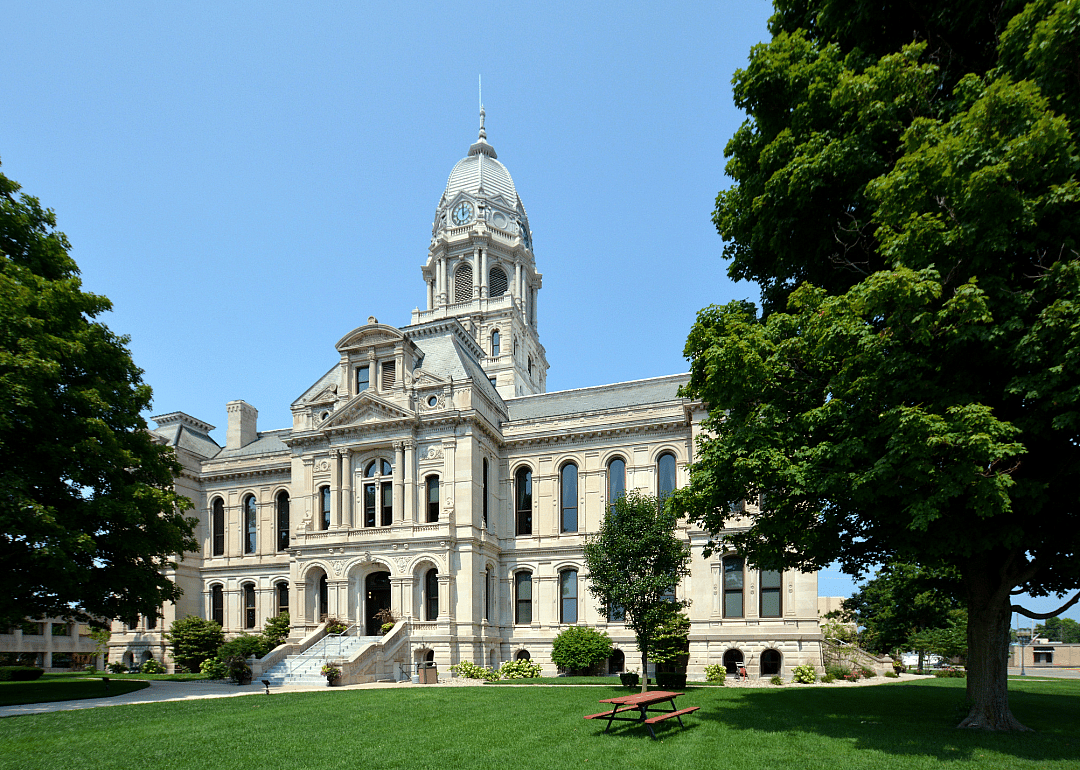
#7. Kosciusko County
- Mean travel time to work: 19.6
- Workers with 60+ minute commute: 3.9%
- Worked outside of county of residence: 23.5%
#5. Elkhart County
- Mean travel time to work: 19.4
- Workers with 60+ minute commute: 2.2%
- Worked outside of county of residence: 12.0%
#4. Vanderburgh County
- Mean travel time to work: 19.3
- Workers with 60+ minute commute: 3.5%
- Worked outside of county of residence: 14.3%
#3. Vigo County
- Mean travel time to work: 19.2
- Workers with 60+ minute commute: 4.4%
- Worked outside of county of residence: 10.8%
Roberto Galan // Shutterstock
49 / 50#2. Dubois County
- Mean travel time to work: 18.7
- Workers with 60+ minute commute: 5.7%
- Worked outside of county of residence: 11.0%