Stacker compiled a list of the counties with the best commutes in Iowa using data from the U.S. Census Bureau. Counties are ranked by the shortest average travel time to work, with ties broken by lowest percent of residents that commute over 60 minutes, and any further ties broken by lowest percent of residents that work outside the county of residence.
You may also like: Highest-rated Class of 2025 football recruits from Iowa
#50. Hancock County
- Mean travel time to work: 20.0
- Workers with 60+ minute commute: 5.1%
- Worked outside of county of residence: 35.9%
SevenMaps // Shutterstock
2 / 50#49. Adams County
- Mean travel time to work: 19.8
- Workers with 60+ minute commute: 6.3%
- Worked outside of county of residence: 41.5%
#48. Marion County
- Mean travel time to work: 19.8
- Workers with 60+ minute commute: 6.2%
- Worked outside of county of residence: 21.3%
#47. Johnson County
- Mean travel time to work: 19.8
- Workers with 60+ minute commute: 3.0%
- Worked outside of county of residence: 14.6%
SevenMaps // Shutterstock
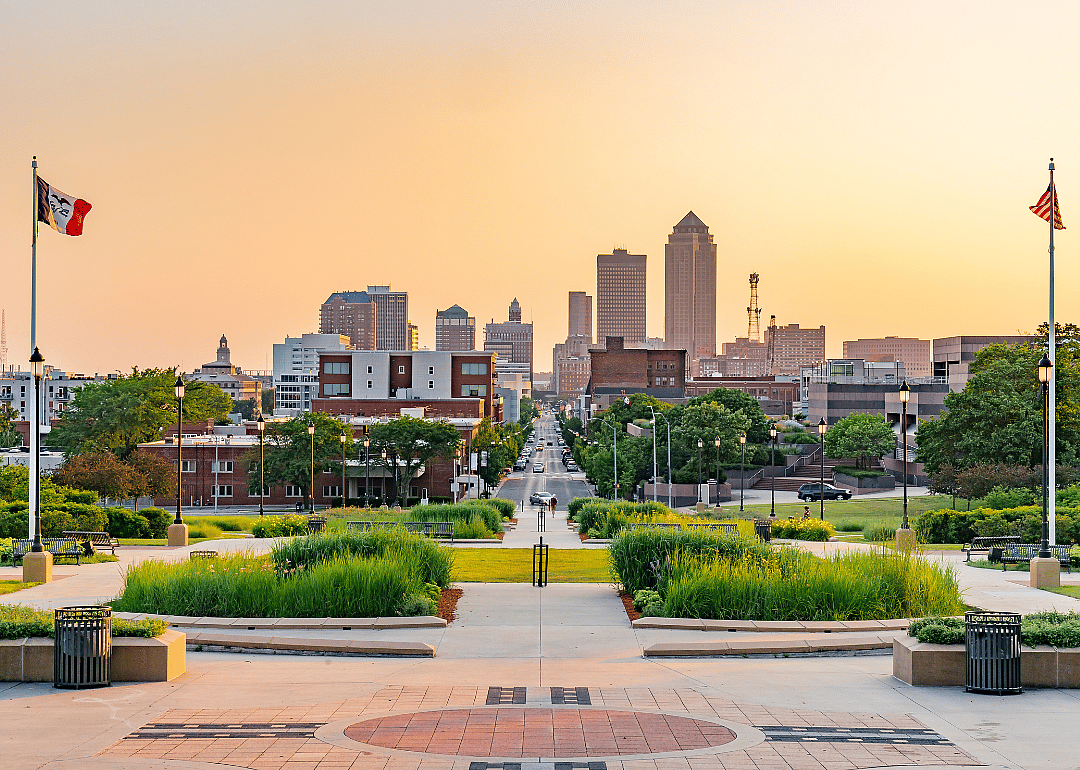
5 / 50#45. Polk County
- Mean travel time to work: 19.6
- Workers with 60+ minute commute: 2.0%
- Worked outside of county of residence: 10.9%
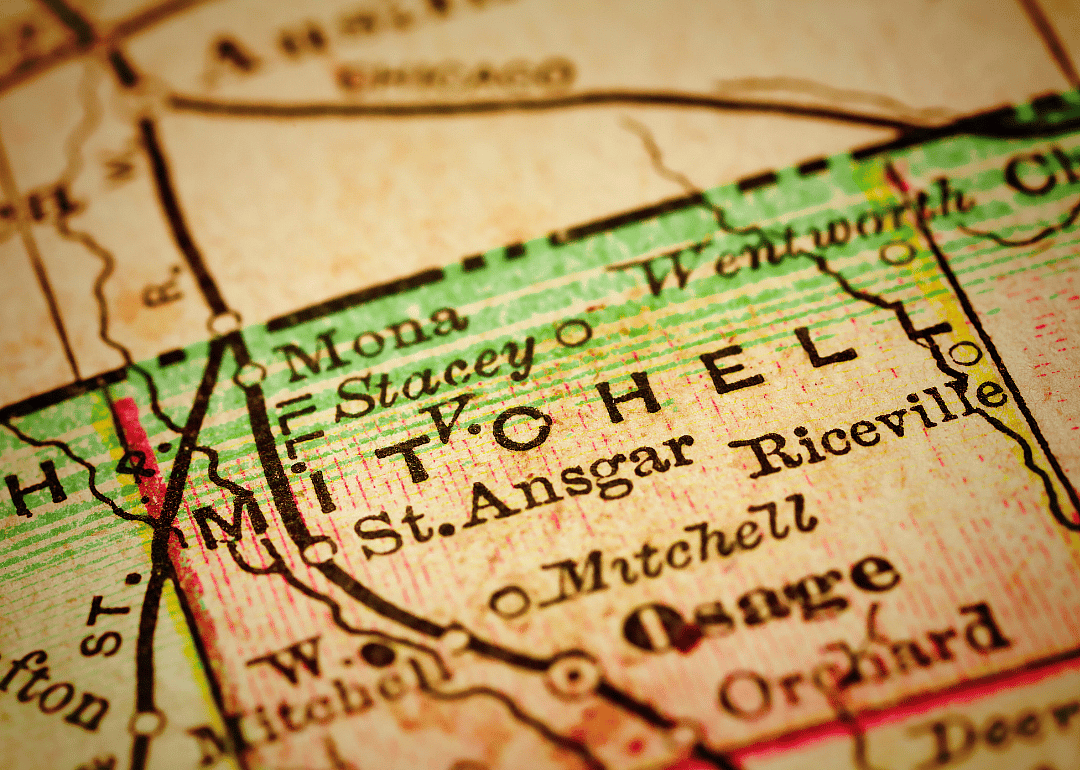
#44. Mitchell County
- Mean travel time to work: 19.5
- Workers with 60+ minute commute: 5.7%
- Worked outside of county of residence: 20.2%
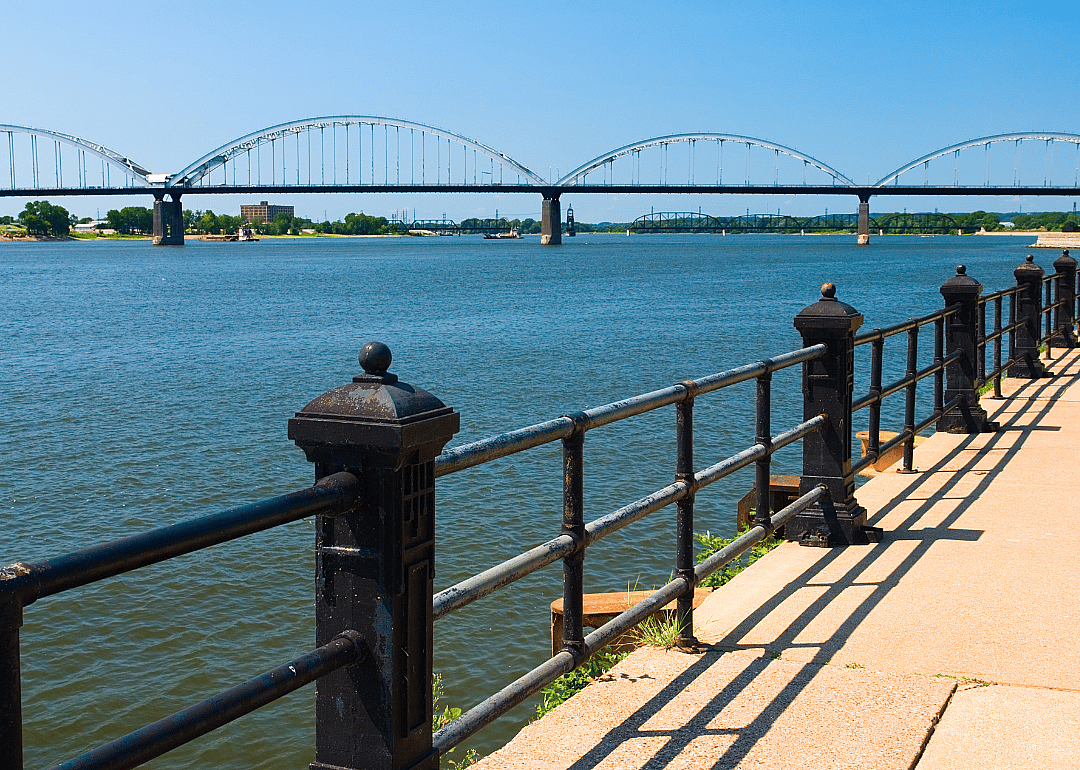
#43. Scott County
- Mean travel time to work: 19.5
- Workers with 60+ minute commute: 3.1%
- Worked outside of county of residence: 5.4%
Jacob Boomsma // Shutterstock
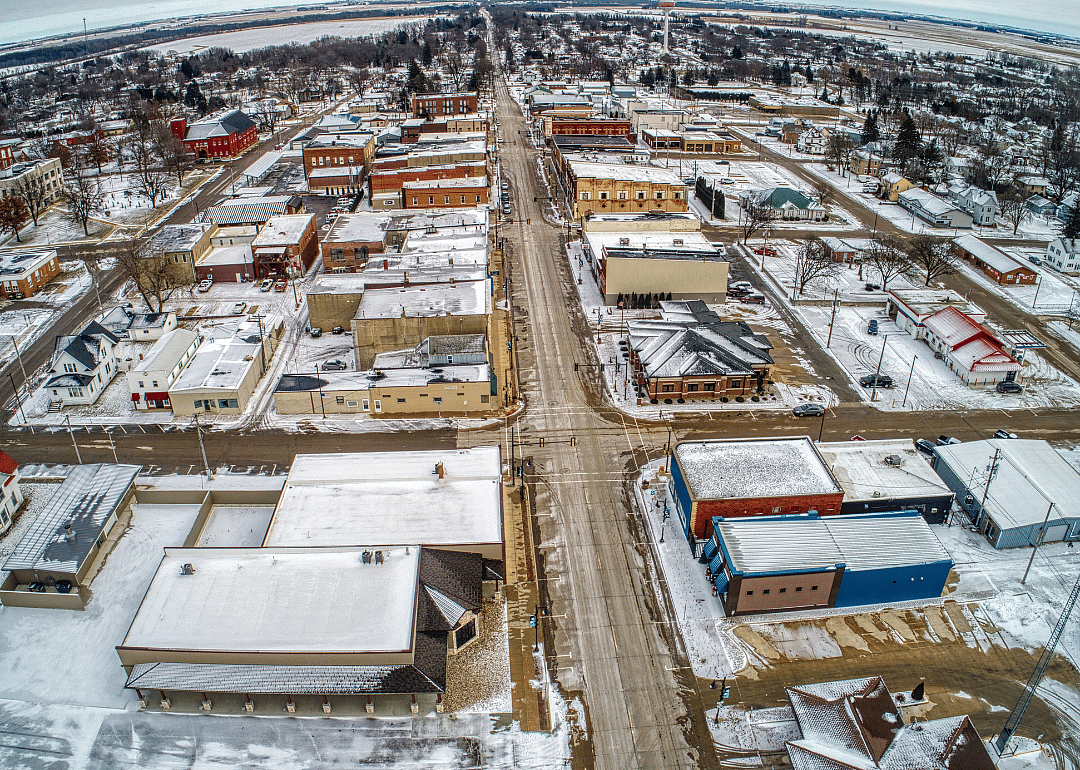
9 / 50#42. Chickasaw County
- Mean travel time to work: 19.4
- Workers with 60+ minute commute: 6.6%
- Worked outside of county of residence: 27.3%
Suzanne Tucker // Shutterstock
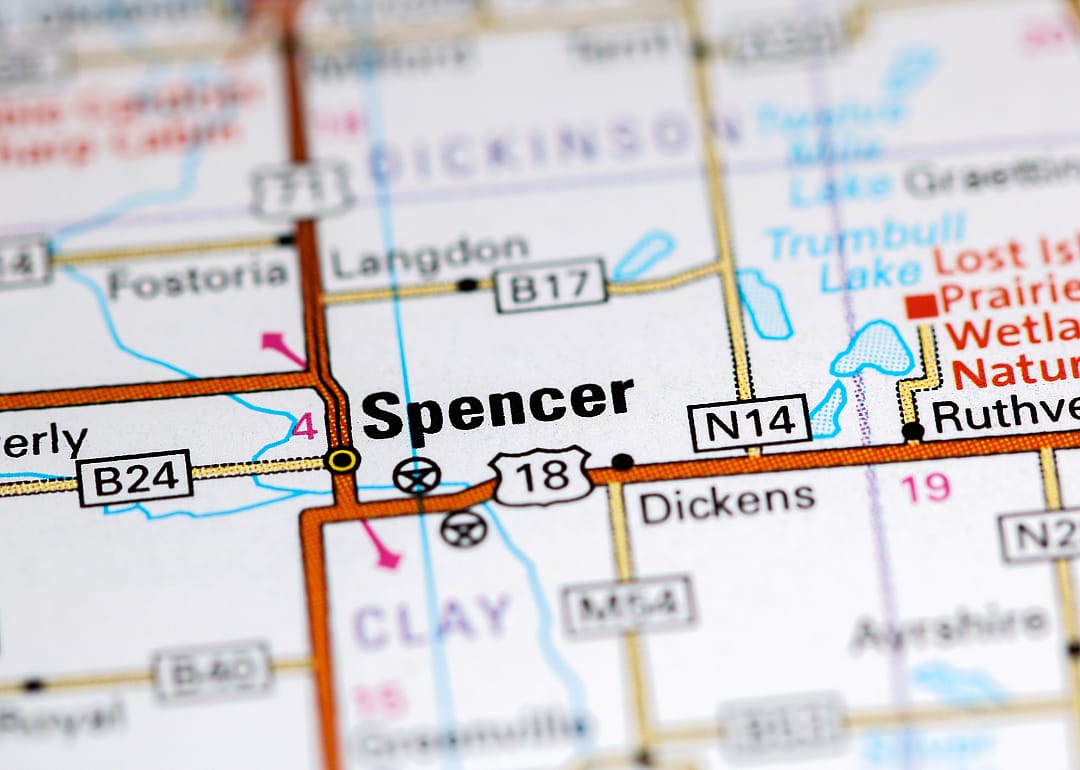
10 / 50SevenMaps // Shutterstock
11 / 50#40. Clay County
- Mean travel time to work: 19.1
- Workers with 60+ minute commute: 4.4%
- Worked outside of county of residence: 19.6%
Joseph Kreiss // Shutterstock
12 / 50#39. Emmet County
- Mean travel time to work: 19.1
- Workers with 60+ minute commute: 4.4%
- Worked outside of county of residence: 17.9%
#38. Muscatine County
- Mean travel time to work: 19.1
- Workers with 60+ minute commute: 3.4%
- Worked outside of county of residence: 20.0%
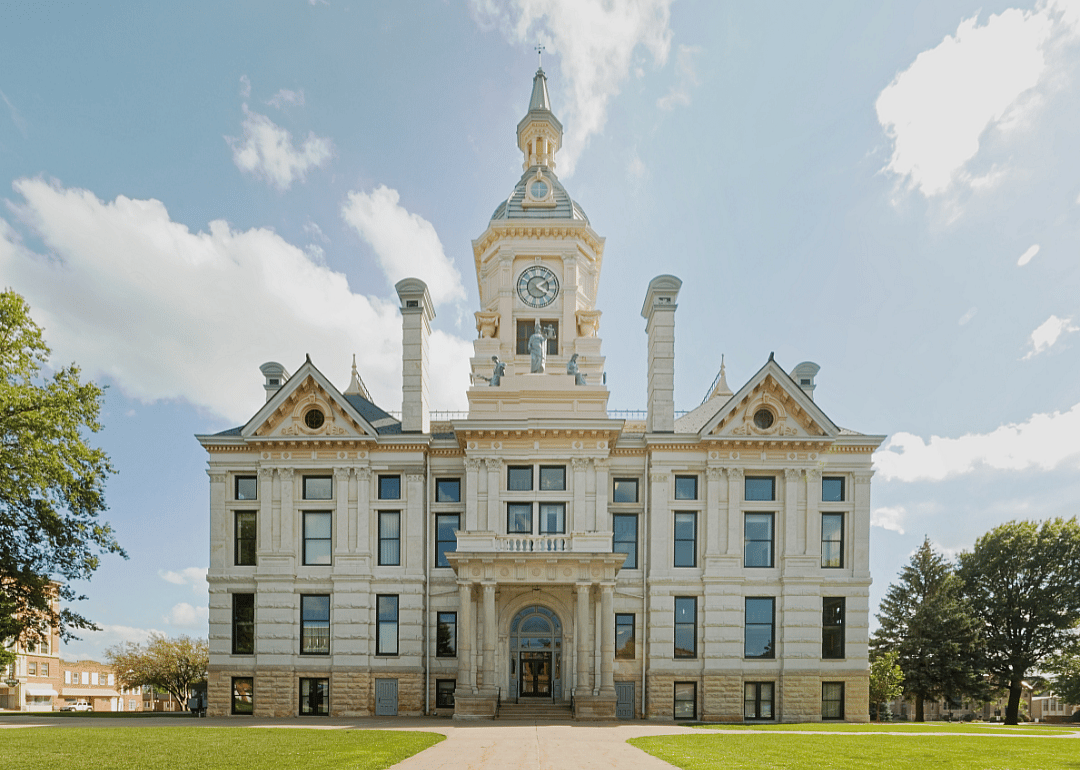
#37. Marshall County
- Mean travel time to work: 18.9
- Workers with 60+ minute commute: 6.1%
- Worked outside of county of residence: 21.6%
#35. Linn County
- Mean travel time to work: 18.9
- Workers with 60+ minute commute: 3.1%
- Worked outside of county of residence: 9.7%
#34. Lyon County
- Mean travel time to work: 18.9
- Workers with 60+ minute commute: 2.9%
- Worked outside of county of residence: 20.6%
Jonathan Park // Shutterstock
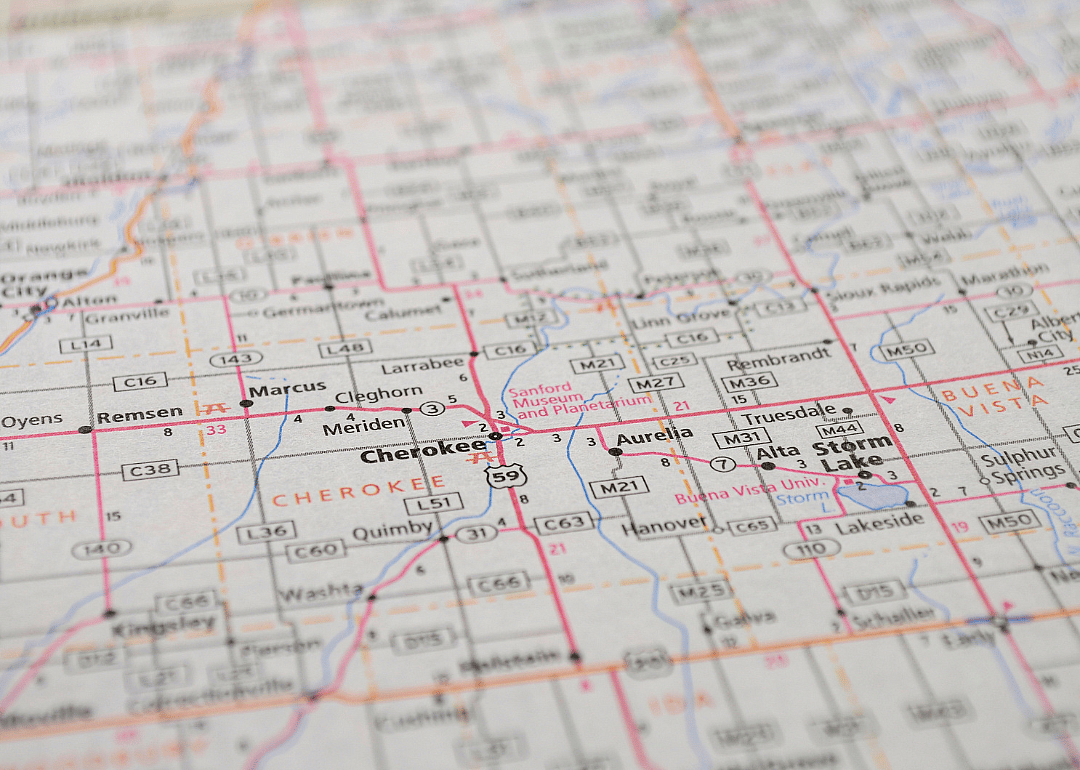
18 / 50#33. Cherokee County
- Mean travel time to work: 18.7
- Workers with 60+ minute commute: 5.0%
- Worked outside of county of residence: 22.3%
#32. Plymouth County
- Mean travel time to work: 18.7
- Workers with 60+ minute commute: 2.9%
- Worked outside of county of residence: 28.7%
#30. Lee County
- Mean travel time to work: 18.6
- Workers with 60+ minute commute: 3.6%
- Worked outside of county of residence: 17.7%
Jim Packett // Shutterstock
22 / 50#29. Floyd County
- Mean travel time to work: 18.6
- Workers with 60+ minute commute: 3.5%
- Worked outside of county of residence: 32.1%
#28. Winneshiek County
- Mean travel time to work: 18.5
- Workers with 60+ minute commute: 4.9%
- Worked outside of county of residence: 11.0%
#27. Webster County
- Mean travel time to work: 18.4
- Workers with 60+ minute commute: 5.2%
- Worked outside of county of residence: 11.7%
SevenMaps // Shutterstock
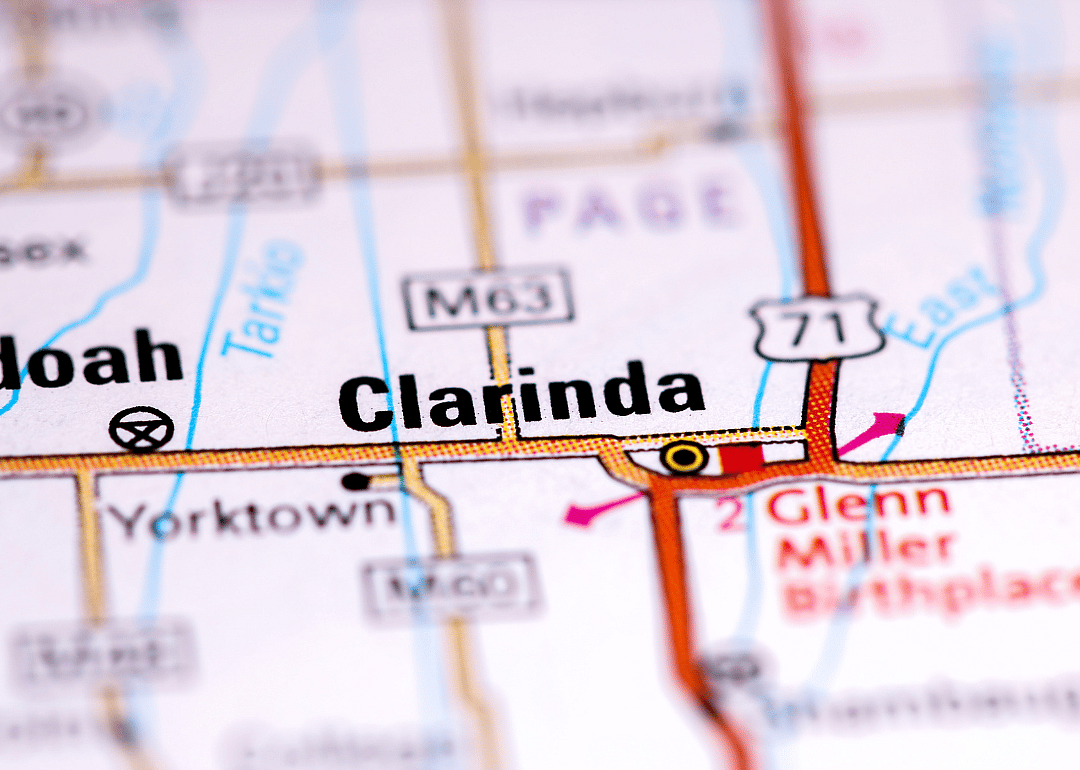
26 / 50#25. Page County
- Mean travel time to work: 18.2
- Workers with 60+ minute commute: 6.8%
- Worked outside of county of residence: 15.6%
SevenMaps // Shutterstock
27 / 50#24. Montgomery County
- Mean travel time to work: 18.1
- Workers with 60+ minute commute: 7.3%
- Worked outside of county of residence: 17.7%
#23. Mahaska County
- Mean travel time to work: 18.0
- Workers with 60+ minute commute: 4.0%
- Worked outside of county of residence: 37.5%
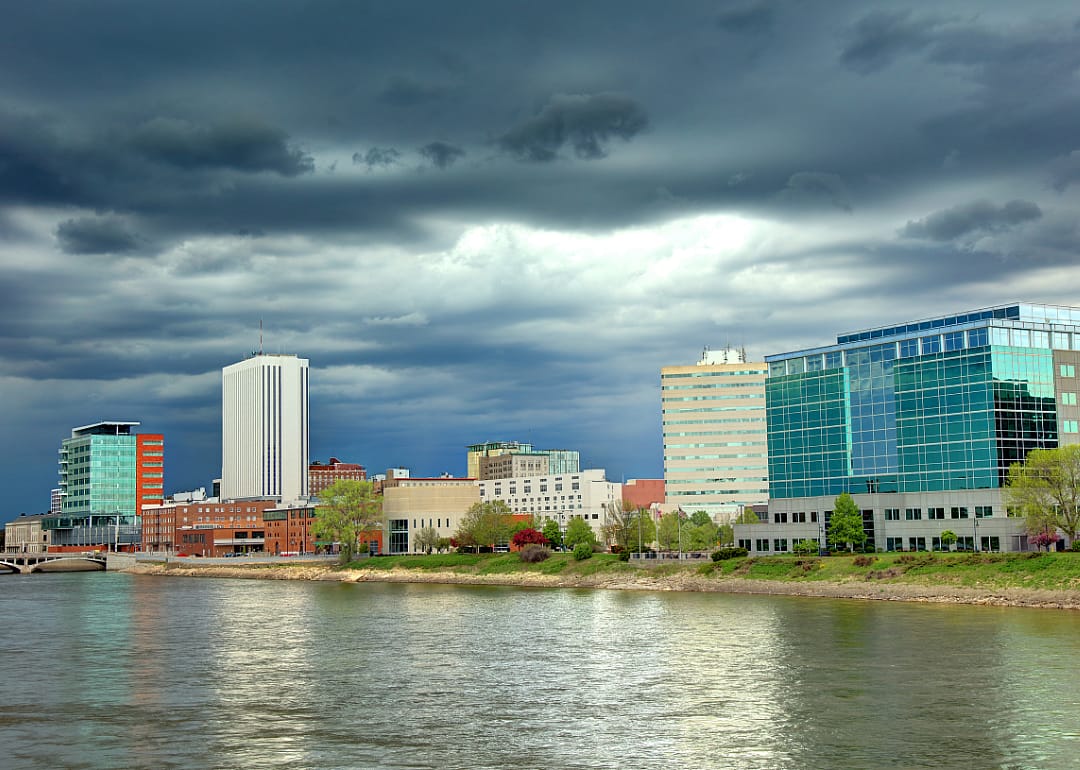
#22. Woodbury County
- Mean travel time to work: 17.6
- Workers with 60+ minute commute: 2.7%
- Worked outside of county of residence: 5.2%
Joel McCartan // Shutterstock
30 / 50#20. Shelby County
- Mean travel time to work: 17.4
- Workers with 60+ minute commute: 5.1%
- Worked outside of county of residence: 18.0%
PICTOR PICTURES // Shutterstock
32 / 50#19. Henry County
- Mean travel time to work: 17.4
- Workers with 60+ minute commute: 4.1%
- Worked outside of county of residence: 25.8%
#18. Wright County
- Mean travel time to work: 17.3
- Workers with 60+ minute commute: 4.0%
- Worked outside of county of residence: 20.7%
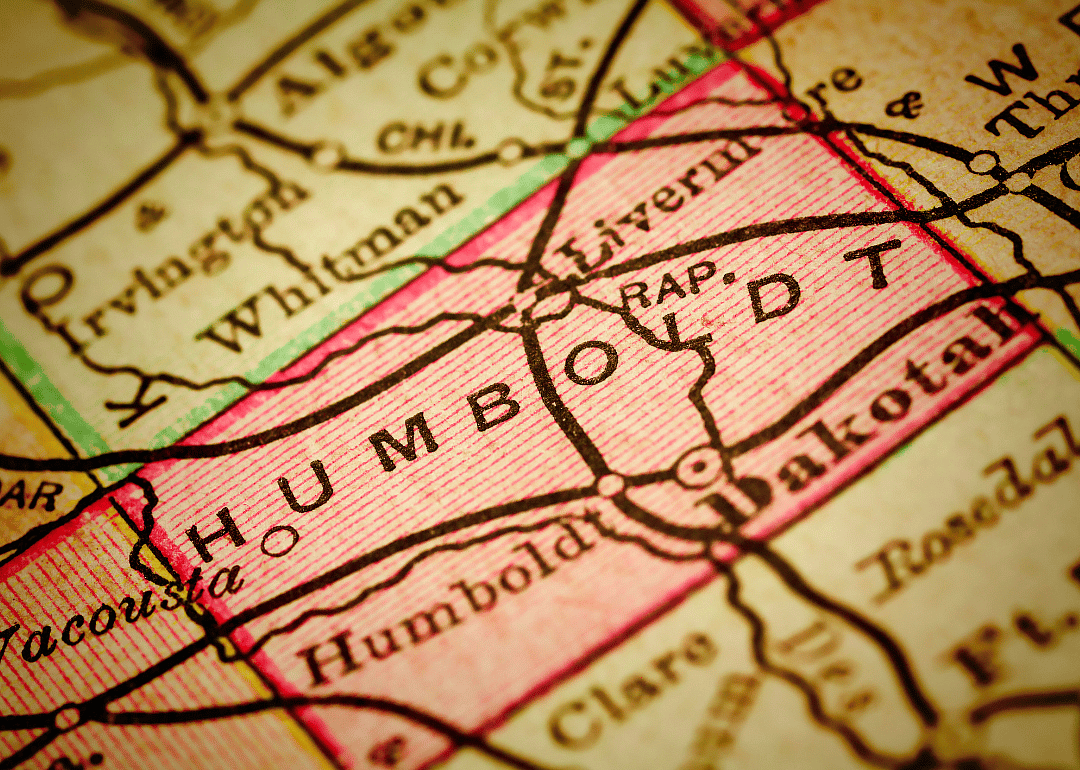
#17. Humboldt County
- Mean travel time to work: 16.8
- Workers with 60+ minute commute: 2.4%
- Worked outside of county of residence: 26.7%
SevenMaps // Shutterstock
35 / 50#16. Franklin County
- Mean travel time to work: 16.8
- Workers with 60+ minute commute: 2.2%
- Worked outside of county of residence: 34.7%
You may also like: Highest-earning counties in Iowa
#15. Winnebago County
- Mean travel time to work: 16.7
- Workers with 60+ minute commute: 3.5%
- Worked outside of county of residence: 24.8%
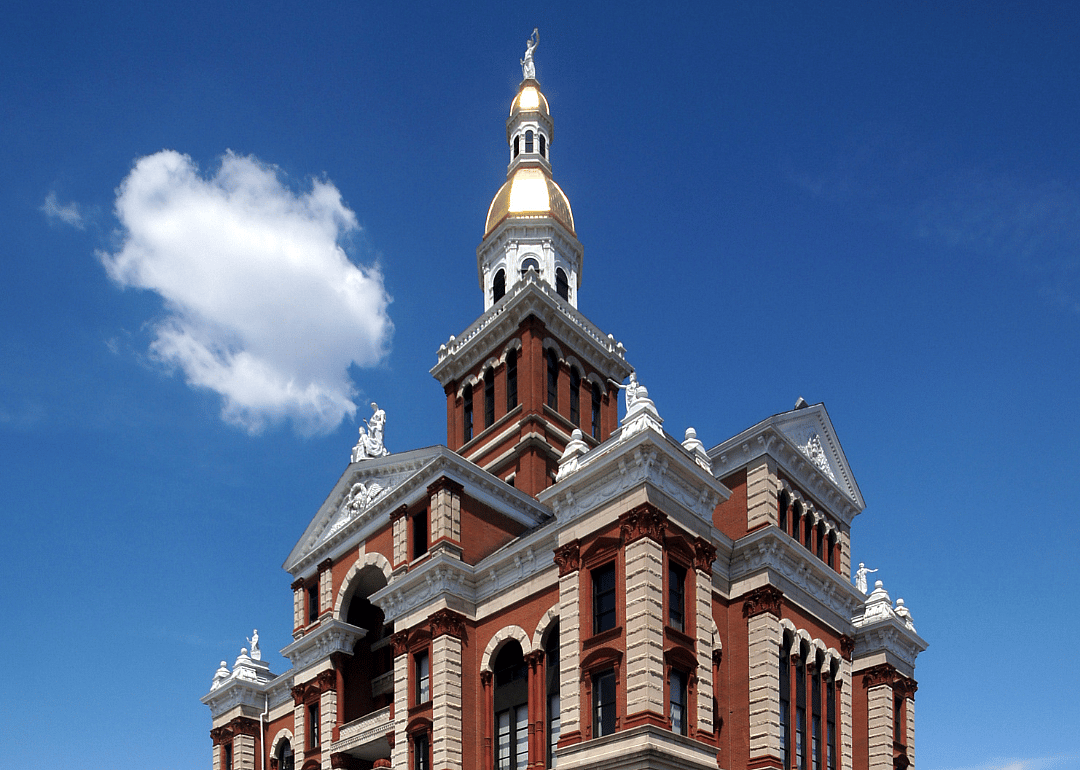
#14. Dubuque County
- Mean travel time to work: 16.7
- Workers with 60+ minute commute: 3.3%
- Worked outside of county of residence: 3.6%
#13. Black Hawk County
- Mean travel time to work: 16.6
- Workers with 60+ minute commute: 3.2%
- Worked outside of county of residence: 7.1%
#12. Cerro Gordo County
- Mean travel time to work: 16.6
- Workers with 60+ minute commute: 2.9%
- Worked outside of county of residence: 10.3%
Eddie J. Rodriquez // Shutterstock
40 / 50Joel McCartan // Shutterstock
41 / 50#10. Palo Alto County
- Mean travel time to work: 16.3
- Workers with 60+ minute commute: 4.3%
- Worked outside of county of residence: 28.9%
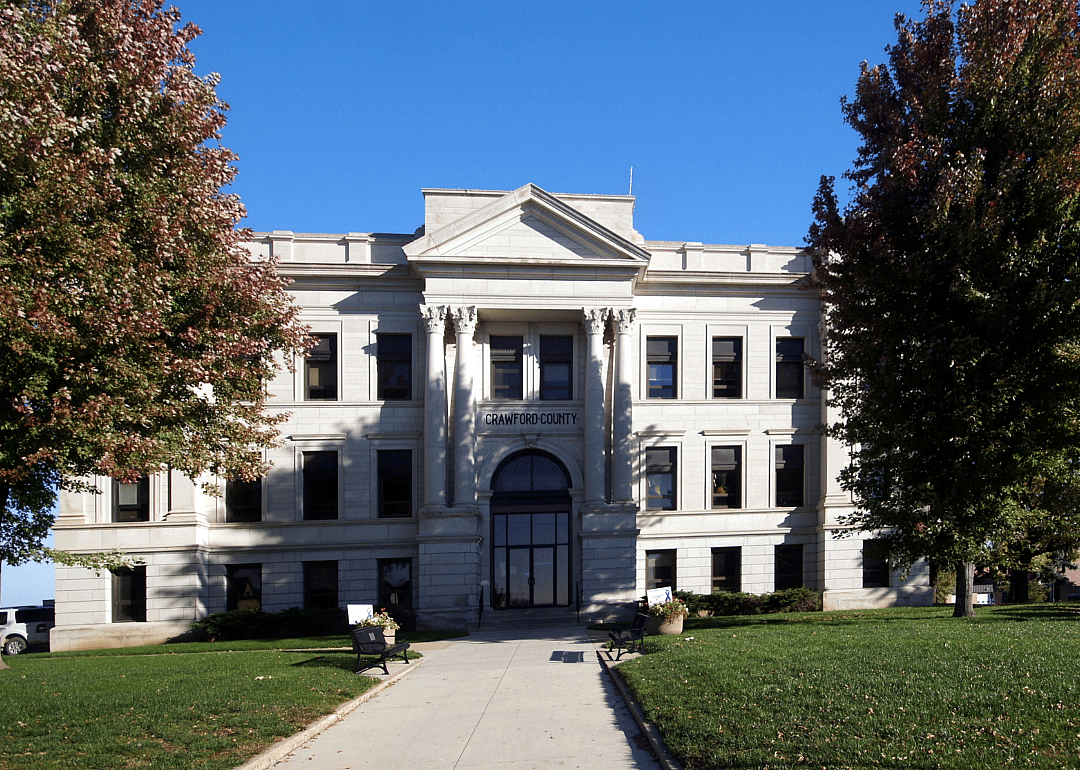
#9. Crawford County
- Mean travel time to work: 16.3
- Workers with 60+ minute commute: 3.3%
- Worked outside of county of residence: 19.4%
stivanderson // Shutterstock
43 / 50#8. Jefferson County
- Mean travel time to work: 16.2
- Workers with 60+ minute commute: 3.2%
- Worked outside of county of residence: 20.1%
#7. Dickinson County
- Mean travel time to work: 16.2
- Workers with 60+ minute commute: 2.6%
- Worked outside of county of residence: 14.0%
dustin77a // Shutterstock
45 / 50Kelsey Haugen // Shutterstock
46 / 50#5. Union County
- Mean travel time to work: 15.5
- Workers with 60+ minute commute: 3.7%
- Worked outside of county of residence: 14.4%
Joel McCartan // Shutterstock
47 / 50#4. Kossuth County
- Mean travel time to work: 15.3
- Workers with 60+ minute commute: 2.3%
- Worked outside of county of residence: 15.0%
Jacob Boomsma // Shutterstock
48 / 50#3. Carroll County
- Mean travel time to work: 14.0
- Workers with 60+ minute commute: 3.2%
- Worked outside of county of residence: 11.7%
Naw Eh Wah // Shutterstock
49 / 50#2. Buena Vista County
- Mean travel time to work: 13.6
- Workers with 60+ minute commute: 1.8%
- Worked outside of county of residence: 10.3%