SmartAsset
1 / 1Top 10 happiest cities
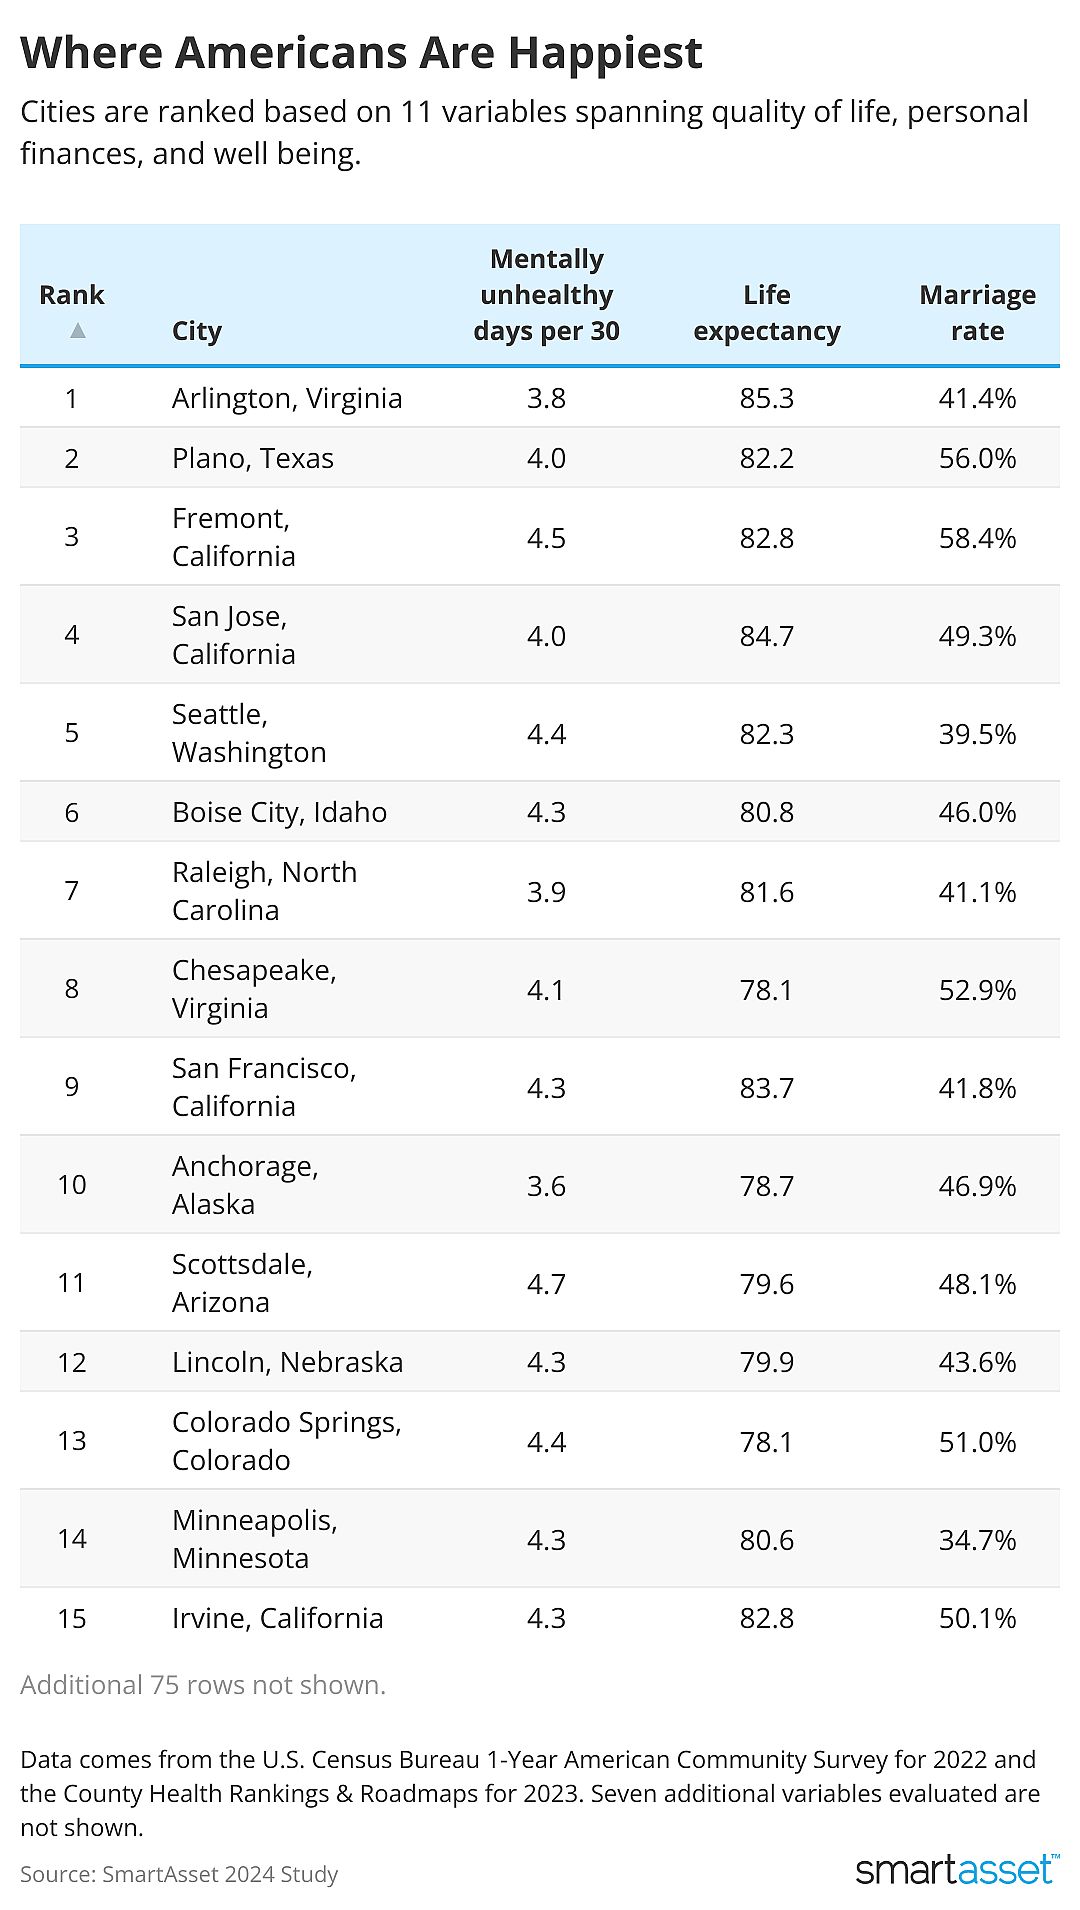
- Arlington, Virginia
- Percentage of households earning $100,000 or more: 62.8%
- Poverty rate: 6.5%
- Housing burdened: 13.3%
- Number of mentally unhealthy days per 30: 3.8
- Life expectancy: 85.3
- Population not getting physical activity: 14.4%
- Rate of health insurance coverage: 95.7%
- Marriage rate: 41.4%
- Traffic volume per meter of roadway: 2593.0
- Percentage of population with adequate space for physical activity: 100.0%
- Overcrowding rate: 3.3%
- Plano, Texas
- Percentage of households earning $100,000 or more: 52.5%
- Poverty rate: 4.9%
- Housing-cost burdened: 12.1%
- Number of mentally unhealthy days per 30: 3.9
- Life expectancy: 82.2
- Population not getting physical activity: 19.1%
- Rate of health insurance coverage: 89.5%
- Marriage rate: 56.0%
- Traffic volume per meter of roadway: 417
- Percentage of population with adequate space for physical activity: 92.4%
- Overcrowding rate: 2.4%
- Fremont, California
- Percentage of households earning $100,000 or more: 70.1%
- Poverty rate: 7.0%
- Housing-cost burdened: 17.2%
- Number of mentally unhealthy days per 30: 4.5
- Life expectancy: 82.8
- Population not getting physical activity: 17.9%
- Rate of health insurance coverage: 97.6%
- Marriage rate: 58.4%
- Traffic volume per meter of roadway: 1791
- Percentage of population with adequate space for physical activity: 99.4%
- Overcrowding rate: 7.9%
- San Jose, California
- Percentage of households earning $100,000 or more: 61.9%
- Poverty rate: 9.0%
- Housing-cost burdened: 15.6%
- Number of mentally unhealthy days per 30: 4.0
- Life expectancy: 84.7
- Population not getting physical activity: 18.5%
- Rate of health insurance coverage: 96.0%
- Marriage rate: 49.3%
- Traffic volume per meter of roadway: 1616
- Percentage of population with adequate space for physical activity: 99.5%
- Overcrowding rate: 8.2%
- Seattle, Washington
- Percentage of households earning $100,000 or more: 55.3%
- Poverty rate: 10.1%
- Housing-cost burdened: 14.6%
- Number of mentally unhealthy days per 30: 4.3
- Life expectancy: 82.3
- Population not getting physical activity: 13.9%
- Rate of health insurance coverage: 95.9%
- Marriage rate: 39.5%
- Traffic volume per meter of roadway: 1309
- Percentage of population with adequate space for physical activity: 98.0%
- Overcrowding rate: 3.8%
- Boise, Idaho
- Percentage of households earning $100,000 or more: 39.0%
- Poverty rate: 11.1%
- Housing-cost burdened: 0.105348873
- Number of mentally unhealthy days per 30: 4.2
- Life expectancy: 80.8
- Population not getting physical activity: 17.2%
- Rate of health insurance coverage: 93.7%
- Marriage rate: 46.0%
- Traffic volume per meter of roadway: 315
- Percentage of population with adequate space for physical activity: 86.0%
- Overcrowding rate: 1.6%
- Raleigh, North Carolina
- Percentage of households earning $100,000 or more: 38.4%
- Poverty rate: 11.0%
- Housing-cost burdened: 11.2%
- Number of mentally unhealthy days per 30: 3.9
- Life expectancy: 81.6
- Population not getting physical activity: 16.2%
- Rate of health insurance coverage: 90.3%
- Marriage rate: 41.1%
- Traffic volume per meter of roadway: 545
- Percentage of population with adequate space for physical activity: 89.6%
- Overcrowding rate: 2.0%
- Chesapeake, Virginia
- Percentage of households earning $100,000 or more: 43.5%
- Poverty rate: 8.4%
- Housing-cost burdened: 12.6%
- Number of mentally unhealthy days per 30: 4.0
- Life expectancy: 78.1
- Population not getting physical activity: 22.3%
- Rate of health insurance coverage: 93.5%
- Marriage rate: 52.9%
- Traffic volume per meter of roadway: 526
- Percentage of population with adequate space for physical activity: 90.6%
- Overcrowding rate: 1.4%
- San Francisco, California
- Percentage of households earning $100,000 or more: 60.4%
- Poverty rate: 10.4%
- Housing-cost burdened: 16.3%
- Number of mentally unhealthy days per 30: 4.2
- Life expectancy: 83.7
- Population not getting physical activity: 16.9%
- Rate of health insurance coverage: 97.0%
- Marriage rate: 41.8%
- Traffic volume per meter of roadway: 2397
- Percentage of population with adequate space for physical activity: 100.0%
- Overcrowding rate: 6.6%
- Anchorage, Alaska
- Percentage of households earning $100,000 or more: 50.5%
- Poverty rate: 11.1%
- Housing-cost burdened: 12.7%
- Number of mentally unhealthy days per 30: 3.6
- Life expectancy: 78.7
- Population not getting physical activity: 19.5%
- Rate of health insurance coverage: 90.4%
- Marriage rate: 46.9%
- Traffic volume per meter of roadway: 534
- Percentage of population with adequate space for physical activity: 91.0%
- Overcrowding rate: 4.7%
10 least happy cities
- Detroit, Michigan
- Percentage of households earning $100,000 or more: 12.7%
- Poverty rate: 33.8%
- Housing-cost burdened: 16.4%
- Number of mentally unhealthy days per 30: 5.6
- Life expectancy: 74
- Population not getting physical activity: 24.7%
- Rate of health insurance coverage: 93.4%
- Marriage rate: 21%
- Traffic volume per meter of roadway: 1627.9
- Percentage of population with adequate space for physical activity: 95.5%
- Overcrowding rate: 2.1%
- Laredo, Texas
- Percentage of households earning $100,000 or more: 26.4%
- Poverty rate: 20.1%
- Housing-cost burdened: 15.0%
- Number of mentally unhealthy days per 30: 4.7
- Life expectancy: 79
- Population not getting physical activity: 38.0%
- Rate of health insurance coverage: 74.2%
- Marriage rate: 47.3%
- Traffic volume per meter of roadway: 559.3
- Percentage of population with adequate space for physical activity: 91.0%
- Overcrowding rate: 11.5%
- New Orleans, Louisiana
- Percentage of households earning $100,000 or more: 28.1%
- Poverty rate: 22.2%
- Housing-cost burdened: 25.6%
- Number of mentally unhealthy days per 30: 5.9
- Life expectancy: 76
- Population not getting physical activity: 27.4%
- Rate of health insurance coverage: 93.5%
- Marriage rate: 32.9%
- Traffic volume per meter of roadway: 2109.3
- Percentage of population with adequate space for physical activity: 94.9%
- Overcrowding rate: 1.4%
- Newark, New Jersey
- Percentage of households earning $100,000 or more: 21.6%
- Poverty rate: 24.0%
- Housing-cost burdened: 23.2%
- Number of mentally unhealthy days per 30: 4.92
- Life expectancy: 78
- Population not getting physical activity: 25.5%
- Rate of health insurance coverage: 83.7%
- Marriage rate: 32.8%
- Traffic volume per meter of roadway: 1493.9
- Percentage of population with adequate space for physical activity: 99.7%
- Overcrowding rate: 4.6%
- Memphis, Tennessee
- Percentage of households earning $100,000 or more: 22.5%
- Poverty rate: 21.4%
- Housing-cost burdened: 17.7%
- Number of mentally unhealthy days per 30: 5.2
- Life expectancy: 74
- Population not getting physical activity: 26.1%
- Rate of health insurance coverage: 87.2%
- Marriage rate: 30.7%
- Traffic volume per meter of roadway: 523.1
- Percentage of population with adequate space for physical activity: 86.3%
- Overcrowding rate: 2.2%
- Philadelphia, Pennsylvania
- Percentage of households earning $100,000 or more: 27.7%
- Poverty rate: 21.7%
- Housing-cost burdened: 20.6%
- Number of mentally unhealthy days per 30: 5.5
- Life expectancy: 75
- Population not getting physical activity: 29.7%
- Rate of health insurance coverage: 93.2%
- Marriage rate: 33%
- Traffic volume per meter of roadway: 1635.4
- Percentage of population with adequate space for physical activity: 100%
- Overcrowding rate: 2.7%
- Miami, Florida
- Percentage of households earning $100,000 or more: 30.7%
- Poverty rate: 18.7%
- Housing-cost burdened: 25.1%
- Number of mentally unhealthy days per 30: 4.4
- Life expectancy: 82
- Population not getting physical activity: 33.2%
- Rate of health insurance coverage: 82.6%
- Marriage rate: 35%
- Traffic volume per meter of roadway: 1458.8
- Percentage of population with adequate space for physical activity: 98.4%
- Overcrowding rate: 6.3%
- El Paso, Texas
- Percentage of households earning $100,000 or more: 22.5%
- Poverty rate: 21.7%
- Housing-cost burdened: 14.6%
- Number of mentally unhealthy days per 30: 4.8
- Life expectancy: 78
- Population not getting physical activity: 30.3%
- Rate of health insurance coverage: 79.2%
- Marriage rate: 44.4%
- Traffic volume per meter of roadway: 632.0
- Percentage of population with adequate space for physical activity: 81.7%
- Overcrowding rate: 5.0%
- Cleveland, Ohio
- Percentage of households earning $100,000 or more: 14.0%
- Poverty rate: 31.8%
- Housing-cost burdened: 14.8%
- Number of mentally unhealthy days per 30: 5.4
- Life expectancy: 76
- Population not getting physical activity: 23.1%
- Rate of health insurance coverage: 92.7%
- Marriage rate: 24.4%
- Traffic volume per meter of roadway: 677.5
- Percentage of population with adequate space for physical activity: 98.0%
- Overcrowding rate: 1.1%
- Houston, Texas
- Percentage of households earning $100,000 or more: 28.5%
- Poverty rate: 20.7%
- Housing-cost burdened: 16.2%
- Number of mentally unhealthy days per 30: 4.5
- Life expectancy: 79
- Population not getting physical activity: 28.7%
- Rate of health insurance coverage: 75.9%
- Marriage rate: 39.4%
- Traffic volume per meter of roadway: 808.9
- Percentage of population with adequate space for physical activity: 90.9%
- Overcrowding rate: 5.6%
Data and methodology
90 of the largest U.S. cities for which data was available were evaluated across three categories: personal finance, well being, and quality of life. Data comes from the U.S. Census Bureau 1-Year American Community Survey for 2022 and the County Health Rankings & Roadmaps for 2023.
Personal finance metrics included:
- Percent of individuals earnings $100,000 or more.
- Percent of households that spend 50% or more of income on housing.
- Percent of residents below the poverty level.
Well-being:
- Average number of mentally unhealthy days in the last 30.
- Life expectancy in years.
- Percent of residents who report being physically inactive.
- Percent of residents who have health insurance.
Quality of Life:
- Marriage rate.
- Average traffic volume per meter of major roadways in the county.
- Percent of population with adequate access to locations for physical activity.
- Percentage of households with overcrowding (more than one person living in a room).