ConsumerAffairs
1 / 2Major advantages of public transit
Some advantages of public transit systems include their eco-friendliness, shorter commute times and connectability. Transit vehicles emit far fewer greenhouse gases per passenger mile than a regular car, and you don't have to fight traffic yourself or pay for parking at your destination. Transit lines also usually connect, making longer trips possible, such as weekend getaways.
Personal advantages abound, too. Riding on local public transit can allow you to see diverse neighborhoods and meet other people you share the city with. Relieved from driving, you can also rest, read or otherwise relax during the journey.
Artificial intelligence can also make public transit systems more efficient and save riders time by analyzing different routes and schedules to get you to your destination faster and without as much of a hassle.
A 2020 report from the International Association of Public Transport found AI offers the potential to adjust transit services in real time, responding to heavy traffic, heavy ridership and sudden emergencies. The report found that AI systems can also help users plan journeys that combine multiple stops and interconnecting services and adapt fares to meet specific goals for both revenue and equity. They can also save agencies money by optimizing fuel efficiency and maintenance services.
Since that report came out, the U.S. federal government has spent millions of dollars helping transit agencies around the country develop AI systems that aim to improve service, reliability and cost in transit systems. The starting point for many of the nation's most populous cities is already quite good — but there is still much room for improvement everywhere.
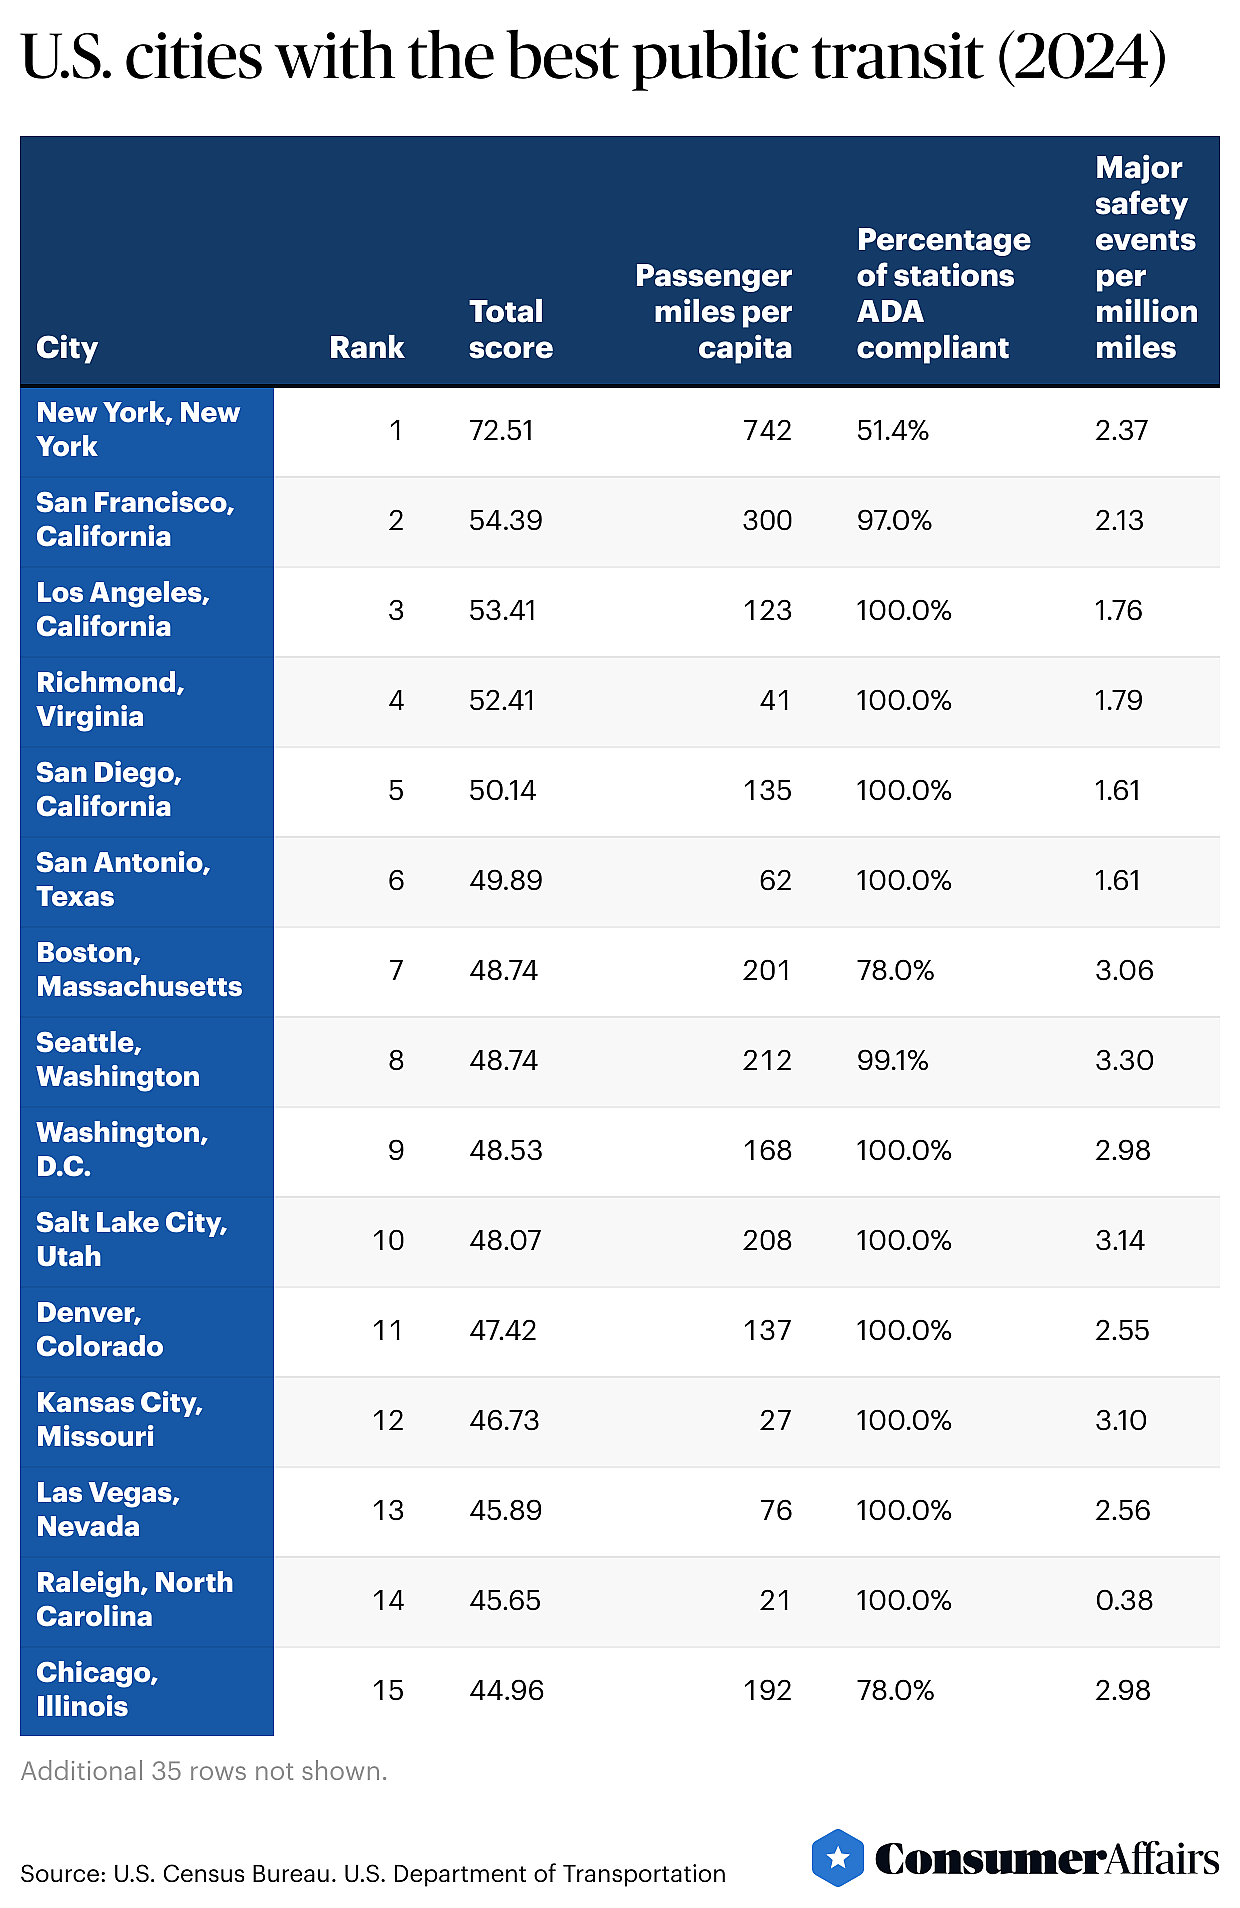
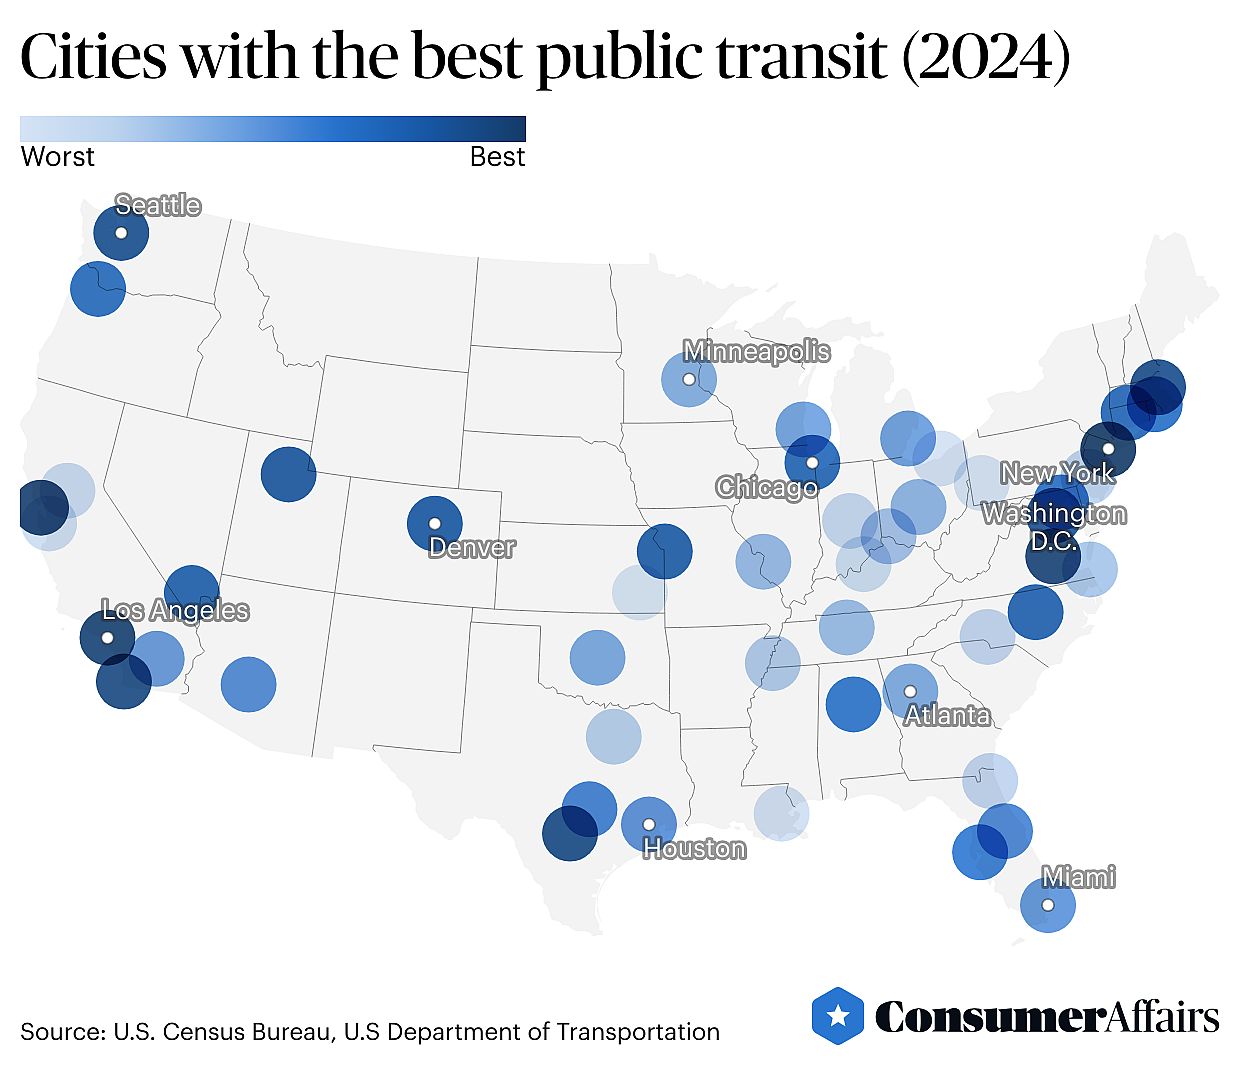
Here's how the cities stacked up:
1. New York, New York
- Annual public transit trips per metro area resident: 144.2
- Share of stations ADA-compliant: 51.4%
- Safety score (combining fatalities and serious injuries): 13.07 out of 20
- Average fare revenue per trip: $1.75
The nation's most populous metro area is served by a large number of transit agencies, with trains and buses covering the five boroughs of New York City itself, as well as areas well into New Jersey, Connecticut and downstate New York. While the average fare revenue is higher than most, it's still cheaper per trip than in Pittsburgh, Pennsylvania, and Buffalo, New York.
2. San Francisco, California
- Annual public transit trips per metro area resident: 53.6
- Share of stations ADA-compliant: 97%
- Safety score (combining fatalities and serious injuries): 13.91 out of 20
- Average fare revenue per one-way trip: $1.63
With the third-worst commuter traffic in the nation, San Francisco residents might be desperate for other ways to get around. Fortunately, Bay Area Rapid Transit connects the city with its suburbs, and the Muni bus and train system – including the city's famous cable cars – gets people around the city itself. There are also free shuttles to get people to and from public parks.
3. Los Angeles, California
- Annual public transit trips per metro area resident: 29
- Share of stations ADA-compliant: 100%
- Safety score (combining fatalities and serious injuries): 16.48 out of 20
- Average fare revenue per one-way trip: 49 cents
Los Angeles, well known as a sprawling car-oriented metropolis, has a transit system that doesn't get as much use per capita as other cities' services. However, it's one of the safest and most affordable transit systems nationwide.
4. Richmond, Virginia
- Annual public transit trips per metro area resident: 8.5
- Share of stations ADA-compliant: 100%
- Safety score (combining fatalities and serious injuries): 18.27 out of 20
- Average fare revenue per one-way trip: 24 cents
With free local bus fares across the city, including high-speed buses with some dedicated lanes that provide service every 10 minutes on weekdays and every 15 minutes on weekends, Richmond's public transit system is safer and more efficient than many other large cities' services. Unfortunately, it is used less frequently than any other system mentioned in our top 10 list.
5. San Diego, California
- Annual public transit trips per metro area resident: 21
- Share of stations ADA-compliant: 100%
- Safety score (combining fatalities and serious injuries): 14.74 out of 20
- Average fare revenue per one-way trip: $1.10
A new safety initiative, expanded service and upcoming investments in new vehicles, including electric buses, are drawing riders to San Diego's trolleys and buses, which serve the downtown area and the surrounding communities.
6. San Antonio, Texas
- Annual public transit trips per metro area resident: 12.6
- Share of stations ADA-compliant: 100%
- Safety score (combining fatalities and serious injuries): 18.44 out of 20
- Average fare revenue per one-way trip: 58 cents
San Antonio's bus service spans the city and is set to expand in the coming years. The agency that runs it, VIA Metropolitan Transit, is also working to make its service schedules and maps more comprehensible to prospective users. The city is also considering new zoning rules that would make denser housing along high-capacity bus lines easier for developers to build.
7. Boston, Massachusetts
- Annual public transit trips per metro area resident: 47.5
- Share of stations ADA-compliant: 78%
- Safety score (combining fatalities and serious injuries): 14.57 out of 20
- Average fare revenue per one-way trip: $1.63
In Boston, a city well known for confounding even local drivers with one-way streets and hairpin turns, it's tempting to let someone else handle navigation. Even with a relatively expensive average fare and incomplete ADA compliance at stations, the city's MBTA trains and buses are relied on more heavily than transit vehicles in other large cities.
8. Seattle, Washington
- Annual public transit trips per metro area resident: 36.7
- Share of stations ADA-compliant: 99.1%
- Safety score (combining fatalities and serious injuries): 14.52 out of 20
- Average fare revenue per one-way trip: $1.57
Seattle's public transit system, which includes buses, trains, and ferries, links its suburbs, downtown area and nearby islands. In 2024, the city is asking voters to raise their taxes to pay for a 20-year transportation plan that includes pothole repair and expanded transit services.
9. Washington, D.C.
- Annual public transit trips per metro area resident: 36.7
- Share of stations ADA-compliant: 100%
- Safety score (combining fatalities and serious injuries): 15.41 out of 20
- Average fare revenue per one-way trip: $1.29
The D.C. area's roads are so famously congested that people joke there is no rush hour at all — except all the time. Fortunately, the Metro system encompasses trains, buses and subways run by city officials and state and local agencies in neighboring Maryland and Virginia.
10. Salt Lake City, Utah
- Annual public transit trips per metro area resident: 26.7
- Share of stations ADA-compliant: 100%
- Safety score (combining fatalities and serious injuries): 11.83 out of 20
- Average fare revenue per one-way trip: $1.07
Bus and rail lines crisscross the city and the surrounding county. The city's plans for transit expansion call for additional services by 2030 and are being used to tempt Olympic officials to consider it as a location for the 2034 Winter Games.