SmartAsset
1 / 1Top 20 Happiest Cities
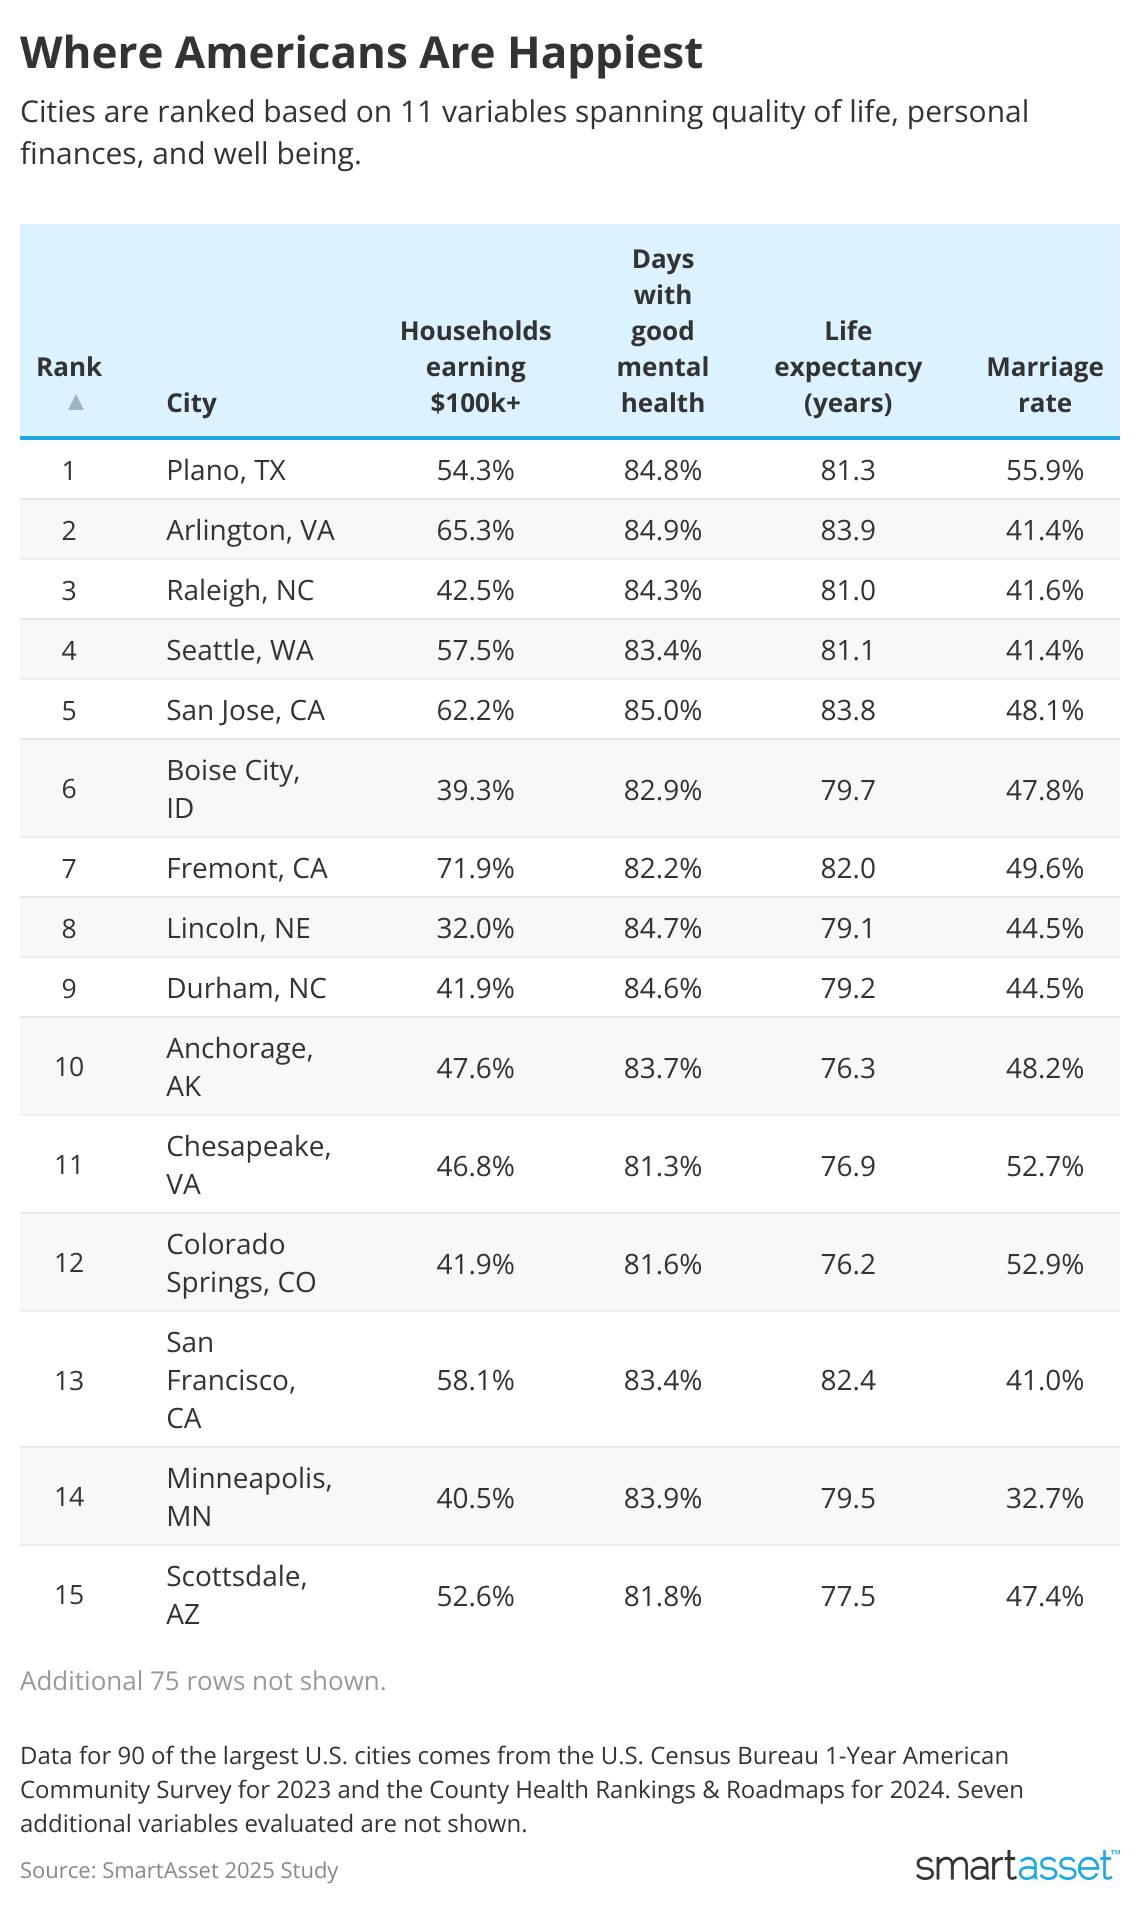
- Plano, Texas
- Households earning $100,000 or more: 54.3%
- Poverty rate: 7%
- Households spending 50% or more of income on housing: 13%
- Days with good mental health: 84.8%
- Life expectancy: 81.31 years
- Residents getting exercise: 0.826
- Population covered by health insurance: 90.3%
- Population with adequate access to physical activity: 93%
- Rate of overcrowding: 2.8%
- Marriage rate: 55.9%
- Average traffic volume: 140.65
2. Arlington, Virginia
- Households earning $100,000 or more: 65.3%
- Poverty rate: 6.9%
- Households spending 50% or more of income on housing: 14.2%
- Days with good mental health: 84.9%
- Life expectancy: 83.94 years
- Residents getting exercise: 0.830
- Population covered by health insurance: 96.4%
- Population with adequate access to physical activity: 100%
- Rate of overcrowding: 3.4%
- Marriage rate: 41.4%
- Average traffic volume: 540
3. Raleigh, North Carolina
- Households earning $100,000 or more: 42.5%
- Poverty rate: 10.3%
- Households spending 50% or more of income on housing: 12%
- Days with good mental health: 84.3%
- Life expectancy: 80.99 years
- Residents getting exercise: 0.842
- Population covered by health insurance: 91.9%
- Population with adequate access to physical activity: 98.6%
- Rate of overcrowding: 2%
- Marriage rate: 41.6%
- Average traffic volume: 111.59
4. Seattle
- Households earning $100,000 or more: 57.5%
- Poverty rate: 9.9%
- Households spending 50% or more of income on housing: 15%
- Days with good mental health: 83.4%
- Life expectancy: 81.06 years
- Residents getting exercise: 0.867
- Population covered by health insurance: 95.7%
- Population with adequate access to physical activity: 97.9%
- Rate of overcrowding: 3.9%
- Marriage rate: 41.4%
- Average traffic volume: 332.97
5. San Jose, California
- Households earning $100,000 or more: 62.2%
- Poverty rate: 8.5%
- Households spending 50% or more of income on housing: 15.7%
- Days with good mental health: 85%
- Life expectancy: 83.79 years
- Residents getting exercise: 0.809
- Population covered by health insurance: 95.1%
- Population with adequate access to physical activity: 99.4%
- Rate of overcrowding: 7.9%
- Marriage rate: 48.1%
- Average traffic volume: 626.36
6. Boise City, Idaho
- Households earning $100,000 or more: 39.3%
- Poverty rate: 9.9%
- Households spending 50% or more of income on housing: 10.9%
- Days with good mental health: 82.9%
- Life expectancy: 79.74 years
- Residents getting exercise: 0.824
- Population covered by health insurance: 92.7%
- Population with adequate access to physical activity: 91.6%
- Rate of overcrowding: 1.9%
- Marriage rate: 47.8%
- Average traffic volume: 116.67
7. Fremont, California
- Households earning $100,000 or more: 71.9%
- Poverty rate: 5.4%
- Households spending 50% or more of income on housing: 18.1%
- Days with good mental health: 82.2%
- Life expectancy: 81.98 years
- Residents getting exercise: 0.812
- Population covered by health insurance: 97.6%
- Population with adequate access to physical activity: 99.6%
- Rate of overcrowding: 7.7%
- Marriage rate: 49.6%
- Average traffic volume: 683.02
8. Lincoln, Nebraska
- Households earning $100,000 or more: 32%
- Poverty rate: 12.2%
- Households spending 50% or more of income on housing: 12.6%
- Days with good mental health: 84.7%
- Life expectancy: 79.09 years
- Residents getting exercise: 0.789
- Population covered by health insurance: 94.7%
- Population with adequate access to physical activity: 95.4%
- Rate of overcrowding: 2.2%
- Marriage rate: 44.5%
- Average traffic volume: 211.07
9. Durham, North Carolina
- Households earning $100,000 or more: 41.9%
- Poverty rate: 10%
- Households spending 50% or more of income on housing: 13.4%
- Days with good mental health: 84.6%
- Life expectancy: 79.19 years
- Residents getting exercise: 0.809
- Population covered by health insurance: 89.4%
- Population with adequate access to physical activity: 90.7%
- Rate of overcrowding: 2.9%
- Marriage rate: 44.5%
- Average traffic volume: 134.11
10. Anchorage, Alaska
- Households earning $100,000 or more: 47.6%
- Poverty rate: 8.4%
- Households spending 50% or more of income on housing: 13.2%
- Days with good mental health: 83.7%
- Life expectancy: 76.34 years
- Residents getting exercise: 0.801
- Population covered by health insurance: 92.3%
- Population with adequate access to physical activity: 93.9%
- Rate of overcrowding: 4.5%
- Marriage rate: 48.2%
- Average traffic volume: 152.30
11. Chesapeake, Virginia
- Households earning $100,000 or more: 46.8%
- Poverty rate: 11.2%
- Households spending 50% or more of income on housing: 14.1%
- Days with good mental health: 81.3%
- Life expectancy: 76.87 years
- Residents getting exercise: 0.783
- Population covered by health insurance: 94.9%
- Population with adequate access to physical activity: 94.4%
- Rate of overcrowding: 1.5%
- Marriage rate: 52.7%
- Average traffic volume: 115.25
12. Colorado Springs, Colorado
- Households earning $100,000 or more: 41.9%
- Poverty rate: 6.6%
- Households spending 50% or more of income on housing: 14.4%
- Days with good mental health: 81.6%
- Life expectancy: 76.23 years
- Residents getting exercise: 0.815
- Population covered by health insurance: 93.7%
- Population with adequate access to physical activity: 89.8%
- Rate of overcrowding: 2.5%
- Marriage rate: 52.9%
- Average traffic volume: 140.87
13. San Francisco
- Households earning $100,000 or more: 58.1%
- Poverty rate: 12%
- Households spending 50% or more of income on housing: 16.9%
- Days with good mental health: 83.4%
- Life expectancy: 82.41 years
- Residents getting exercise: 0.836
- Population covered by health insurance: 96.8%
- Population with adequate access to physical activity: 100%
- Rate of overcrowding: 6.8%
- Marriage rate: 41%
- Average traffic volume: 794.01
14. Minneapolis
- Households earning $100,000 or more: 40.5%
- Poverty rate: 15.3%
- Households spending 50% or more of income on housing: 13.4%
- Days with good mental health: 83.9%
- Life expectancy: 79.47 years
- Residents getting exercise: 0.833
- Population covered by health insurance: 95.3%
- Population with adequate access to physical activity: 99.1%
- Rate of overcrowding: 2.7%
- Marriage rate: 32.7%
- Average traffic volume: 304.61
15. Scottsdale
- Households earning $100,000 or more: 52.6%
- Poverty rate: 7.7%
- Households spending 50% or more of income on housing: 14.2%
- Days with good mental health: 81.8%
- Life expectancy: 77.47 years
- Residents getting exercise: 0.780
- Population covered by health insurance: 94.6%
- Population with adequate access to physical activity: 92.8%
- Rate of overcrowding: 4.4%
- Marriage rate: 47.4%
- Average traffic volume: 244.16
16. Chula Vista, California
- Households earning $100,000 or more: 52.8%
- Poverty rate: 6%
- Households spending 50% or more of income on housing: 20.8%
- Days with good mental health: 82.7%
- Life expectancy: 80.30 years
- Residents getting exercise: 0.817
- Population covered by health insurance: 95.1%
- Population with adequate access to physical activity: 97.5%
- Rate of overcrowding: 6.9%
- Marriage rate: 50.5%
- Average traffic volume: 440.11
17. Omaha, Nebraska
- Households earning $100,000 or more: 35%
- Poverty rate: 13.4%
- Households spending 50% or more of income on housing: 13.1%
- Days with good mental health: 84.1%
- Life expectancy: 77.73 years
- Residents getting exercise: 0.757
- Population covered by health insurance: 92%
- Population with adequate access to physical activity: 97.4%
- Rate of overcrowding: 2.1%
- Marriage rate: 44.8%
- Average traffic volume: 214.94
18. Aurora, Colorado
- Households earning $100,000 or more: 44.3%
- Poverty rate: 13.8%
- Households spending 50% or more of income on housing: 15.6%
- Days with good mental health: 82.9%
- Life expectancy: 79.09 years
- Residents getting exercise: 0.824
- Population covered by health insurance: 86.8%
- Population with adequate access to physical activity: 97.5%
- Rate of overcrowding: 3%
- Marriage rate: 45.8%
- Average traffic volume: 215.22
19. Charlotte, North Carolina
- Households earning $100,000 or more: 41%
- Poverty rate: 11.3%
- Households spending 50% or more of income on housing: 14.3%
- Days with good mental health: 83.7%
- Life expectancy: 78.82 years
- Residents getting exercise: 0.811
- Population covered by health insurance: 87.3%
- Population with adequate access to physical activity: 88.7%
- Rate of overcrowding: 2.3%
- Marriage rate: 40.9%
- Average traffic volume: 165.52
20. Irvine, California
- Households earning $100,000 or more: 61.7%
- Poverty rate: 9.8%
- Households spending 50% or more of income on housing: 20.3%
- Days with good mental health: 83.7%
- Life expectancy: 81.28 years
- Residents getting exercise: 0.797
- Population covered by health insurance: 96.4%
- Population with adequate access to physical activity: 99.1%
- Rate of overcrowding: 8.7%
- Marriage rate: 49.7%
- Average traffic volume: 720.28
Data and Methodology
For this SmartAsset study, 90 of the largest U.S. cities for which data was available were evaluated across three categories: personal finance, well being, and quality of life. Data comes from the U.S. Census Bureau 1-Year American Community Survey for 2023 and the County Health Rankings & Roadmaps for 2024.
Personal finance metrics included:
- Percent of individuals earnings $100,000 or more.
- Percent of households that spend 50% or more of income on housing.
- Percent of residents below the poverty level.
Well-being metrics include:
- Average number of mentally unhealthy days in the last 30.
- Life expectancy in years.
- Percent of residents who report being physically inactive.
- Percent of residents who have health insurance.
Quality of life metrics include:
- Marriage rate. (If city-level data was not available, county level data was substituted. In one case where city- or county-level data was not available, the city-level data for the previous year was used.)
- Average traffic volume per meter of major roadways in the county.
- Percent of population with adequate access to locations for physical activity.
- Percentage of households with overcrowding (more than one person living in a room).