
Where are the most livable small cities in the U.S.?
This story was produced by SmartAsset and reviewed and distributed by Stacker Media.
Where are the most livable small cities in the U.S.?
Small cities may offer cost benefits for residents looking to stretch their income while enjoying a comfortable – and more spacious – lifestyle. While livability is a subjective concept that may take on different definitions for different people, some elements of a community can come close to being universally beneficial. Housing affordability, the spread of business offerings, financial standing and unemployment levels, average commute times and healthcare coverage can all affect the well-being and comfort of the community as a whole.
With this in mind, SmartAsset ranked 281 small U.S. cities to find the most "livable."
Key Findings
- Small cities in three Midwestern states dominate the top 10. Troy and Rochester Hills, MI, rank first and second for most livable small cities. Eau Claire, WI ranks third. Appleton, WI; Plymouth, MN; Livonia, MI; and Oshkosh, WI also made the top 10. While each has its own unique particular areas of strength, Troy's first-place ranking is in part due to its residents having the most affordable housing relative to their incomes, with housing costs averaging 15.0% of the median household income of $109,444.
- Housing is the most expensive in these Florida and New Jersey cities. Small cities in the Sunshine and Garden states claim nine of the top 10 spots when it comes to the highest housing costs. Lauderhill, FL tops the list with residents paying 40.9% of their annual income toward housing. Other Florida cities at the top of the list include Kissimmee (36.5%), Pine Hills (36.2%), Doral (34.0%) and Tamarac (32.1%). New Jersey cities that top the list of least affordable housing also include Lakewood (36.0%), East Orange (36.0%), Passaic (32.6%) and Camden (32.5%).
- This Minnesota city has the lowest rate of poverty nationwide. Lakeville, MN, ranking 15th for overall livability, has only 2.3% of residents living below the poverty line. The median poverty rate across small U.S. cities sits at 11.3%.
- The average commute to work is just 13 minutes in this Illinois city. Commuters in Champaign, IL spend an average of 13.2 minutes going from home to work. While the city ranks 141st overall, it also has the fourth-highest concentration of accommodation and food service businesses study wide. Meanwhile, commuters in Tracy, CA have the longest commute time at 45.1 minutes.
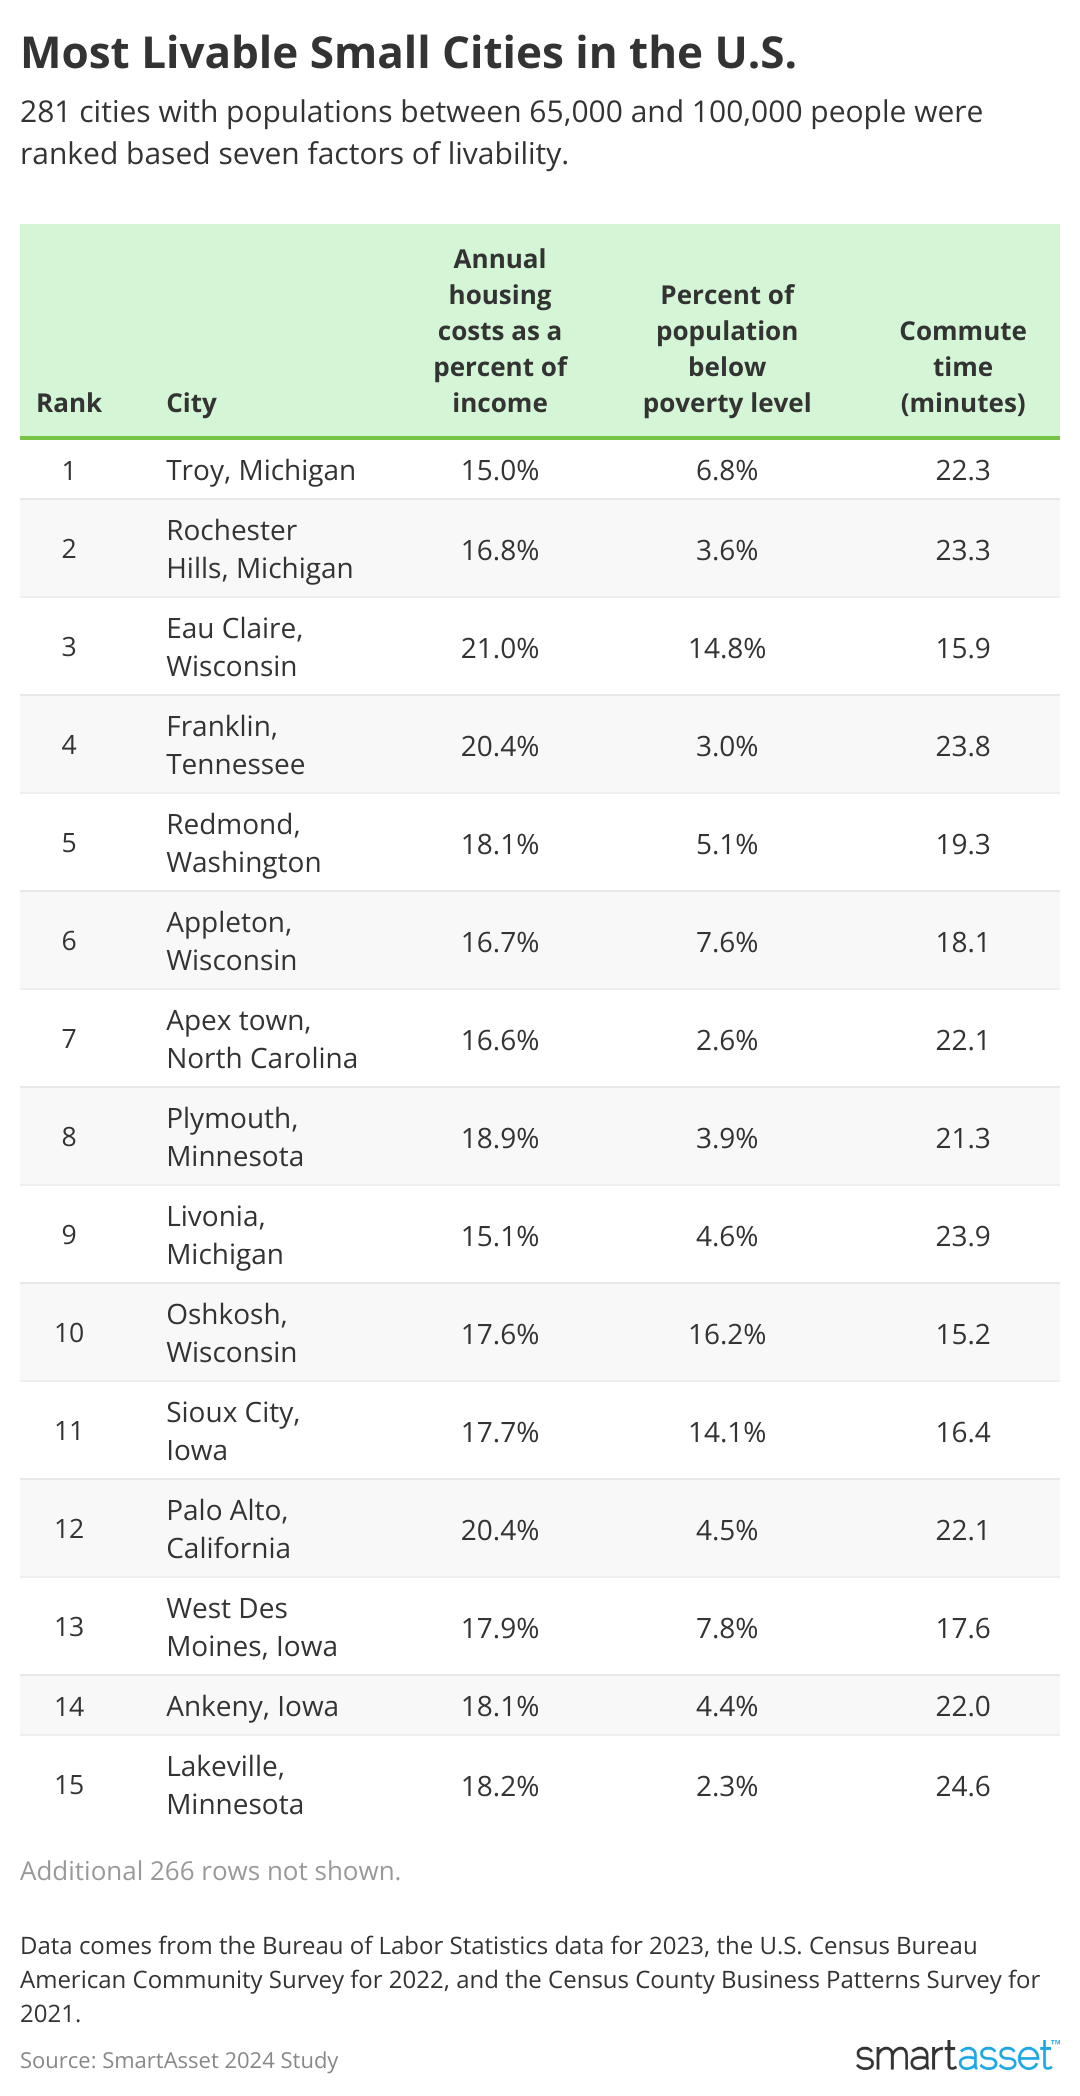
Top 20 Most Livable Small Cities
- Troy, Michigan
- Housing costs as a percent of income: 15.0%
- Median monthly housing costs: $1,365
- Median household income: $109,444
- Poverty rate: 6.8%
- County unemployment rate: 2.9%
- Residents covered by health insurance: 97.4%
- Mean commute time in minutes: 22.3
- Concentration of accommodation and food service businesses: 7.7%
- Concentration of arts, entertainment, and recreation businesses: 1.5%
- Concentration of healthcare businesses: 13.7%
- Rochester Hills, Michigan
- Housing costs as a percent of income: 16.8%
- Median monthly housing costs: $1,504
- Median household income: $107,137
- Poverty rate: 3.6%
- County unemployment rate: 2.9%
- Residents covered by health insurance: 97.7%
- Mean commute time in minutes: 23.3
- Concentration of accommodation and food service businesses: 7.7%
- Concentration of arts, entertainment, and recreation businesses: 1.5%
- Concentration of healthcare businesses: 13.7%
- Eau Claire, Wisconsin
- Housing costs as a percent of income: 21.0%
- Median monthly housing costs: $1,004
- Median household income: $57,289
- Poverty rate: 14.8%
- County unemployment rate: 2.7%
- Residents covered by health insurance: 94.0%
- Mean commute time in minutes: 15.9
- Concentration of accommodation and food service businesses: 10.6%
- Concentration of arts, entertainment, and recreation businesses: 2.2%
- Concentration of healthcare businesses: 15.3%
- Franklin, Tennessee
- Housing costs as a percent of income: 20.4%
- Median monthly housing costs: $1,846
- Median household income: $108,354
- Poverty rate: 3.0%
- County unemployment rate: 2.5%
- Residents covered by health insurance: 97.3%
- Mean commute time in minutes: 23.8
- Concentration of accommodation and food service businesses: 7.3%
- Concentration of arts, entertainment, and recreation businesses: 4.4%
- Concentration of healthcare businesses: 10.9%
- Redmond, Washington
- Housing costs as a percent of income: 18.1%
- Median monthly housing costs: $2,306
- Median household income: $152,851
- Poverty rate: 5.1%
- County unemployment rate: 3.4%
- Residents covered by health insurance: 95.9%
- Mean commute time in minutes: 19.3
- Concentration of accommodation and food service businesses: 9.3%
- Concentration of arts, entertainment, and recreation businesses: 1.9%
- Concentration of healthcare businesses: 11.8%
- Appleton, Wisconsin
- Housing costs as a percent of income: 16.7%
- Median monthly housing costs: $1,046
- Median household income: $75,262
- Poverty rate: 7.6%
- County unemployment rate: 2.6%
- Residents covered by health insurance: 94.9%
- Mean commute time in minutes: 18.1
- Concentration of accommodation and food service businesses: 9.4%
- Concentration of arts, entertainment, and recreation businesses: 1.6%
- Concentration of healthcare businesses: 10.3%
- Apex town, North Carolina
- Housing costs as a percent of income: 16.6%
- Median monthly housing costs: $1,752
- Median household income: $126,583
- Poverty rate: 2.6%
- County unemployment rate: 3.0%
- Residents covered by health insurance: 97.6%
- Mean commute time in minutes: 22.1
- Concentration of accommodation and food service businesses: 8.0%
- Concentration of arts, entertainment, and recreation businesses: 1.7%
- Concentration of healthcare businesses: 10.6%
- Plymouth, Minnesota
- Housing costs as a percent of income: 18.9%
- Median monthly housing costs: $1,684
- Median household income: $106,858
- Poverty rate: 3.9%
- County unemployment rate: 2.6%
- Residents covered by health insurance: 96.0%
- Mean commute time in minutes: 21.3
- Concentration of accommodation and food service businesses: 7.3%
- Concentration of arts, entertainment, and recreation businesses: 1.9%
- Concentration of healthcare businesses: 12.6%
- Livonia, Michigan
- Housing costs as a percent of income: 15.1%
- Median monthly housing costs: $1,159
- Median household income: $92,125
- Poverty rate: 4.6%
- County unemployment rate: 4.4%
- Residents covered by health insurance: 95.9%
- Mean commute time in minutes: 23.9
- Concentration of accommodation and food service businesses: 10.4%
- Concentration of arts, entertainment, and recreation businesses: 1.3%
- Concentration of healthcare businesses: 12.6%
- Oshkosh, Wisconsin
- Housing costs as a percent of income: 17.6%
- Median monthly housing costs: $855
- Median household income: $58,134
- Poverty rate: 16.2%
- County unemployment rate: 2.7%
- Residents covered by health insurance: 88.2%
- Mean commute time in minutes: 15.2
- Concentration of accommodation and food service businesses: 10.4%
- Concentration of arts, entertainment, and recreation businesses: 2.3%
- Concentration of healthcare businesses: 13.8%
- Sioux City, Iowa
- Housing costs as a percent of income: 17.7%
- Median monthly housing costs: $914
- Median household income: $61,836
- Poverty rate: 14.1%
- County unemployment rate: 2.9%
- Residents covered by health insurance: 94.0%
- Mean commute time in minutes: 16.4
- Concentration of accommodation and food service businesses: 9.8%
- Concentration of arts, entertainment, and recreation businesses: 1.9%
- Concentration of healthcare businesses: 12.4%
- Palo Alto, California
- Housing costs as a percent of income: 20.4%
- Median monthly housing costs: $3,058
- Median household income: $179,707
- Poverty rate: 4.5%
- County unemployment rate: 3.5%
- Residents covered by health insurance: 97.1%
- Mean commute time in minutes: 22.1
- Concentration of accommodation and food service businesses: 10.1%
- Concentration of arts, entertainment, and recreation businesses: 1.4%
- Concentration of healthcare businesses: 12.5%
- West Des Moines, Iowa
- Housing costs as a percent of income: 17.9%
- Median monthly housing costs: $1,277
- Median household income: $85,731
- Poverty rate: 7.8%
- County unemployment rate: 2.9%
- Residents covered by health insurance: 94.5%
- Mean commute time in minutes: 17.6
- Concentration of accommodation and food service businesses: 8.8%
- Concentration of arts, entertainment, and recreation businesses: 1.5%
- Concentration of healthcare businesses: 10.7%
- Ankeny, Iowa
- Housing costs as a percent of income: 18.1%
- Median monthly housing costs: $1,560
- Median household income: $103,578
- Poverty rate: 4.4%
- County unemployment rate: 2.9%
- Residents covered by health insurance: 96.5%
- Mean commute time in minutes: 22
- Concentration of accommodation and food service businesses: 8.8%
- Concentration of arts, entertainment, and recreation businesses: 1.5%
- Concentration of healthcare businesses: 10.7%
- Lakeville, Minnesota
- Housing costs as a percent of income: 18.2%
- Median monthly housing costs: $1,888
- Median household income: $124,452
- Poverty rate: 2.3%
- County unemployment rate: 2.6%
- Residents covered by health insurance: 98.0%
- Mean commute time in minutes: 24.6
- Concentration of accommodation and food service businesses: 6.7%
- Concentration of arts, entertainment, and recreation businesses: 1.8%
- Concentration of healthcare businesses: 11.7%
- Woodbury, Minnesota
- Housing costs as a percent of income: 18.6%
- Median monthly housing costs: $1,815
- Median household income: $117,201
- Poverty rate: 4.5%
- County unemployment rate: 2.4%
- Residents covered by health insurance: 94.2%
- Mean commute time in minutes: 24
- Concentration of accommodation and food service businesses: 7.2%
- Concentration of arts, entertainment, and recreation businesses: 2.3%
- Concentration of healthcare businesses: 12.7%
- Milpitas, California
- Housing costs as a percent of income: 20.4%
- Median monthly housing costs: $2,882
- Median household income: $169,818
- Poverty rate: 3.9%
- County unemployment rate: 3.5%
- Residents covered by health insurance: 96.6%
- Mean commute time in minutes: 23.1
- Concentration of accommodation and food service businesses: 10.1%
- Concentration of arts, entertainment, and recreation businesses: 1.4%
- Concentration of healthcare businesses: 12.5%
- Maple Grove, Minnesota
- Housing costs as a percent of income: 18.3%
- Median monthly housing costs: $1,707
- Median household income: $111,829
- Poverty rate: 5.8%
- County unemployment rate: 2.6%
- Residents covered by health insurance: 96.8%
- Mean commute time in minutes: 23.7
- Concentration of accommodation and food service businesses: 7.3%
- Concentration of arts, entertainment, and recreation businesses: 1.9%
- Concentration of healthcare businesses: 12.6%
- Bismarck, North Dakota
- Housing costs as a percent of income: 16.3%
- Median monthly housing costs: $1,010
- Median household income: $74,247
- Poverty rate: 13.1%
- County unemployment rate: 1.7%
- Residents covered by health insurance: 91.8%
- Mean commute time in minutes: 14.9
- Concentration of accommodation and food service businesses: 7.1%
- Concentration of arts, entertainment, and recreation businesses: 1.6%
- Concentration of healthcare businesses: 10.8%
- Idaho Falls, Idaho
- Housing costs as a percent of income: 16.5%
- Median monthly housing costs: $993
- Median household income: $72,007
- Poverty rate: 10.6%
- County unemployment rate: 2.6%
- Residents covered by health insurance: 90.7%
- Mean commute time in minutes: 21.1
- Concentration of accommodation and food service businesses: 6.6%
- Concentration of arts, entertainment, and recreation businesses: 1.2%
- Concentration of healthcare businesses: 16.8%
Data and Methodology
To find the most livable small cities in America, SmartAsset reviewed data for 281 cities with a population between 65,000 and 100,000 across the following metrics:
- Housing costs as a percentage of household income. This is the median housing cost divided by median household income. Data comes from the Census Bureau's 2022 1-year American Community Survey.
- Percentage of residents below the poverty line. Data comes from the Census Bureau's 2022 1-year American Community Survey.
- Unemployment rate. County-level data comes from the Bureau of Labor Statistics for 2023.
- Percentage of residents with health insurance. Data comes from the Census Bureau's 2022 1-year American Community Survey.
- Average commute time. This measures a worker's average commute time in minutes. Data comes from the Census Bureau's 2022 1-year American Community Survey.
Half-weighted metrics come from the Census Bureau's 2021 County Business Patterns survey and are at the county level.
- Proportion of arts, entertainment and recreation establishments. Data comes from the Census Bureau's 2021 County Business Patterns Survey.
- Proportion of accommodation and food service establishments. Data comes from the Census Bureau's 2021 County Business Patterns Survey.
- Proportion of healthcare establishments. Data comes from the Census Bureau's 2021 County Business Patterns Survey.