Most diverse counties in Maine

·Stacker

Canva
Canva

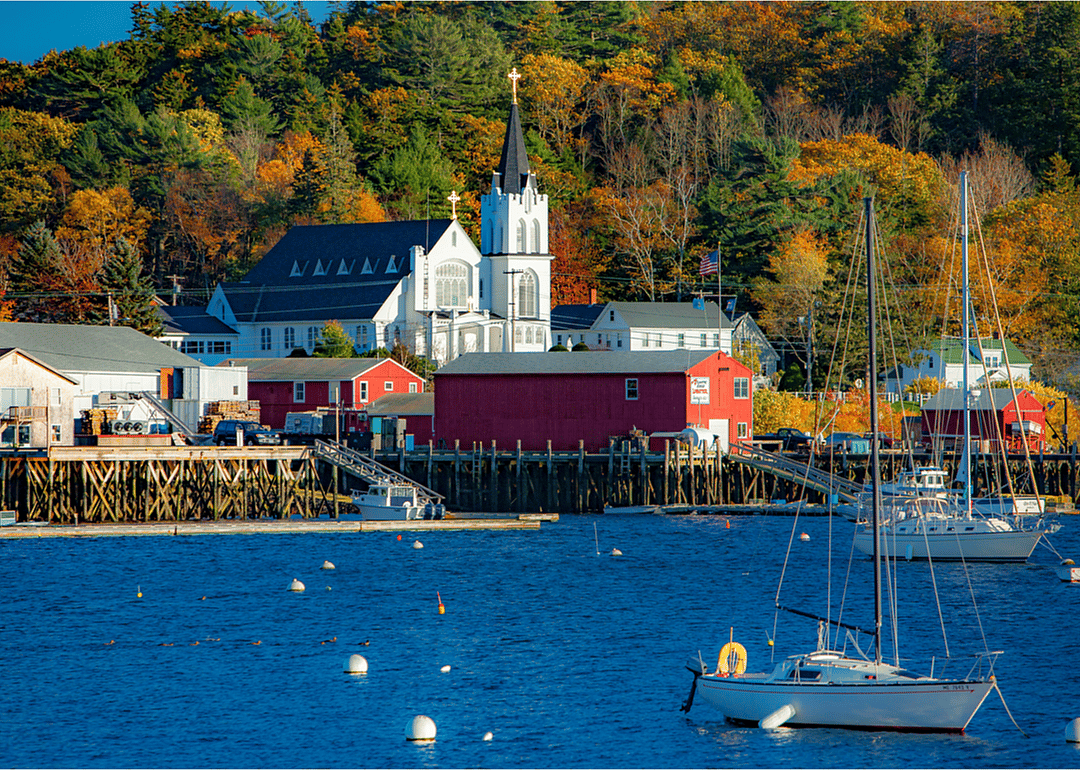
The United States has a longstanding reputation as being a melting pot (or salad bowl), with its diversity manifesting itself across many different demographics. However, some places across the country are notably more heterogeneous than others.

Stacker compiled a list of the most diverse counties in Maine using data from using data from the U.S. Census Bureau. Counties are ranked by the highest Simpson's diversity index score. Simpson's diversity index measures community diversity on a scale of 0 (least diverse) to 1 (most diverse), more on the calculation can be read here.

Think you know which counties in your home state might be the most diverse? Keep reading to see if your predictions are correct.

You may also like: Most common dog breeds available for adoption in Maine

#16. Lincoln County

Bob Pool // Shutterstock

1 / 16

#16. Lincoln County

- Index: 0.061
- Total population: 34,201
- White: 96.9% (33,143)
- Black or African American: 0.4% (129)
- American Indian and Alaska Native: 0.4% (148)
- Asian: 1.0% (340)
- Native Hawaiian and other Pacific Islander: 0.0% (0)
- 2 or more races: 1.1% (367)
- Some other Race: 0.2% (74)
#15. Somerset County

Halpaugh // Wikimedia Commons

2 / 16

#15. Somerset County

- Index: 0.068
- Total population: 50,520
- White: 96.5% (48,759)
- Black or African American: 0.6% (313)
- American Indian and Alaska Native: 0.5% (244)
- Asian: 0.4% (194)
- Native Hawaiian and other Pacific Islander: 0.0% (0)
- 2 or more races: 1.9% (950)
- Some other Race: 0.1% (60)
#14. Franklin County

Jon Platek // Wikimedia Commons

3 / 16

#14. Franklin County

- Index: 0.069
- Total population: 29,982
- White: 96.5% (28,920)
- Black or African American: 0.2% (73)
- American Indian and Alaska Native: 0.1% (39)
- Asian: 0.4% (113)
- Native Hawaiian and other Pacific Islander: 0.2% (61)
- 2 or more races: 2.4% (707)
- Some other Race: 0.2% (69)
#13. Oxford County

Magicpiano // Wikimedia Commons

4 / 16

#13. Oxford County

- Index: 0.073
- Total population: 57,550
- White: 96.2% (55,391)
- Black or African American: 0.4% (212)
- American Indian and Alaska Native: 0.3% (182)
- Asian: 0.4% (217)
- Native Hawaiian and other Pacific Islander: 0.0% (7)
- 2 or more races: 2.5% (1,453)
- Some other Race: 0.2% (88)
#12. Waldo County

Bruce C. Cooper // Wikimedia Commons

5 / 16

#12. Waldo County

- Index: 0.074
- Total population: 39,539
- White: 96.2% (38,044)
- Black or African American: 0.6% (234)
- American Indian and Alaska Native: 0.4% (176)
- Asian: 0.5% (182)
- Native Hawaiian and other Pacific Islander: 0.0% (0)
- 2 or more races: 1.9% (748)
- Some other Race: 0.4% (155)

You may also like: Counties with the most veterans in Maine

#11. Knox County

E.J.Johnson Photography // Shutterstock

6 / 16

#11. Knox County

- Index: 0.076
- Total population: 39,759
- White: 96.1% (38,200)
- Black or African American: 0.5% (205)
- American Indian and Alaska Native: 0.5% (201)
- Asian: 0.5% (201)
- Native Hawaiian and other Pacific Islander: 0.0% (2)
- 2 or more races: 2.1% (842)
- Some other Race: 0.3% (108)
#10. Hancock County

liz west // Wikimedia Commons

7 / 16

#10. Hancock County

- Index: 0.081
- Total population: 54,601
- White: 95.9% (52,344)
- Black or African American: 0.9% (469)
- American Indian and Alaska Native: 0.5% (254)
- Asian: 1.1% (624)
- Native Hawaiian and other Pacific Islander: 0.1% (75)
- 2 or more races: 1.4% (770)
- Some other Race: 0.1% (65)
#9. Piscataquis County

Magicpiano // Wikimedia Commons

8 / 16

#9. Piscataquis County

- Index: 0.082
- Total population: 16,836
- White: 95.8% (16,128)
- Black or African American: 0.6% (96)
- American Indian and Alaska Native: 0.8% (135)
- Asian: 0.8% (131)
- Native Hawaiian and other Pacific Islander: 0.0% (0)
- 2 or more races: 1.3% (227)
- Some other Race: 0.7% (119)
#8. Sagadahoc County

Jameslwoodward // Wikimedia Commons

9 / 16

#8. Sagadahoc County

- Index: 0.083
- Total population: 35,452
- White: 95.7% (33,941)
- Black or African American: 0.8% (278)
- American Indian and Alaska Native: 0.4% (127)
- Asian: 0.8% (271)
- Native Hawaiian and other Pacific Islander: 0.0% (0)
- 2 or more races: 2.2% (777)
- Some other Race: 0.2% (58)
#7. Kennebec County

Calvin Beale // Wikimedia Commons

10 / 16

#7. Kennebec County

- Index: 0.083
- Total population: 121,753
- White: 95.7% (116,530)
- Black or African American: 0.9% (1,039)
- American Indian and Alaska Native: 0.5% (661)
- Asian: 0.9% (1,108)
- Native Hawaiian and other Pacific Islander: 0.1% (85)
- 2 or more races: 1.7% (2,106)
- Some other Race: 0.2% (224)

You may also like: Maine has 1 billionaire, see who they are

#6. York County

Michael Murphy // Wikimedia Commons

11 / 16

#6. York County

- Index: 0.087
- Total population: 204,316
- White: 95.5% (195,143)
- Black or African American: 0.9% (1,778)
- American Indian and Alaska Native: 0.4% (903)
- Asian: 1.3% (2,580)
- Native Hawaiian and other Pacific Islander: 0.0% (53)
- 2 or more races: 1.7% (3,403)
- Some other Race: 0.2% (456)
#5. Aroostook County

Doug Kerr // Wikimedia Commons

12 / 16

#5. Aroostook County

- Index: 0.098
- Total population: 67,809
- White: 94.9% (64,373)
- Black or African American: 1.0% (682)
- American Indian and Alaska Native: 1.9% (1,275)
- Asian: 0.5% (318)
- Native Hawaiian and other Pacific Islander: 0.0% (12)
- 2 or more races: 1.6% (1,053)
- Some other Race: 0.1% (96)
#4. Penobscot County

Wangkun Jia // Shutterstock

13 / 16

#4. Penobscot County

- Index: 0.106
- Total population: 151,774
- White: 94.5% (143,465)
- Black or African American: 0.9% (1,291)
- American Indian and Alaska Native: 1.3% (1,910)
- Asian: 1.0% (1,492)
- Native Hawaiian and other Pacific Islander: 0.0% (58)
- 2 or more races: 2.0% (3,096)
- Some other Race: 0.3% (462)
14 / 16

#3. Cumberland County

- Index: 0.156
- Total population: 292,307
- White: 91.7% (268,151)
- Black or African American: 3.0% (8,863)
- American Indian and Alaska Native: 0.2% (578)
- Asian: 2.2% (6,350)
- Native Hawaiian and other Pacific Islander: 0.0% (34)
- 2 or more races: 2.5% (7,240)
- Some other Race: 0.4% (1,091)
#2. Androscoggin County

Starspiker // Wikimedia Commons

15 / 16

#2. Androscoggin County

- Index: 0.161
- Total population: 107,602
- White: 91.4% (98,386)
- Black or African American: 2.4% (2,562)
- American Indian and Alaska Native: 0.2% (162)
- Asian: 0.8% (839)
- Native Hawaiian and other Pacific Islander: 0.0% (0)
- 2 or more races: 5.0% (5,386)
- Some other Race: 0.2% (267)

You may also like: Counties with the most pre-war homes in Maine

#1. Washington County

P199 // Wikimedia Commons

16 / 16

#1. Washington County

- Index: 0.172
- Total population: 31,491
- White: 90.8% (28,604)
- Black or African American: 0.8% (244)
- American Indian and Alaska Native: 5.3% (1,665)
- Asian: 0.5% (149)
- Native Hawaiian and other Pacific Islander: 0.0% (9)
- 2 or more races: 2.1% (671)
- Some other Race: 0.5% (149)