Stacker compiled a list of the counties with the best commutes in Maryland using data from the U.S. Census Bureau. Counties are ranked by the shortest average travel time to work, with ties broken by lowest percent of residents that commute over 60 minutes, and any further ties broken by lowest percent of residents that work outside the county of residence.
You may also like: Counties with the most veterans in Maryland
#24. Charles County
- Mean travel time to work: 44.6
- Workers with 60+ minute commute: 33.6%
- Worked outside of county of residence: 27.6%
#23. Calvert County
- Mean travel time to work: 40.7
- Workers with 60+ minute commute: 27.2%
- Worked outside of county of residence: 38.6%
#22. Prince George's County
- Mean travel time to work: 36.5
- Workers with 60+ minute commute: 18.5%
- Worked outside of county of residence: 17.8%
#21. Carroll County
- Mean travel time to work: 35.7
- Workers with 60+ minute commute: 19.7%
- Worked outside of county of residence: 46.7%
Malachi Jacobs // Shutterstock
6 / 24#19. Queen Anne's County
- Mean travel time to work: 34.5
- Workers with 60+ minute commute: 19.7%
- Worked outside of county of residence: 44.2%
#18. Montgomery County
- Mean travel time to work: 33.8
- Workers with 60+ minute commute: 15.5%
- Worked outside of county of residence: 10.3%
Chris Guy Jr // Shutterstock
8 / 24#17. Caroline County
- Mean travel time to work: 32.8
- Workers with 60+ minute commute: 15.5%
- Worked outside of county of residence: 48.6%
#16. Harford County
- Mean travel time to work: 32.4
- Workers with 60+ minute commute: 13.4%
- Worked outside of county of residence: 39.1%
Malachi Jacobs // Shutterstock
11 / 24#14. St. Mary's County
- Mean travel time to work: 30.5
- Workers with 60+ minute commute: 15.2%
- Worked outside of county of residence: 15.3%
#13. Anne Arundel County
- Mean travel time to work: 30.5
- Workers with 60+ minute commute: 12.6%
- Worked outside of county of residence: 29.7%
#12. Howard County
- Mean travel time to work: 30.4
- Workers with 60+ minute commute: 11.6%
- Worked outside of county of residence: 44.9%
#11. Cecil County
- Mean travel time to work: 29.8
- Workers with 60+ minute commute: 10.6%
- Worked outside of county of residence: 21.5%
#9. Baltimore County
- Mean travel time to work: 29.1
- Workers with 60+ minute commute: 9.2%
- Worked outside of county of residence: 43.5%
#8. Kent County
- Mean travel time to work: 28.4
- Workers with 60+ minute commute: 17.5%
- Worked outside of county of residence: 17.7%
#7. Talbot County
- Mean travel time to work: 27.2
- Workers with 60+ minute commute: 13.2%
- Worked outside of county of residence: 21.2%
#6. Dorchester County
- Mean travel time to work: 26.8
- Workers with 60+ minute commute: 10.3%
- Worked outside of county of residence: 36.2%
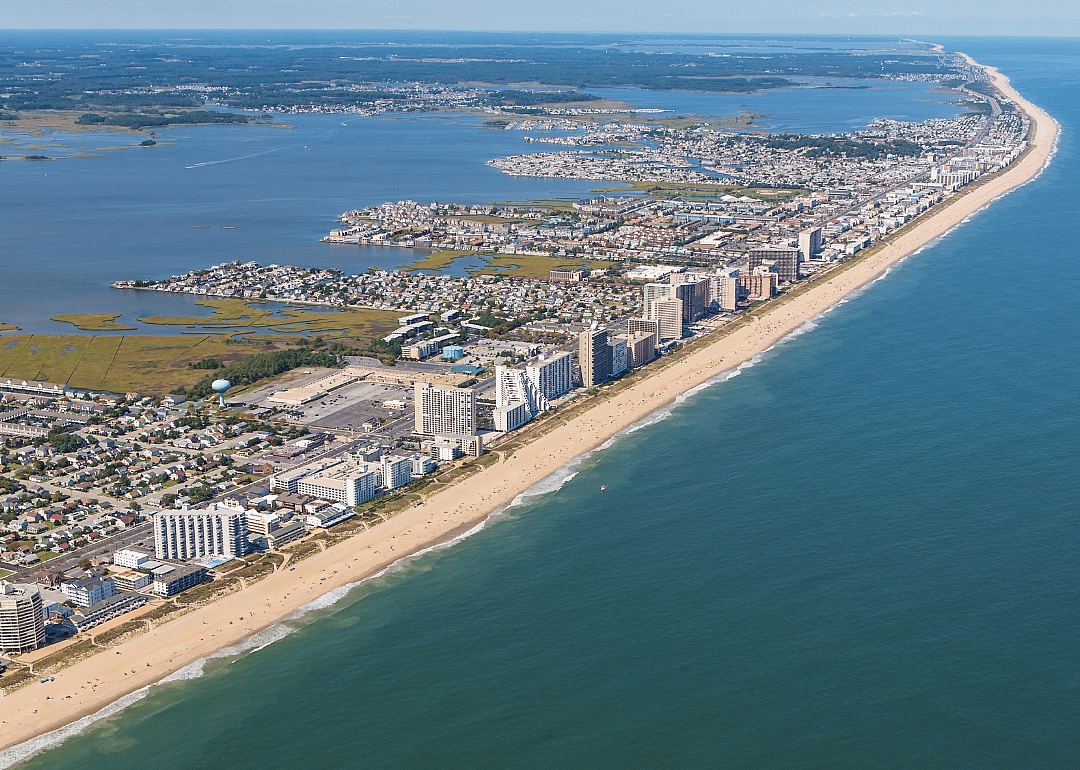
#4. Worcester County
- Mean travel time to work: 23.7
- Workers with 60+ minute commute: 6.2%
- Worked outside of county of residence: 17.7%
#3. Somerset County
- Mean travel time to work: 23.5
- Workers with 60+ minute commute: 5.3%
- Worked outside of county of residence: 39.4%
#2. Allegany County
- Mean travel time to work: 23.0
- Workers with 60+ minute commute: 8.1%
- Worked outside of county of residence: 5.3%
#1. Wicomico County
- Mean travel time to work: 22.6
- Workers with 60+ minute commute: 5.8%
- Worked outside of county of residence: 16.6%