MoneyGeek
1 / 4Comparing rough roads and infrastructure spending by state
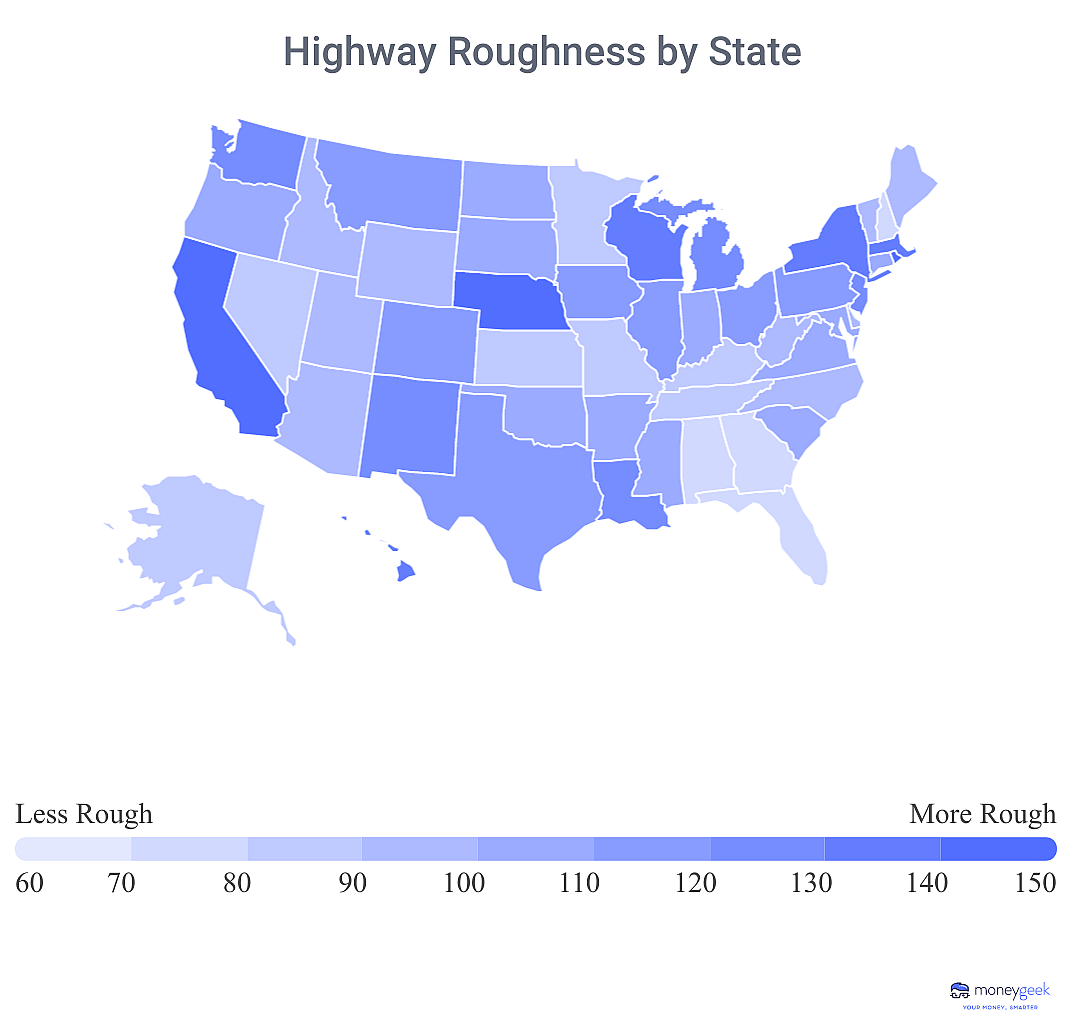
MoneyGeek analyzed overall road quality and the investment levels per lane mile in every state and found that more spending on roads did not necessarily lead to better road quality.
The road roughness index is the weighted average value of the observed measurements of the international roughness index (IRI) for the state. The higher the score, the more rough the road is. The Federal Highway Administration indicates that an IRI measure of less than 95 indicates a road in good condition, between 95 and 170 is acceptable, and greater than 170 is poor condition.
For example, California's roughness index score of 160 means that the state's road conditions are borderline acceptable, on average. In reality, 44% of California's roads are in poor condition, the most of any state in the U.S.
These 10 states have the roughest roads in America
10. New Jersey
Average Road Roughness Score (higher = worse): 123
% of Roads in Poor Condition: 26%
% of Roads in Good Condition: 44%
Total Highway Spend: $6.9B
Spend Per Lane Mile: $30.39
9. Michigan
Average Road Roughness Score: 128
% of Roads in Poor Condition: 24%
% of Roads in Good Condition: 38%
Total Highway Spend: $7.8B
Spend Per Lane Mile: $7.74
8. Louisiana
Average Road Roughness Score: 128
% of Roads in Poor Condition: 26%
% of Roads in Good Condition: 36%
Total Highway Spend: $3.5B
Spend Per Lane Mile: $9.66
7. Massachusetts
Average Road Roughness Score: 131
% of Roads in Poor Condition: 31%
% of Roads in Good Condition: 37%
Total Highway Spend: $5.0B
Spend Per Lane Mile: $21.03
6. Hawaii
Average Road Roughness Score: 134
% of Roads in Poor Condition: 25%
% of Roads in Good Condition: 28%
Total Highway Spend: $1.0B
Spend Per Lane Mile: $28.87
5. New York
Average Road Roughness Score: 137
% of Roads in Poor Condition: 30%
% of Roads in Good Condition: 34%
Total Highway Spend: $16.6B
Spend Per Lane Mile: $24.84
4. Wisconsin
Average Road Roughness Score: 139
% of Roads in Poor Condition: 28%
% of Roads in Good Condition: 25%
Total Highway Spend: $7.5B
Spend Per Lane Mile: $11.32
3. Nebraska
Average Road Roughness Score: 141
% of Roads in Poor Condition: 33%
% of Roads in Good Condition: 33%
Total Highway Spend: $3.0B
Spend Per Lane Mile: $5.66
2. Rhode Island
Average Road Roughness Score: 149
% of Roads in Poor Condition: 41%
% of Roads in Good Condition: 27%
Total Highway Spend: $1.3B
Spend Per Lane Mile: $42.37
1. California
Average Road Roughness Score: 160
% of Roads in Poor Condition: 44%
% of Roads in Good Condition: 22%
Total Highway Spend: $32.0B
Spend Per Lane Mile: $23.16