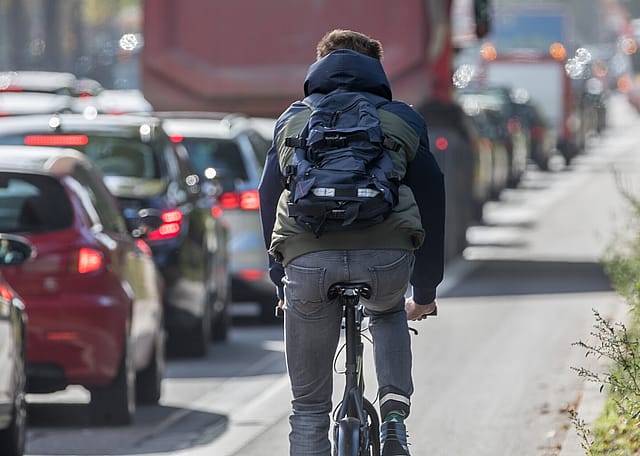
Stacker compiled a list of the counties with the best commutes in New Mexico using data from the U.S. Census Bureau. Counties are ranked by the shortest average travel time to work, with ties broken by lowest percent of residents that commute over 60 minutes, and any further ties broken by lowest percent of residents that work outside the county of residence.
You may also like: Hottest Decembers in New Mexico since 1895
AllenS // Wikimedia Commons
1 / 33#33. Mora County
- Mean travel time to work: 59.5
- Workers with 60+ minute commute: 39.5%
- Worked outside of county of residence: 65.3%
AllenS // Wikimedia Commons
2 / 33#32. Torrance County
- Mean travel time to work: 37.4
- Workers with 60+ minute commute: 22.7%
- Worked outside of county of residence: 58.7%
Carptrash // Wikimedia Commons
3 / 33#31. Rio Arriba County
- Mean travel time to work: 29.3
- Workers with 60+ minute commute: 9.8%
- Worked outside of county of residence: 46.0%
Drmccreedy // Wikimedia Commons
4 / 33#30. Valencia County
- Mean travel time to work: 29.0
- Workers with 60+ minute commute: 7.4%
- Worked outside of county of residence: 41.4%
turtix // Shutterstock
5 / 33Vacaypicts // Wikimedia Commons
6 / 33#28. Harding County
- Mean travel time to work: 25.6
- Workers with 60+ minute commute: 16.1%
- Worked outside of county of residence: 33.8%
StockPhotoAstur // Shutterstock
7 / 33#27. McKinley County
- Mean travel time to work: 24.1
- Workers with 60+ minute commute: 7.6%
- Worked outside of county of residence: 5.0%
#26. San Juan County
- Mean travel time to work: 23.8
- Workers with 60+ minute commute: 8.1%
- Worked outside of county of residence: 2.2%
AllenS // Wikimedia Commons
9 / 33#25. Lea County
- Mean travel time to work: 23.7
- Workers with 60+ minute commute: 12.4%
- Worked outside of county of residence: 2.1%
Calvin Beale // Wikimedia Commons
10 / 33#23. Cibola County
- Mean travel time to work: 23.3
- Workers with 60+ minute commute: 9.5%
- Worked outside of county of residence: 16.5%
Jimack // Shutterstock
12 / 33#22. Santa Fe County
- Mean travel time to work: 23.1
- Workers with 60+ minute commute: 5.8%
- Worked outside of county of residence: 14.2%
David Langford // Shutterstock
13 / 33#21. Doña Ana County
- Mean travel time to work: 22.7
- Workers with 60+ minute commute: 6.5%
- Worked outside of county of residence: 2.7%
Wordbuilder // Wikimedia Commons
14 / 33#20. Union County
- Mean travel time to work: 22.7
- Workers with 60+ minute commute: 4.7%
- Worked outside of county of residence: 0.3%
M.Bucka // Wikimedia Commons
15 / 33Kristi Blokhin // Shutterstock
16 / 33#18. Otero County
- Mean travel time to work: 21.4
- Workers with 60+ minute commute: 7.2%
- Worked outside of county of residence: 6.4%
KeanoManu // Wikimedia Commons
17 / 33#17. San Miguel County
- Mean travel time to work: 20.9
- Workers with 60+ minute commute: 8.9%
- Worked outside of county of residence: 18.7%
#16. Eddy County
- Mean travel time to work: 20.9
- Workers with 60+ minute commute: 8.4%
- Worked outside of county of residence: 3.1%
Lochaven // Wikimedia Commons
19 / 33#15. Taos County
- Mean travel time to work: 20.7
- Workers with 60+ minute commute: 5.9%
- Worked outside of county of residence: 9.6%
Peter Potrowl // Wikimedia Commons
20 / 33AllenS // Wikimedia Commons
21 / 33#13. Luna County
- Mean travel time to work: 19.9
- Workers with 60+ minute commute: 7.7%
- Worked outside of county of residence: 7.3%
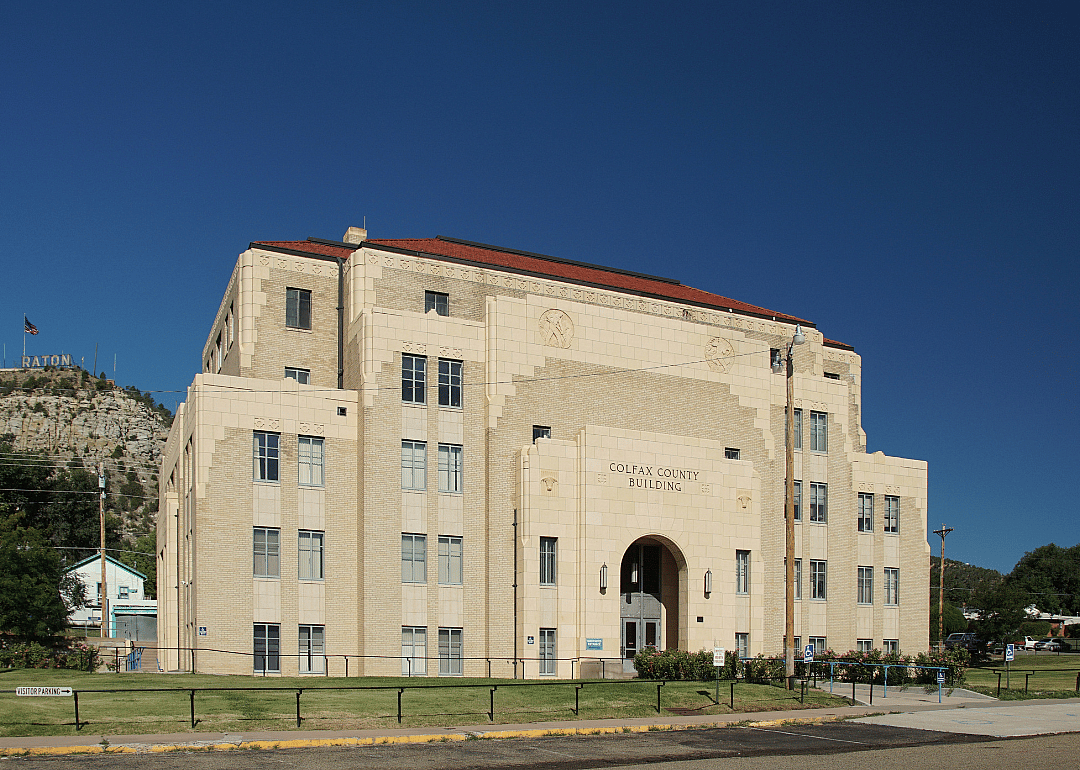
#12. Colfax County
- Mean travel time to work: 19.7
- Workers with 60+ minute commute: 7.9%
- Worked outside of county of residence: 5.3%
Underawesternsky // Shutterstock
23 / 33#11. Grant County
- Mean travel time to work: 19.6
- Workers with 60+ minute commute: 5.4%
- Worked outside of county of residence: 3.3%
U.S. Army Corps of Engineers // Wikimedia Commons
24 / 33#10. Guadalupe County
- Mean travel time to work: 19.3
- Workers with 60+ minute commute: 6.4%
- Worked outside of county of residence: 9.6%
Gestalt Imagery // Shutterstock
25 / 33#8. Socorro County
- Mean travel time to work: 18.3
- Workers with 60+ minute commute: 6.2%
- Worked outside of county of residence: 12.5%
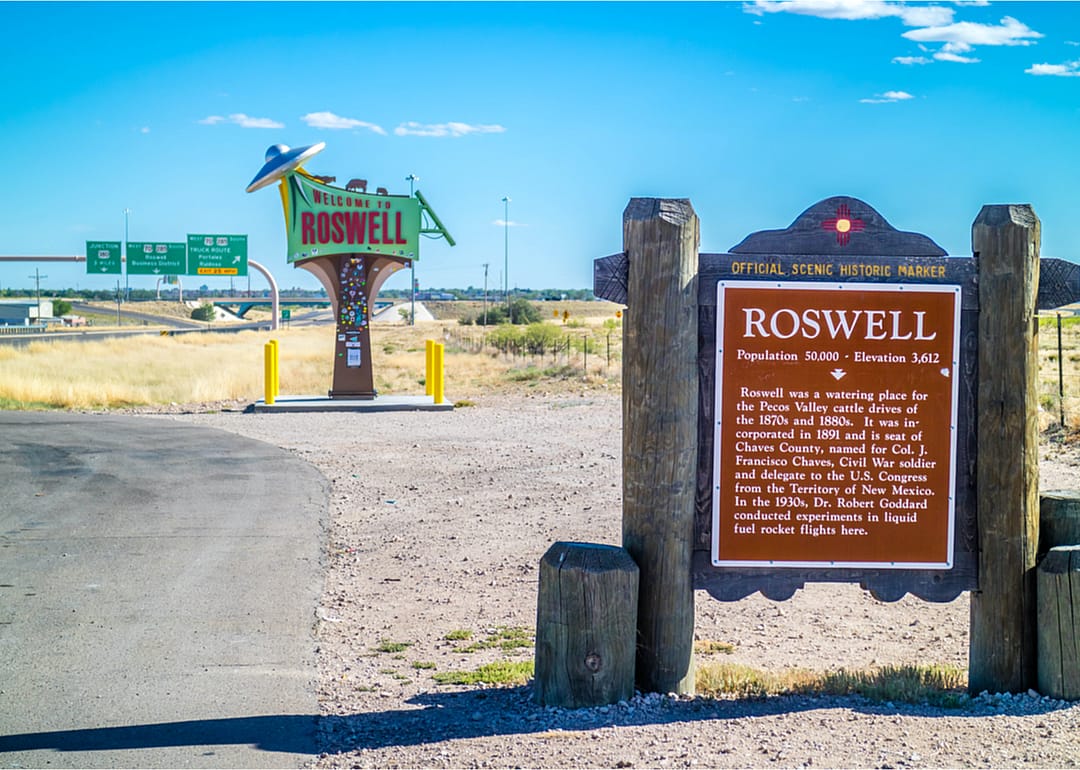
Cheri Alguire // Shutterstock
27 / 33#7. Chaves County
- Mean travel time to work: 17.8
- Workers with 60+ minute commute: 4.8%
- Worked outside of county of residence: 9.6%
Wordbuilder // Wikimedia Commons
28 / 33#6. Roosevelt County
- Mean travel time to work: 17.0
- Workers with 60+ minute commute: 3.2%
- Worked outside of county of residence: 27.4%
psyberartist // Wikimedia Commons
29 / 33#5. Sierra County
- Mean travel time to work: 16.4
- Workers with 60+ minute commute: 8.9%
- Worked outside of county of residence: 4.8%
Billy Hathorn // Wikimedia Commons
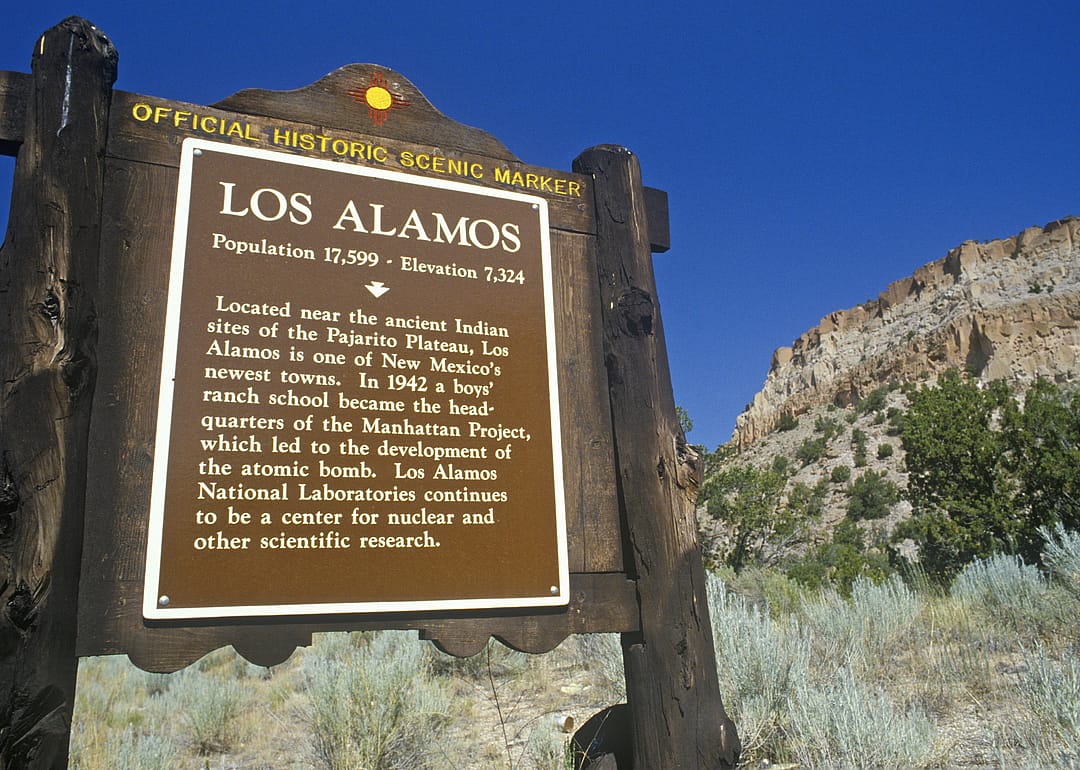
30 / 33Joseph Sohm // Shutterstock
31 / 33#3. Los Alamos County
- Mean travel time to work: 15.9
- Workers with 60+ minute commute: 0.8%
- Worked outside of county of residence: 3.6%
Tony Hisgett // Wikimedia Commons
32 / 33#2. Quay County
- Mean travel time to work: 15.2
- Workers with 60+ minute commute: 7.1%
- Worked outside of county of residence: 11.8%
Wordbuilder // Wikimedia Commons
33 / 33#1. De Baca County
- Mean travel time to work: 11.7
- Workers with 60+ minute commute: 5.0%
- Worked outside of county of residence: 6.8%