Counties with the highest cancer rates in New Mexico

·Stacker

Canva
Canva

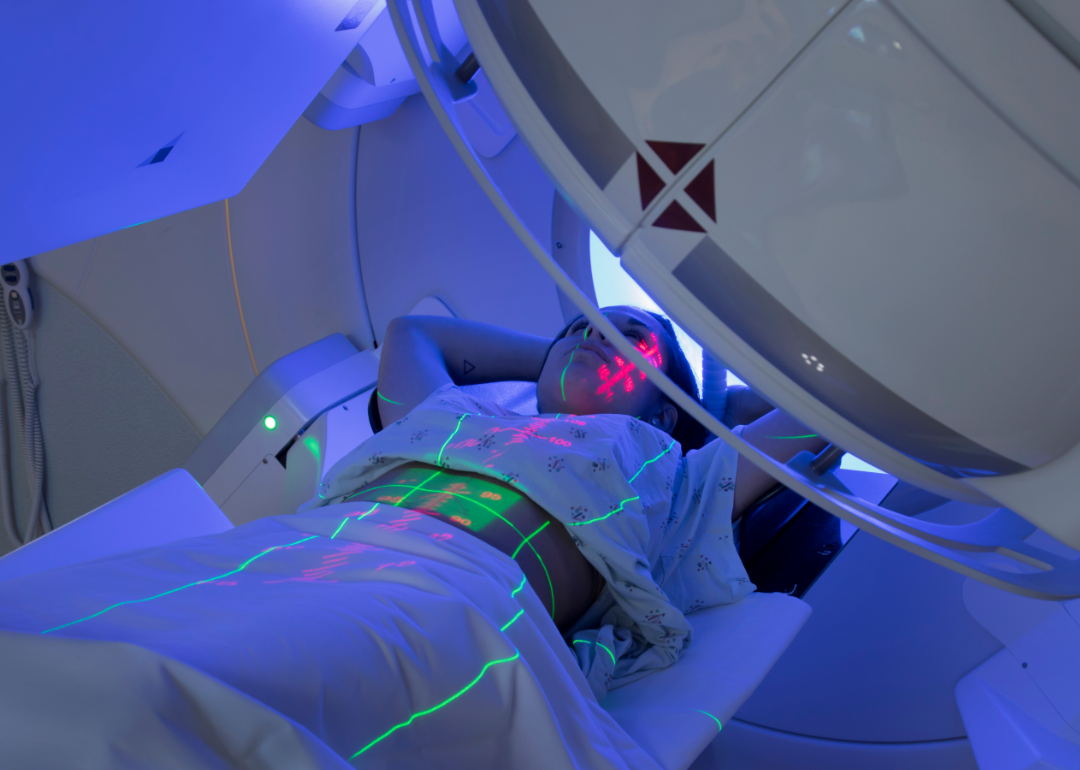
Several factors contribute to cancer rates, from personal habits and genetics to air pollution or groundwater quality in a given area. People experiencing social, economic, or environmental disadvantages are disproportionately affected by high cancer rates in certain regions—including access or barriers to early screening and care.

Cancer rates also fluctuate by jobs: Higher rates of cancer can be found among meat industry and rubber manufacturing workers, and farmers.

Stacker compiled the counties with the highest cancer rates in New Mexico using data from the CDC. Keep reading to see where in your state cancer cases are the most common.

#33. McKinley County
StockPhotoAstur // Shutterstock

1 / 33

#33. McKinley County

- Cancer rate per 100,000, 2016-2020: 303.0
- Age-adjusted rate per 100,000, 2016-2020: 304.1
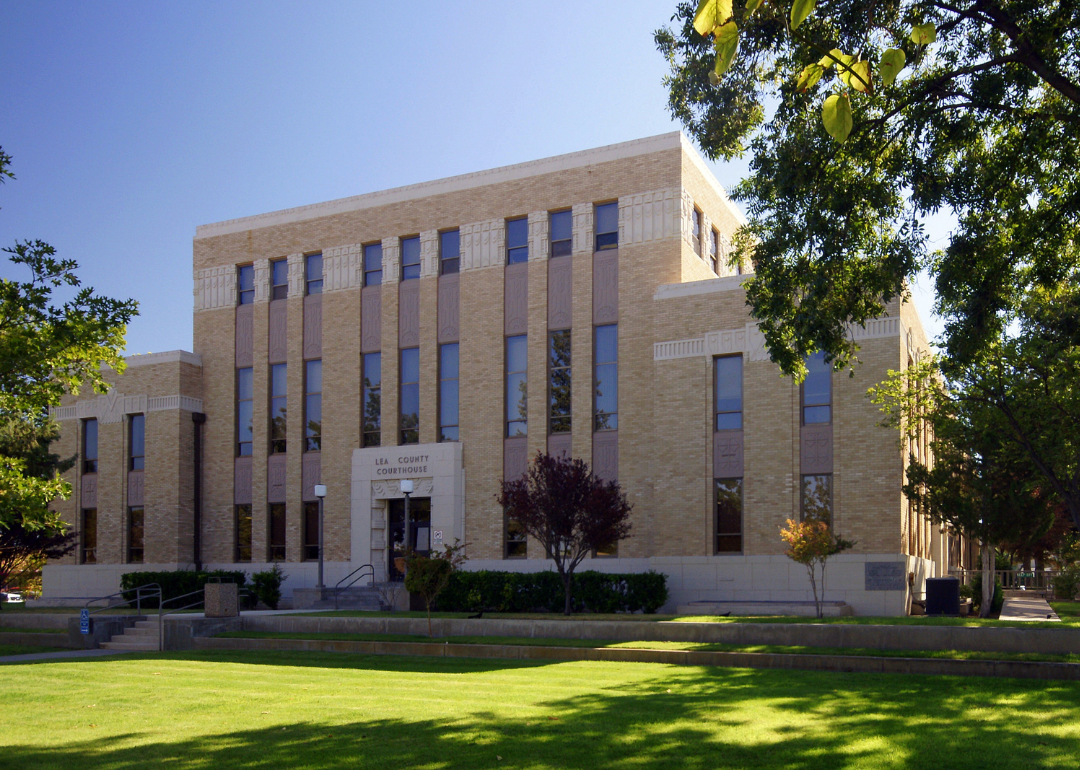
#32. Lea County

Canva

2 / 33

#32. Lea County

- Cancer rate per 100,000, 2016-2020: 338.8
- Age-adjusted rate per 100,000, 2016-2020: 366.1
#31. Curry County

Canva

3 / 33

#31. Curry County

- Cancer rate per 100,000, 2016-2020: 344.6
- Age-adjusted rate per 100,000, 2016-2020: 350.3
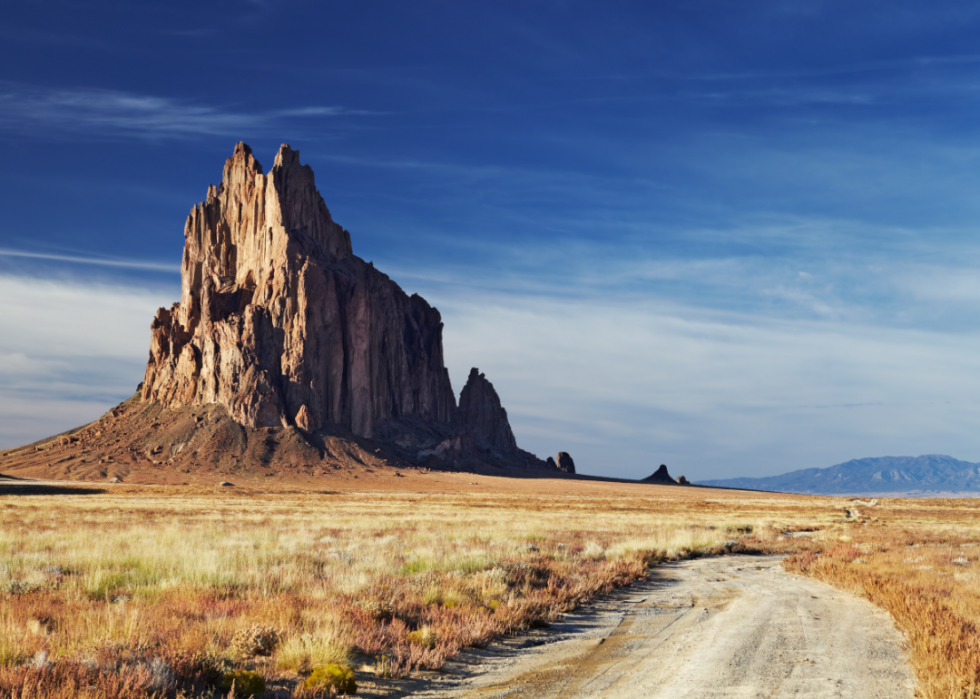
#30. San Juan County

Canva

4 / 33

#30. San Juan County

- Cancer rate per 100,000, 2016-2020: 359.2
- Age-adjusted rate per 100,000, 2016-2020: 319.3
#29. Roosevelt County

Robin Nations // Shutterstock

5 / 33

#29. Roosevelt County

- Cancer rate per 100,000, 2016-2020: 365.3
- Age-adjusted rate per 100,000, 2016-2020: 348.2
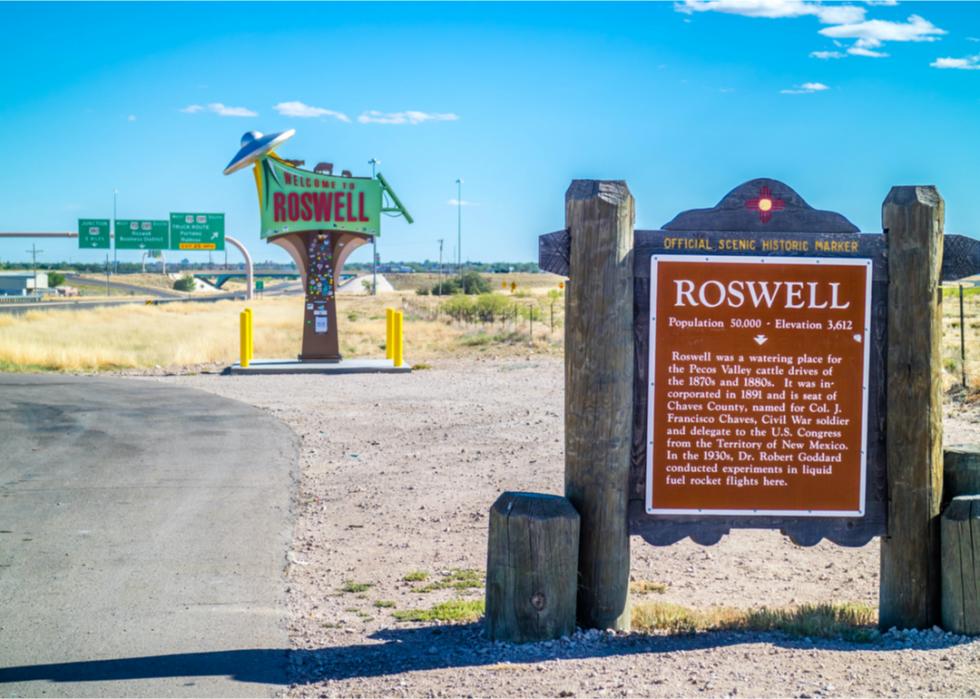
#28. Chaves County

Cheri Alguire // Shutterstock

6 / 33

#28. Chaves County

- Cancer rate per 100,000, 2016-2020: 394.1
- Age-adjusted rate per 100,000, 2016-2020: 339.7
#27. Eddy County

Canva

7 / 33

#27. Eddy County

- Cancer rate per 100,000, 2016-2020: 413.7
- Age-adjusted rate per 100,000, 2016-2020: 371.3
#26. Rio Arriba County

Canva

8 / 33

#26. Rio Arriba County

- Cancer rate per 100,000, 2016-2020: 430.7
- Age-adjusted rate per 100,000, 2016-2020: 310.3
#25. Cibola County

Canva

9 / 33

#25. Cibola County

- Cancer rate per 100,000, 2016-2020: 445.4
- Age-adjusted rate per 100,000, 2016-2020: 370.1
#24. San Miguel County

Canva

10 / 33

#24. San Miguel County

- Cancer rate per 100,000, 2016-2020: 456.7
- Age-adjusted rate per 100,000, 2016-2020: 312.1
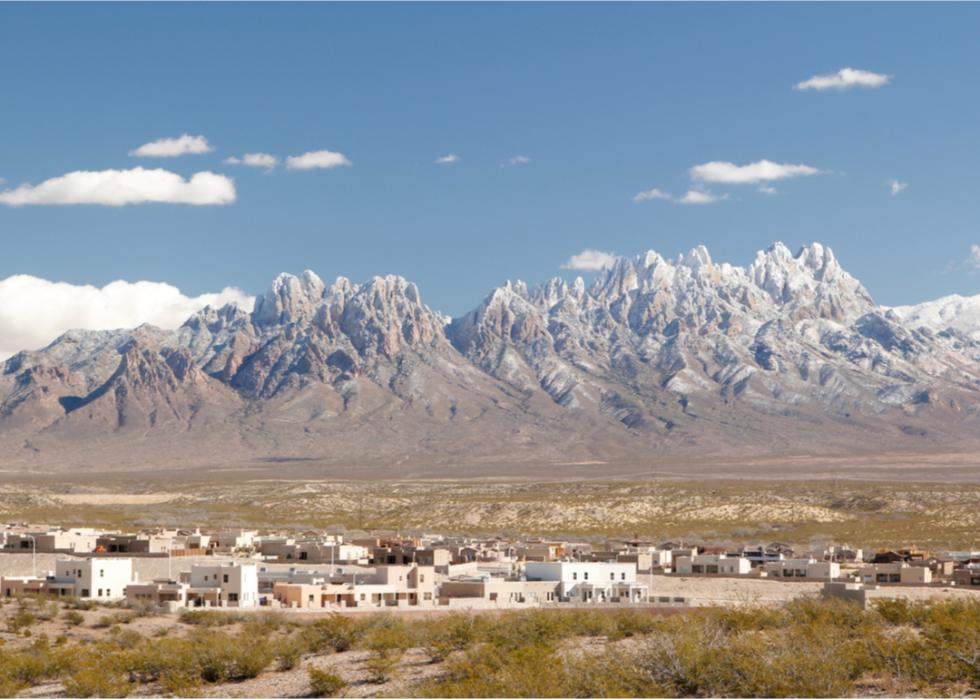
#23. Doña Ana County

David Langford // Shutterstock

11 / 33

#23. Doña Ana County

- Cancer rate per 100,000, 2016-2020: 457.8
- Age-adjusted rate per 100,000, 2016-2020: 408.9
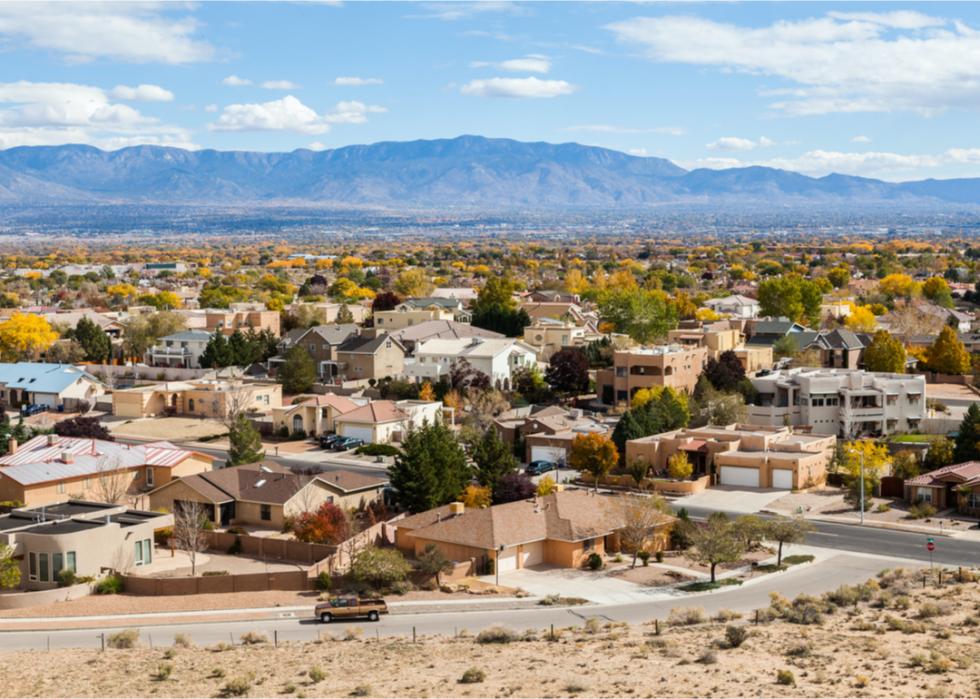
#22. Bernalillo County

Canva

12 / 33

#22. Bernalillo County

- Cancer rate per 100,000, 2016-2020: 463.2
- Age-adjusted rate per 100,000, 2016-2020: 382.4
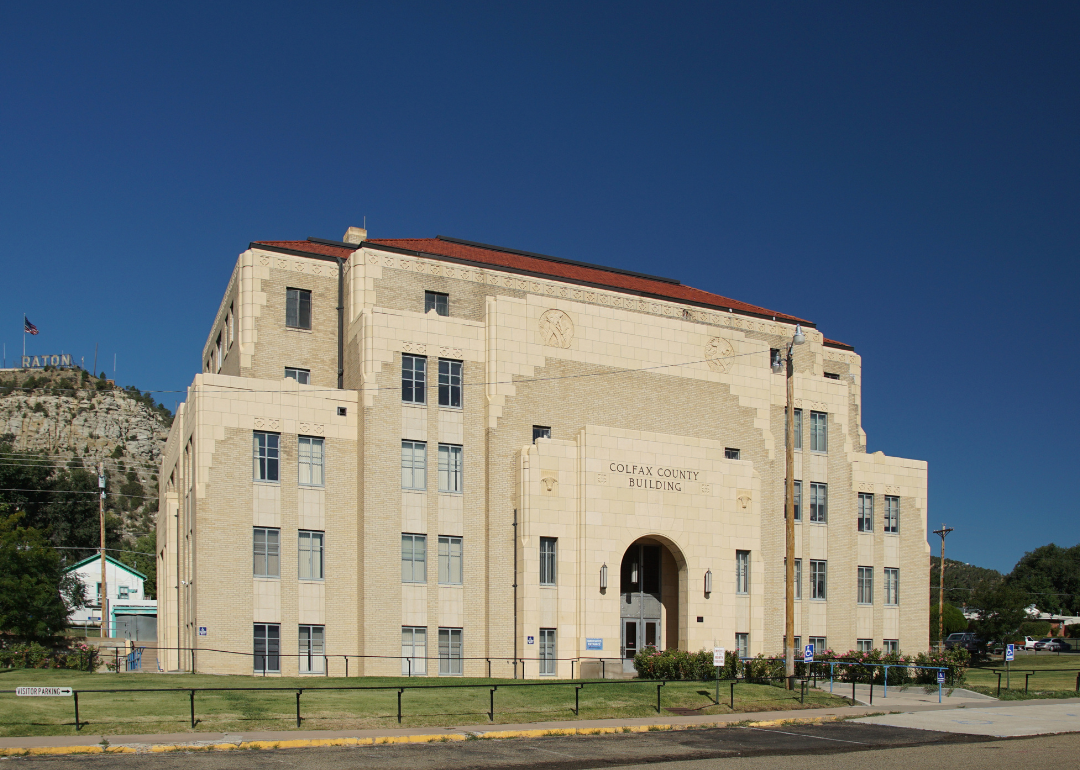
#21. Colfax County

Canva

13 / 33

#21. Colfax County

- Cancer rate per 100,000, 2016-2020: 469.2
- Age-adjusted rate per 100,000, 2016-2020: 276.6
#20. Otero County

Kristi Blokhin // Shutterstock

14 / 33

#20. Otero County

- Cancer rate per 100,000, 2016-2020: 477.2
- Age-adjusted rate per 100,000, 2016-2020: 389.0
#19. Hidalgo County

Canva

15 / 33

#19. Hidalgo County

- Cancer rate per 100,000, 2016-2020: 481.8
- Age-adjusted rate per 100,000, 2016-2020: 316.3
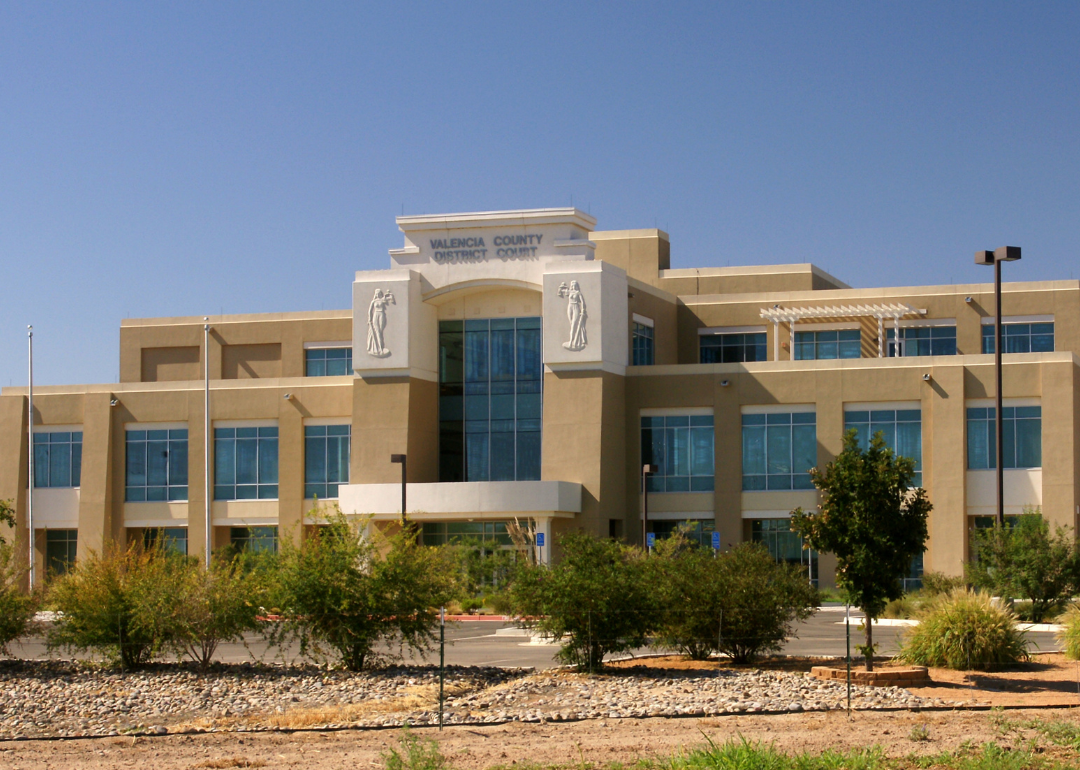
#18. Valencia County

Canva

16 / 33

#18. Valencia County

- Cancer rate per 100,000, 2016-2020: 493.0
- Age-adjusted rate per 100,000, 2016-2020: 384.8
#17. Union County

Canva

17 / 33

#17. Union County

- Cancer rate per 100,000, 2016-2020: 501.8
- Age-adjusted rate per 100,000, 2016-2020: 369.5
#16. Mora County

Canva

18 / 33

#16. Mora County

- Cancer rate per 100,000, 2016-2020: 506.6
- Age-adjusted rate per 100,000, 2016-2020: 315.0
#15. Socorro County

Canva

19 / 33

#15. Socorro County

- Cancer rate per 100,000, 2016-2020: 509.5
- Age-adjusted rate per 100,000, 2016-2020: 380.2
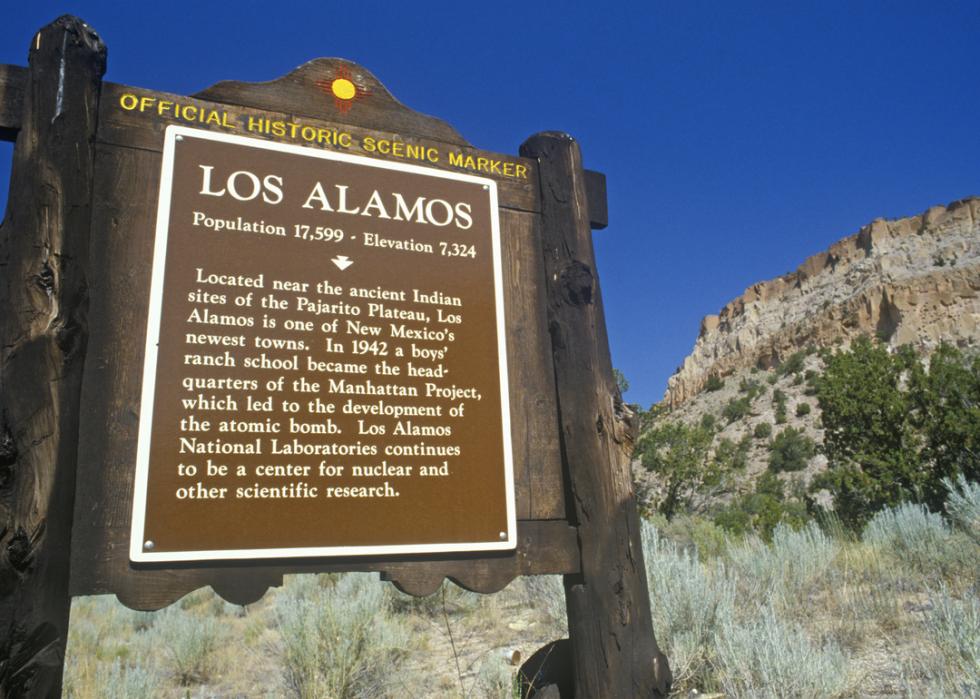
#14. Los Alamos County

Joseph Sohm // Shutterstock

20 / 33

#14. Los Alamos County

- Cancer rate per 100,000, 2016-2020: 512.2
- Age-adjusted rate per 100,000, 2016-2020: 391.1
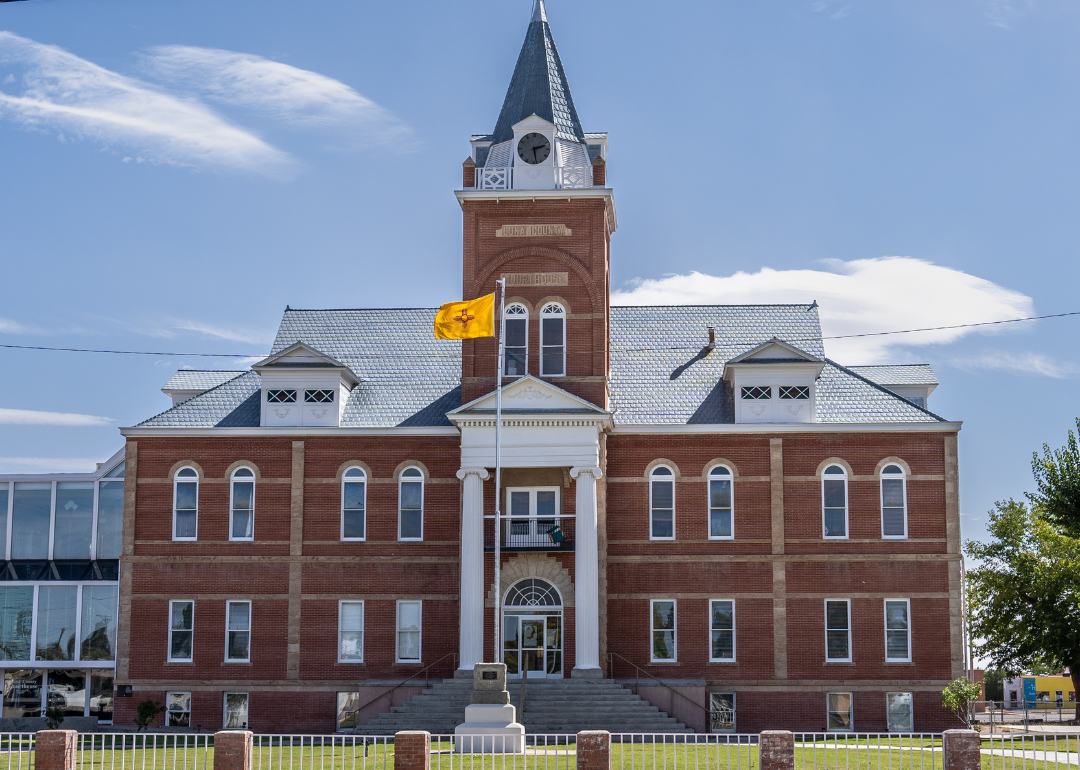
#13. Luna County

Rosemarie Mosteller // Shutterstock

21 / 33

#13. Luna County

- Cancer rate per 100,000, 2016-2020: 519.5
- Age-adjusted rate per 100,000, 2016-2020: 385.7
#12. Sandoval County

turtix // Shutterstock

22 / 33

#12. Sandoval County

- Cancer rate per 100,000, 2016-2020: 519.6
- Age-adjusted rate per 100,000, 2016-2020: 403.7
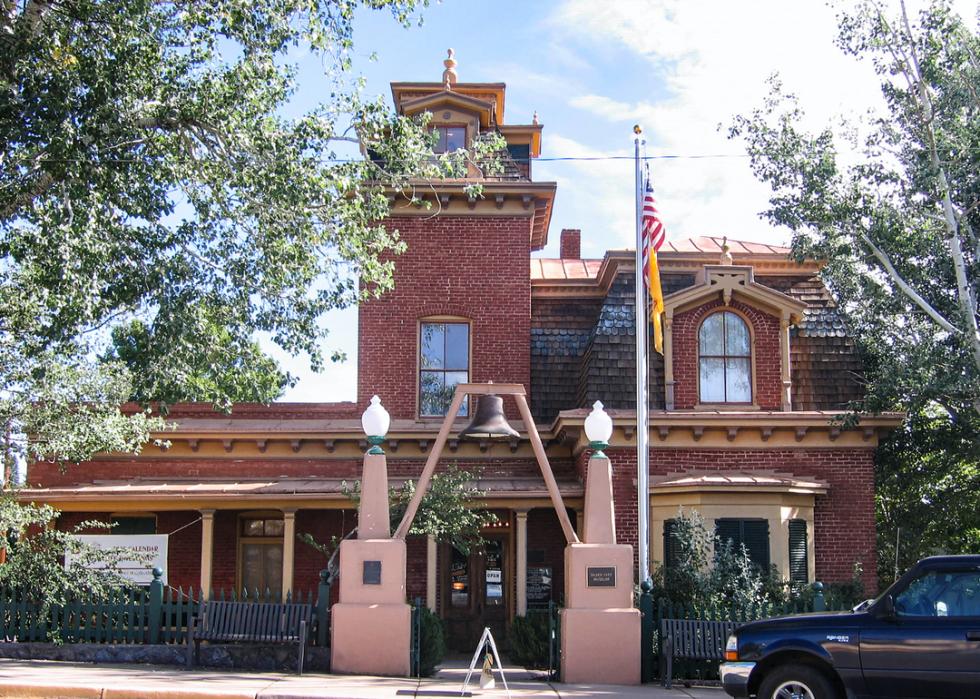
#11. Grant County

Underawesternsky // Shutterstock

23 / 33

#11. Grant County

- Cancer rate per 100,000, 2016-2020: 526.5
- Age-adjusted rate per 100,000, 2016-2020: 305.9
#10. Guadalupe County

Canva

24 / 33

#10. Guadalupe County

- Cancer rate per 100,000, 2016-2020: 535.0
- Age-adjusted rate per 100,000, 2016-2020: 386.3
#9. Taos County

Canva

25 / 33

#9. Taos County

- Cancer rate per 100,000, 2016-2020: 539.1
- Age-adjusted rate per 100,000, 2016-2020: 325.1
#8. Santa Fe County

Jimack // Shutterstock

26 / 33

#8. Santa Fe County

- Cancer rate per 100,000, 2016-2020: 552.0
- Age-adjusted rate per 100,000, 2016-2020: 349.2
#7. Lincoln County

Gestalt Imagery // Shutterstock

27 / 33

#7. Lincoln County

- Cancer rate per 100,000, 2016-2020: 627.3
- Age-adjusted rate per 100,000, 2016-2020: 325.7
#6. Catron County

Canva

28 / 33

#6. Catron County

- Cancer rate per 100,000, 2016-2020: 631.5
- Age-adjusted rate per 100,000, 2016-2020: 253.0
#5. Quay County

Canva

29 / 33

#5. Quay County

- Cancer rate per 100,000, 2016-2020: 638.8
- Age-adjusted rate per 100,000, 2016-2020: 383.2
#4. Torrance County

Canva

30 / 33

#4. Torrance County

- Cancer rate per 100,000, 2016-2020: 653.9
- Age-adjusted rate per 100,000, 2016-2020: 445.2
#3. De Baca County

Canva

31 / 33

#3. De Baca County

- Cancer rate per 100,000, 2016-2020: 735.0
- Age-adjusted rate per 100,000, 2016-2020: 387.9
#2. Sierra County

Canva

32 / 33

#2. Sierra County

- Cancer rate per 100,000, 2016-2020: 820.9
- Age-adjusted rate per 100,000, 2016-2020: 396.3
#1. Harding County

Canva

33 / 33

#1. Harding County

- Cancer rate per 100,000, 2016-2020: 972.9
- Age-adjusted rate per 100,000, 2016-2020: 477.3