Canva
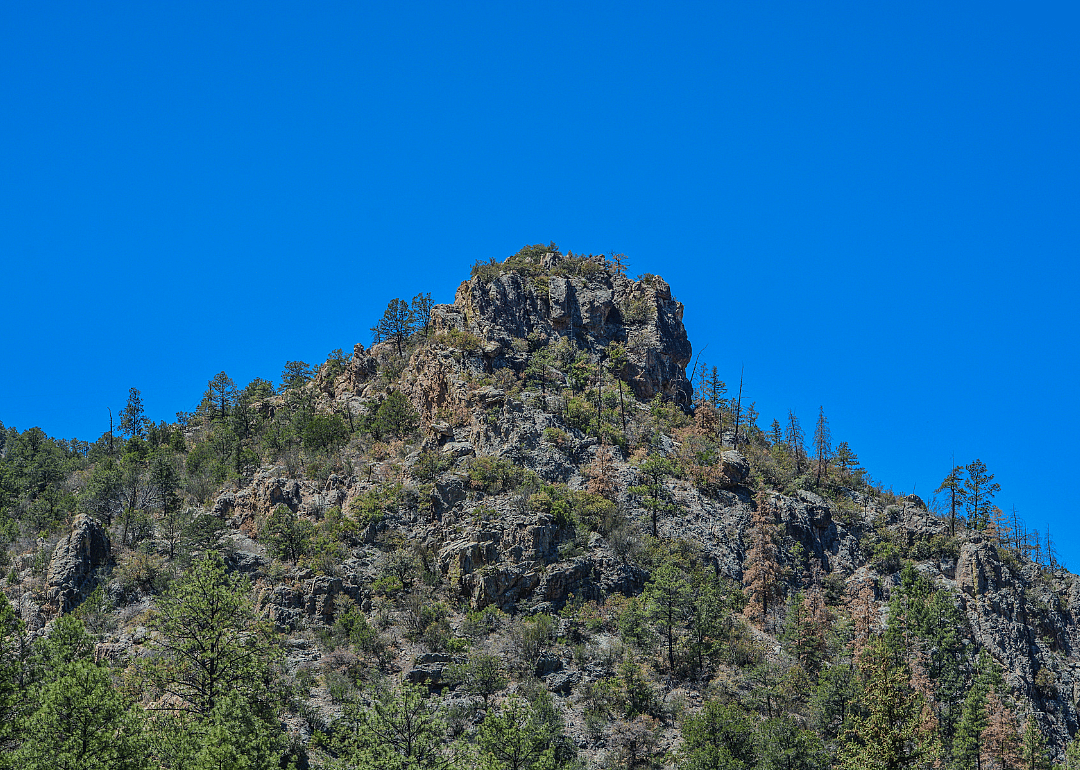
1 / 20#20. Catron County
- Bridges in poor condition: 3.9% (4 of 103 bridges)
- Square meters of bridges in poor condition: 2.4% (502 of 20,920 square meters of bridges)

One in three U.S. bridges is in need of repair or replacement, according to data from the American Road & Transportation Builders Association, including 29% of interstate bridges. The cost to make these repairs is estimated to be in excess of $54 billion.
Stacker investigated which counties in New Mexico have the most bridges in dire need of repair using data from the Federal Highway Administration. The data is accurate as of June 15, 2022. Counties are ranked by percent of bridges in "poor" condition and ties are broken by percent square meters of bridges in poor condition. Counties that have no bridges or have no bridges in poor condition are excluded from the list.
You may also like: Hottest Septembers in New Mexico since 1895
Canva
1 / 20- Bridges in poor condition: 3.9% (4 of 103 bridges)
- Square meters of bridges in poor condition: 2.4% (502 of 20,920 square meters of bridges)

Canva
2 / 20- Bridges in poor condition: 4.3% (3 of 70 bridges)
- Square meters of bridges in poor condition: 3.2% (1,104 of 34,401 square meters of bridges)
Canva
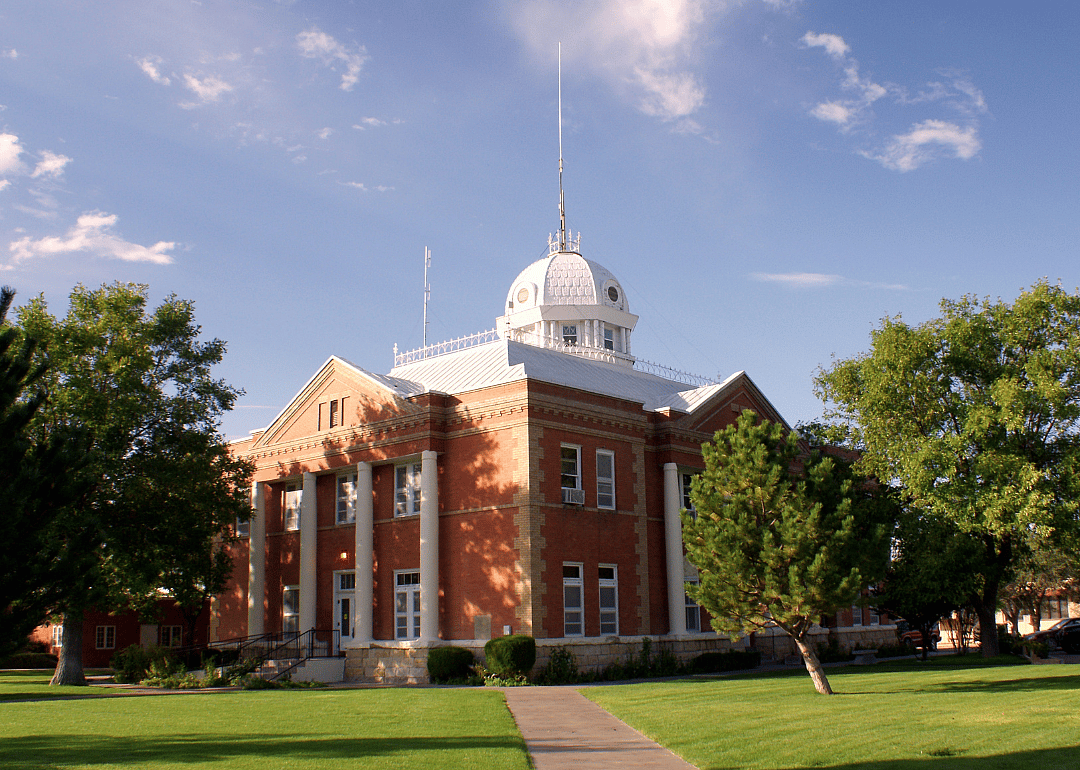
3 / 20- Bridges in poor condition: 4.4% (3 of 68 bridges)
- Square meters of bridges in poor condition: 3.1% (743 of 23,789 square meters of bridges)
David Langford // Shutterstock
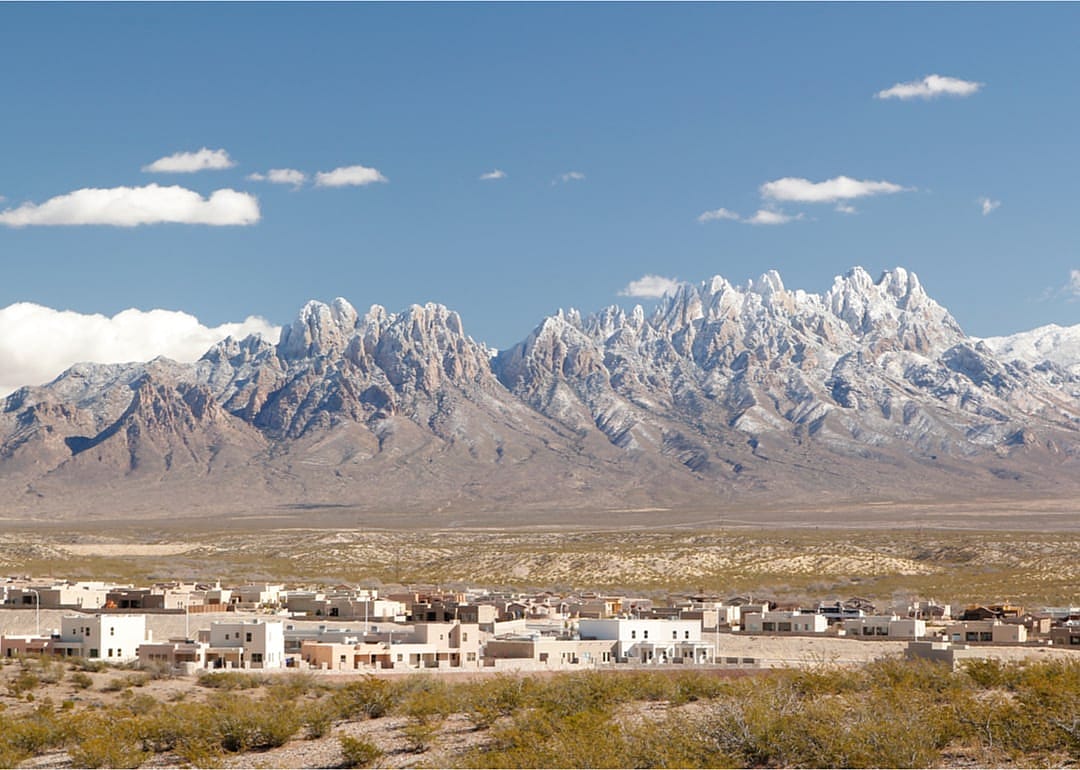
4 / 20- Bridges in poor condition: 4.6% (12 of 263 bridges)
- Square meters of bridges in poor condition: 5.8% (8,648 of 148,315 square meters of bridges)
Canva
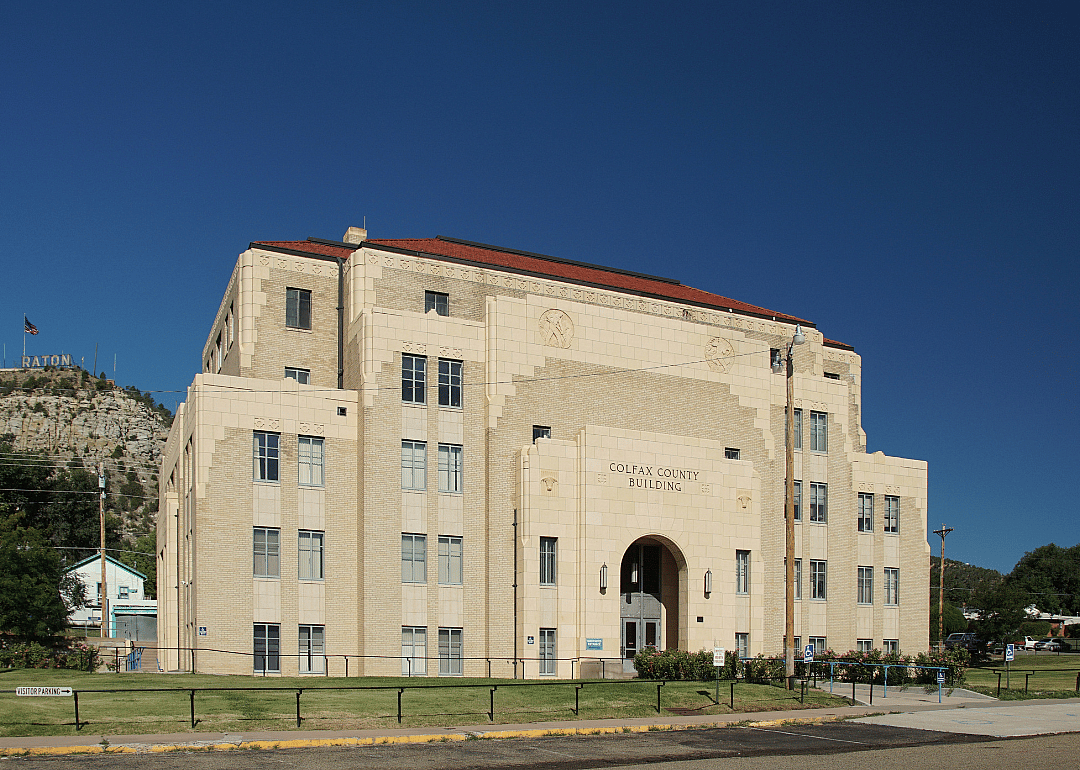
5 / 20- Bridges in poor condition: 5.0% (7 of 140 bridges)
- Square meters of bridges in poor condition: 3.5% (2,153 of 60,782 square meters of bridges)
You may also like: Hottest months in New Mexico since 1895
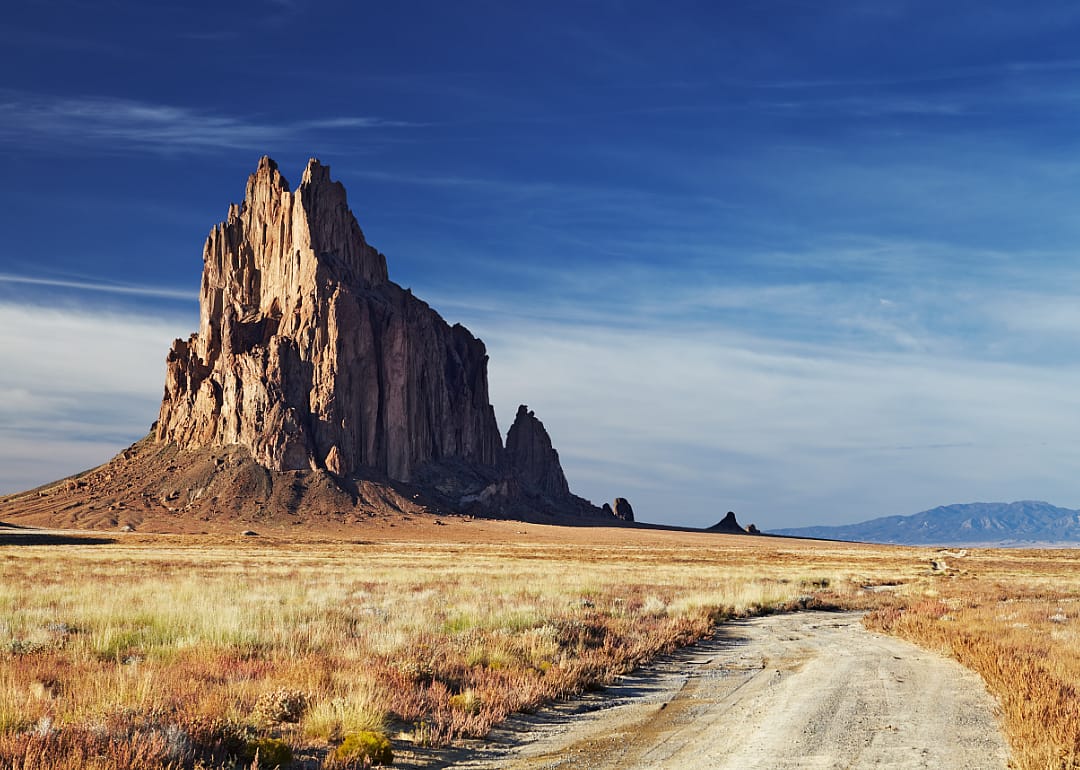
Canva
6 / 20- Bridges in poor condition: 5.4% (9 of 168 bridges)
- Square meters of bridges in poor condition: 5.6% (5,320 of 95,086 square meters of bridges)
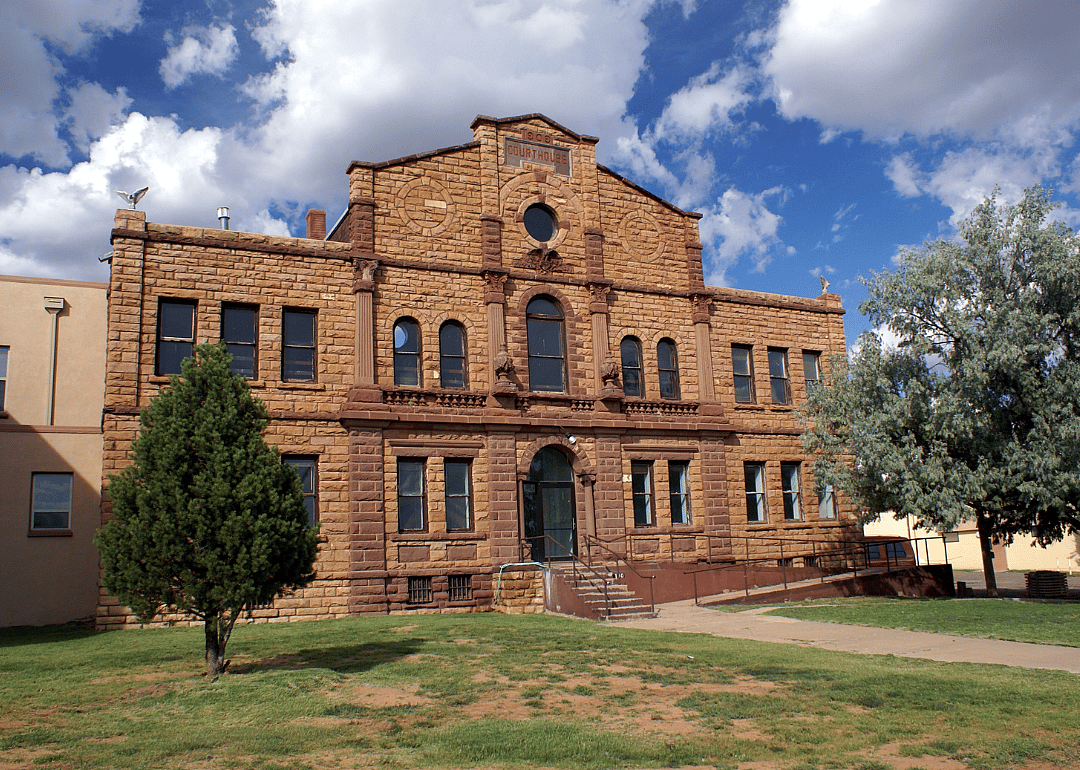
Canva
7 / 20- Bridges in poor condition: 6.0% (5 of 83 bridges)
- Square meters of bridges in poor condition: 7.1% (3,081 of 43,425 square meters of bridges)
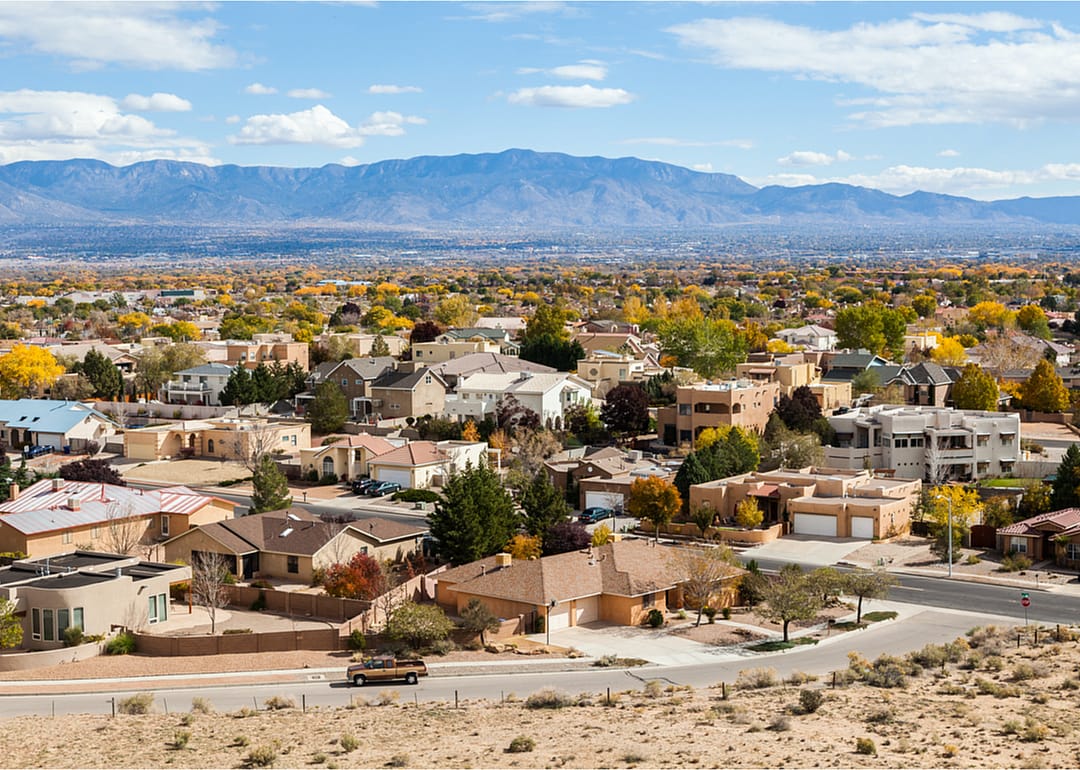
turtix // Shutterstock
8 / 20- Bridges in poor condition: 6.6% (12 of 182 bridges)
- Square meters of bridges in poor condition: 4.8% (4,373 of 91,859 square meters of bridges)
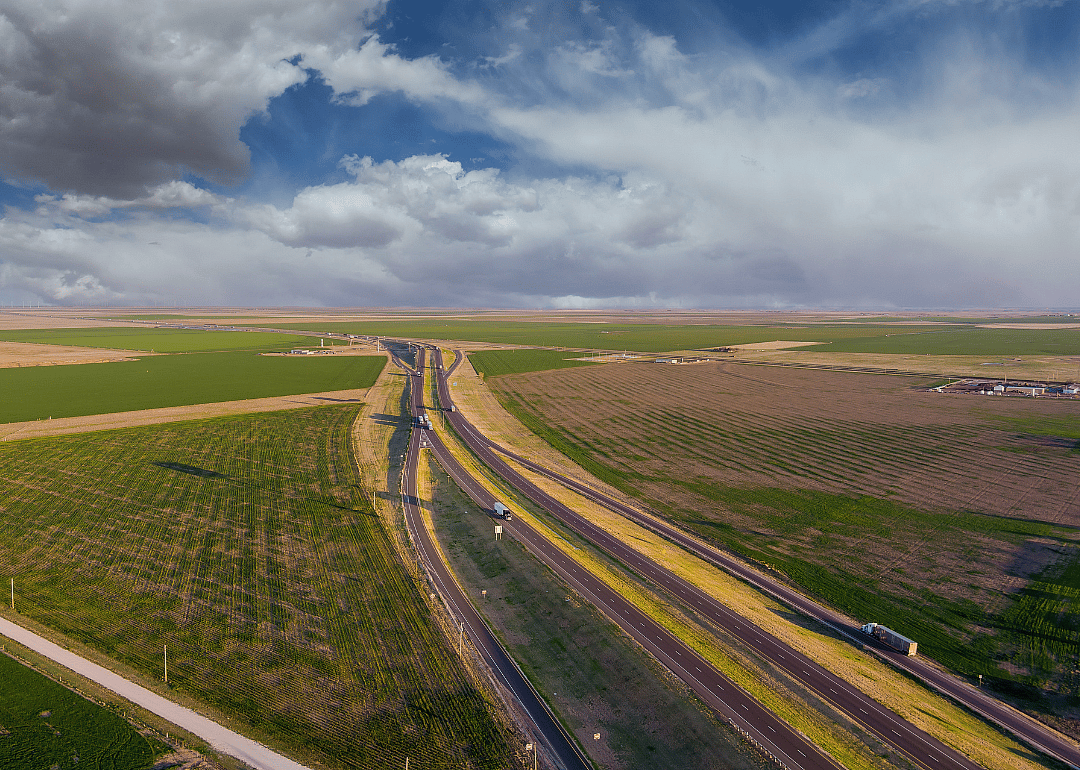
Canva
9 / 20- Bridges in poor condition: 6.7% (8 of 120 bridges)
- Square meters of bridges in poor condition: 5.2% (3,457 of 66,956 square meters of bridges)
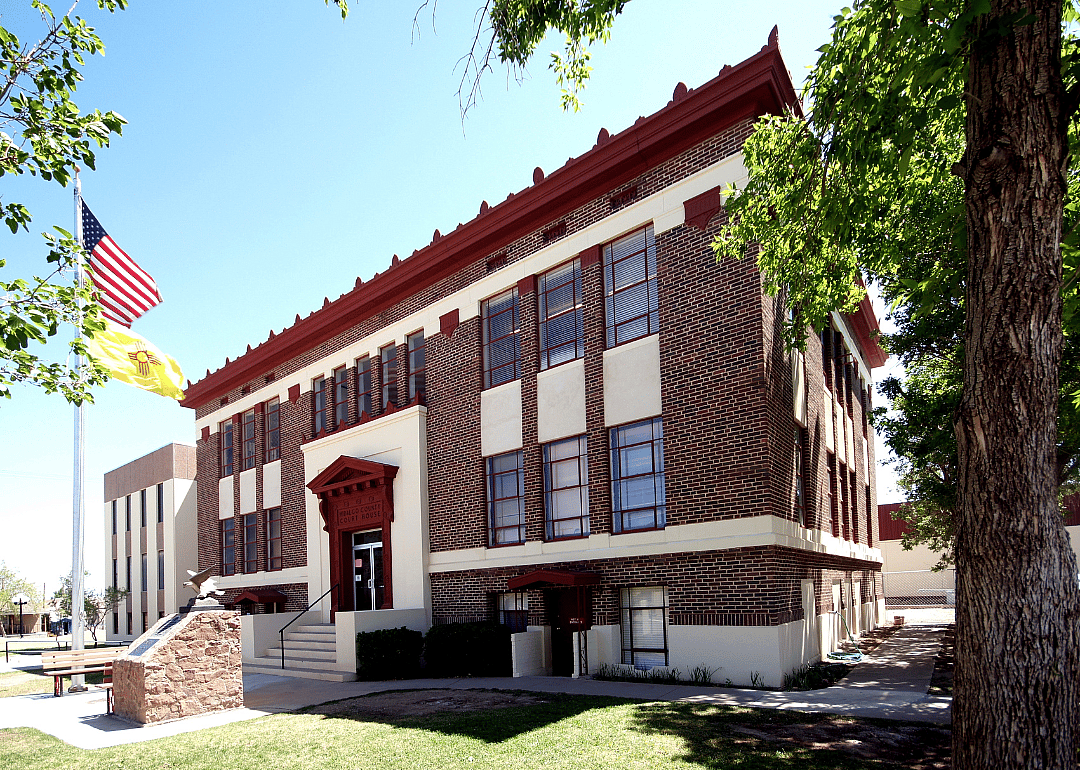
Canva
10 / 20- Bridges in poor condition: 6.9% (4 of 58 bridges)
- Square meters of bridges in poor condition: 10.0% (2,232 of 22,292 square meters of bridges)
You may also like: Coldest Septembers in New Mexico since 1895
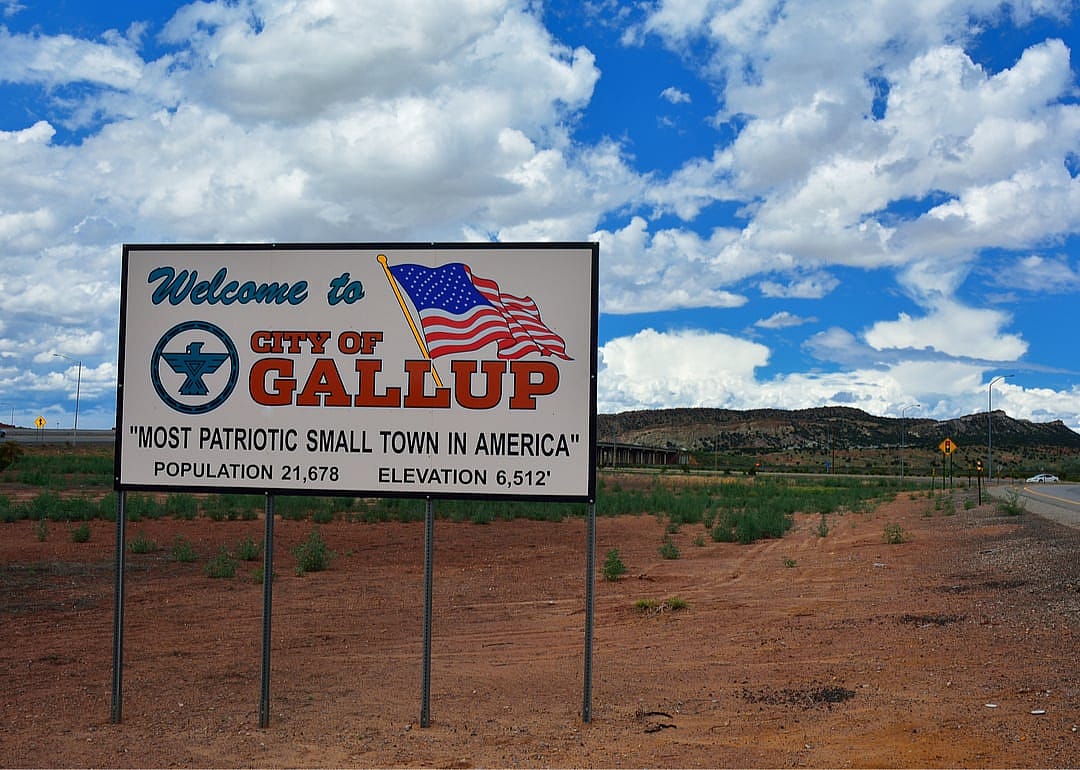
StockPhotoAstur // Shutterstock
11 / 20- Bridges in poor condition: 7.0% (20 of 287 bridges)
- Square meters of bridges in poor condition: 4.9% (5,958 of 121,066 square meters of bridges)
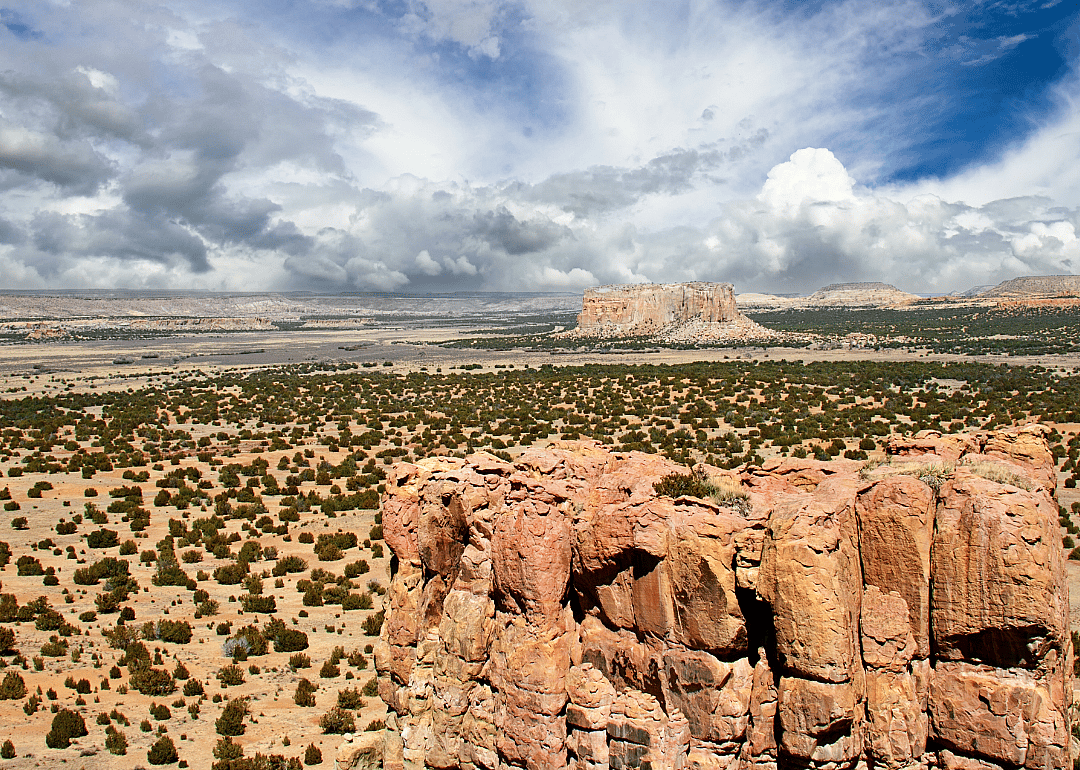
Canva
12 / 20- Bridges in poor condition: 7.4% (8 of 108 bridges)
- Square meters of bridges in poor condition: 11.0% (5,638 of 51,440 square meters of bridges)
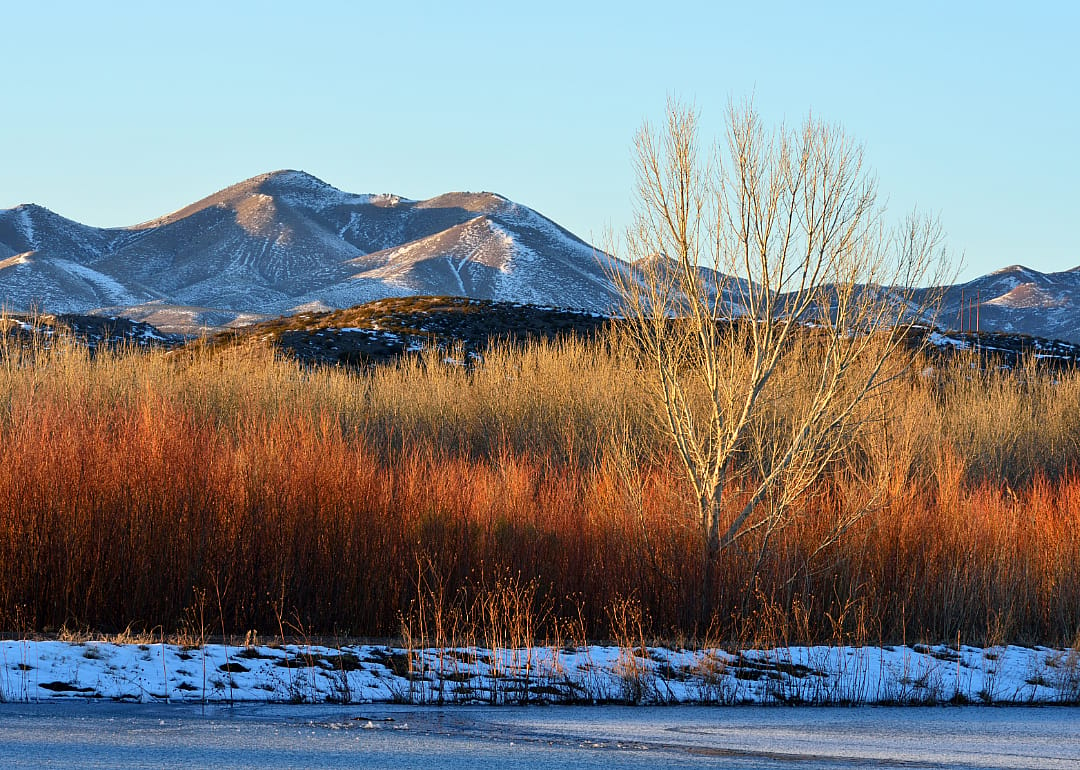
Canva
13 / 20- Bridges in poor condition: 7.9% (15 of 189 bridges)
- Square meters of bridges in poor condition: 9.5% (7,590 of 80,242 square meters of bridges)
Canva
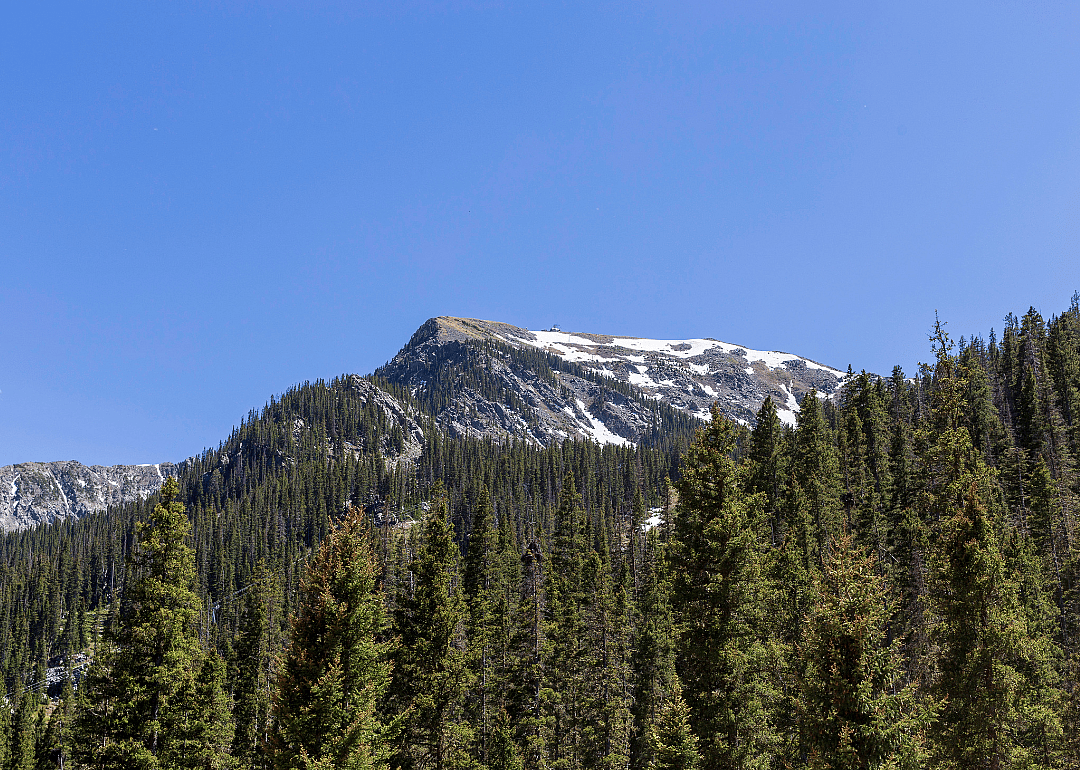
14 / 20- Bridges in poor condition: 8.2% (8 of 97 bridges)
- Square meters of bridges in poor condition: 5.0% (873 of 17,496 square meters of bridges)
Canva
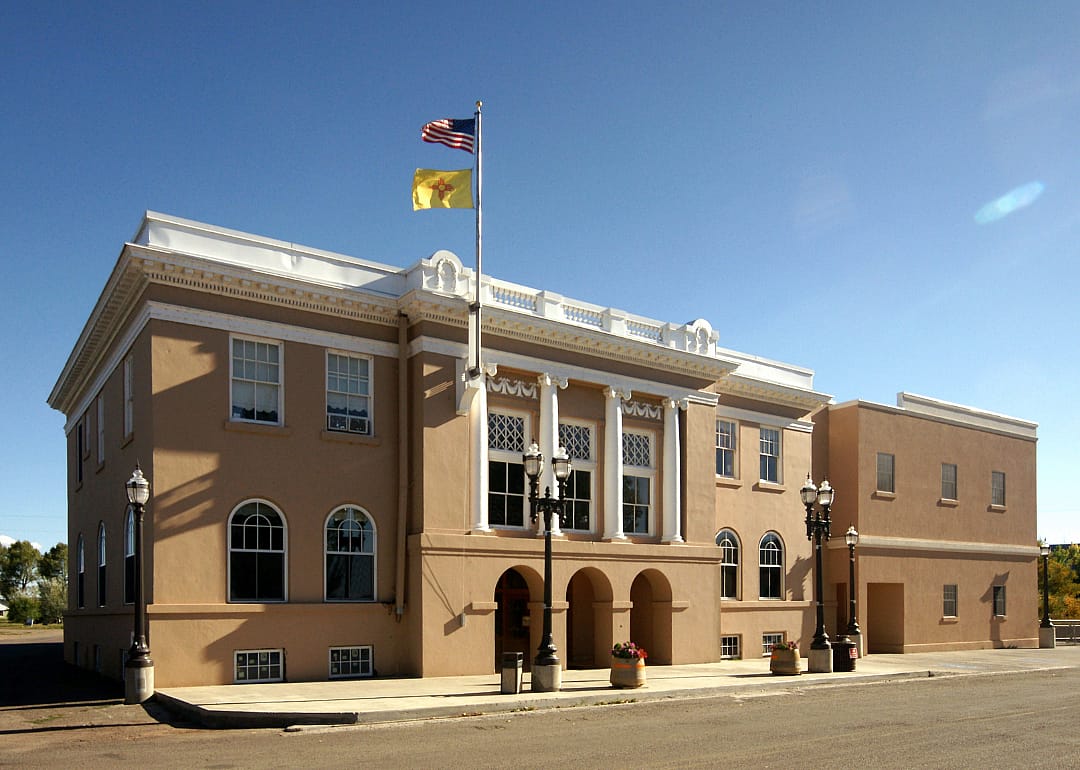
15 / 20- Bridges in poor condition: 8.3% (13 of 157 bridges)
- Square meters of bridges in poor condition: 2.0% (1,240 of 61,553 square meters of bridges)
You may also like: Most expensive homes for sale in New Mexico
Canva
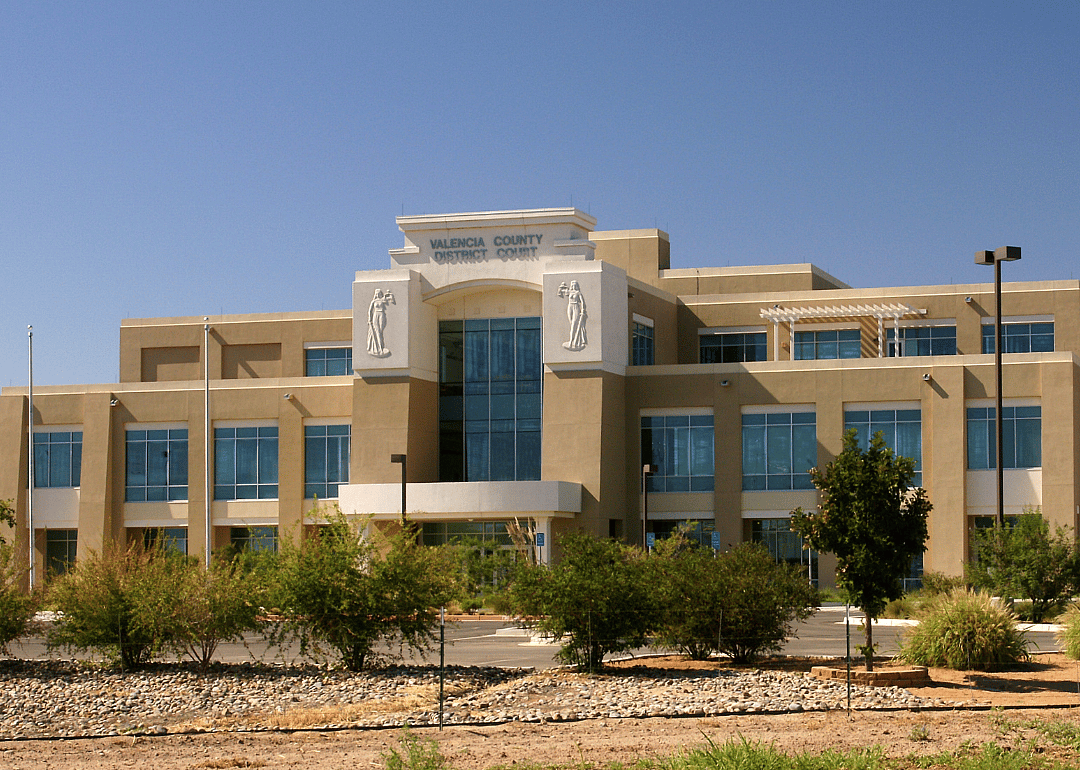
16 / 20- Bridges in poor condition: 8.7% (6 of 69 bridges)
- Square meters of bridges in poor condition: 18.2% (8,151 of 44,846 square meters of bridges)
Canva
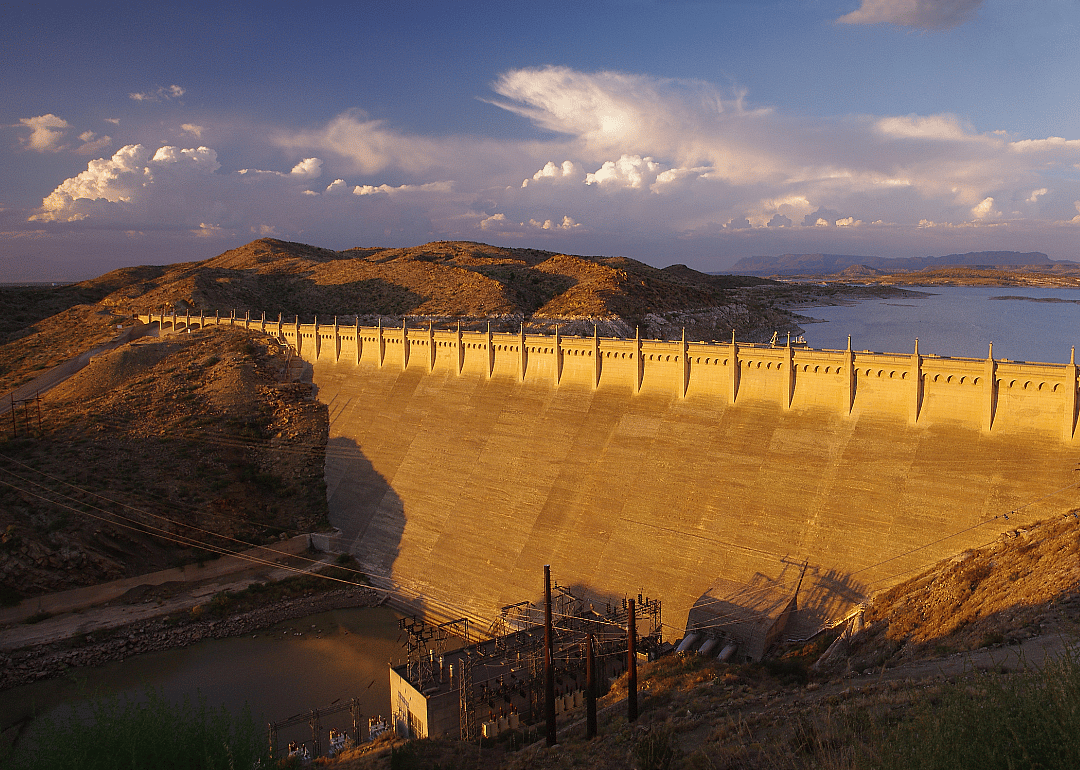
17 / 20- Bridges in poor condition: 9.2% (10 of 109 bridges)
- Square meters of bridges in poor condition: 6.4% (3,540 of 55,666 square meters of bridges)
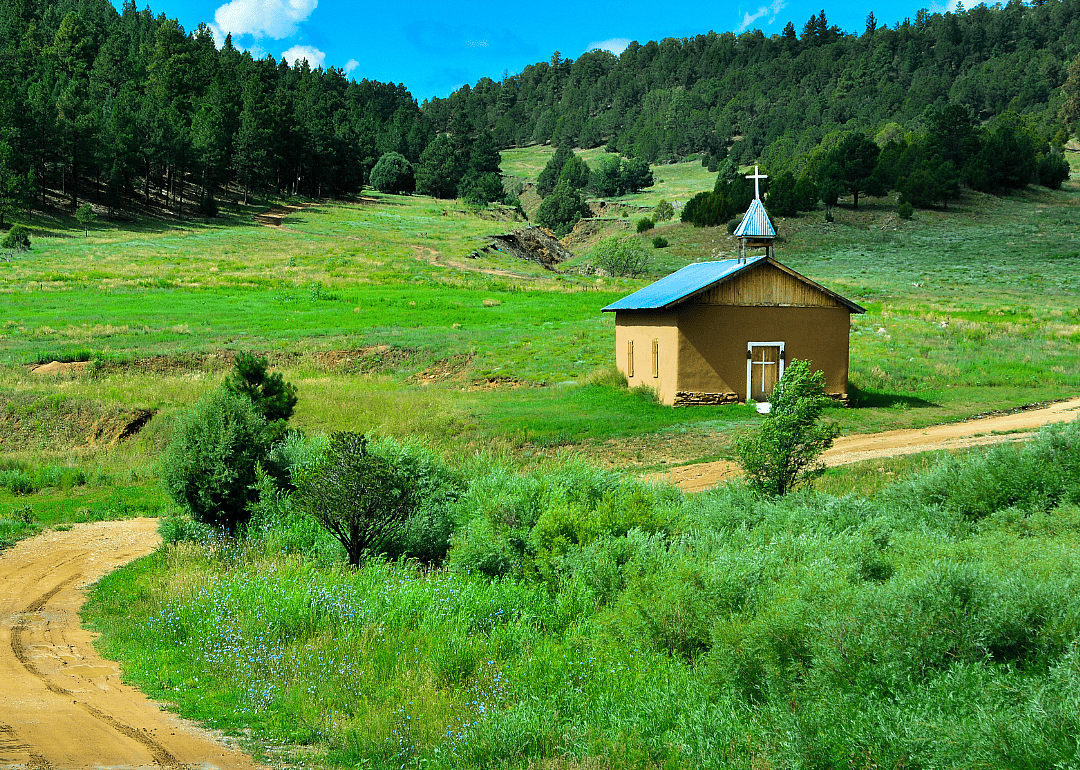
Canva
18 / 20- Bridges in poor condition: 10.3% (8 of 78 bridges)
- Square meters of bridges in poor condition: 7.9% (2,130 of 26,995 square meters of bridges)
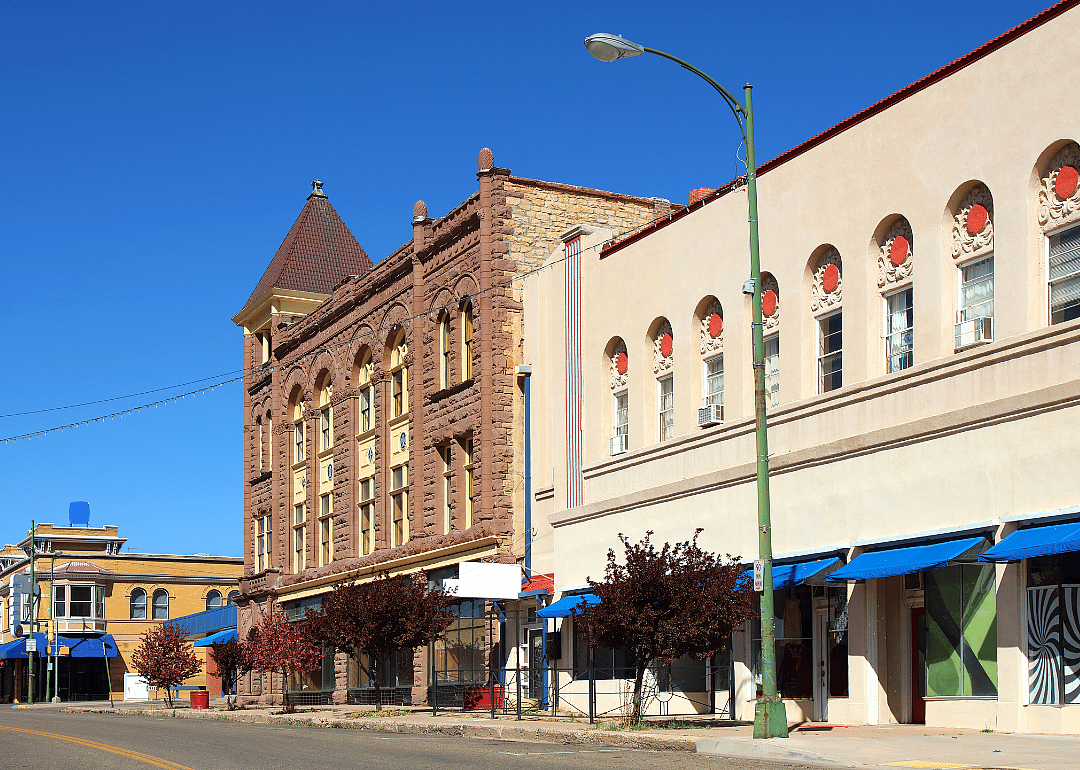
Canva
19 / 20- Bridges in poor condition: 10.6% (19 of 179 bridges)
- Square meters of bridges in poor condition: 6.0% (4,813 of 80,780 square meters of bridges)
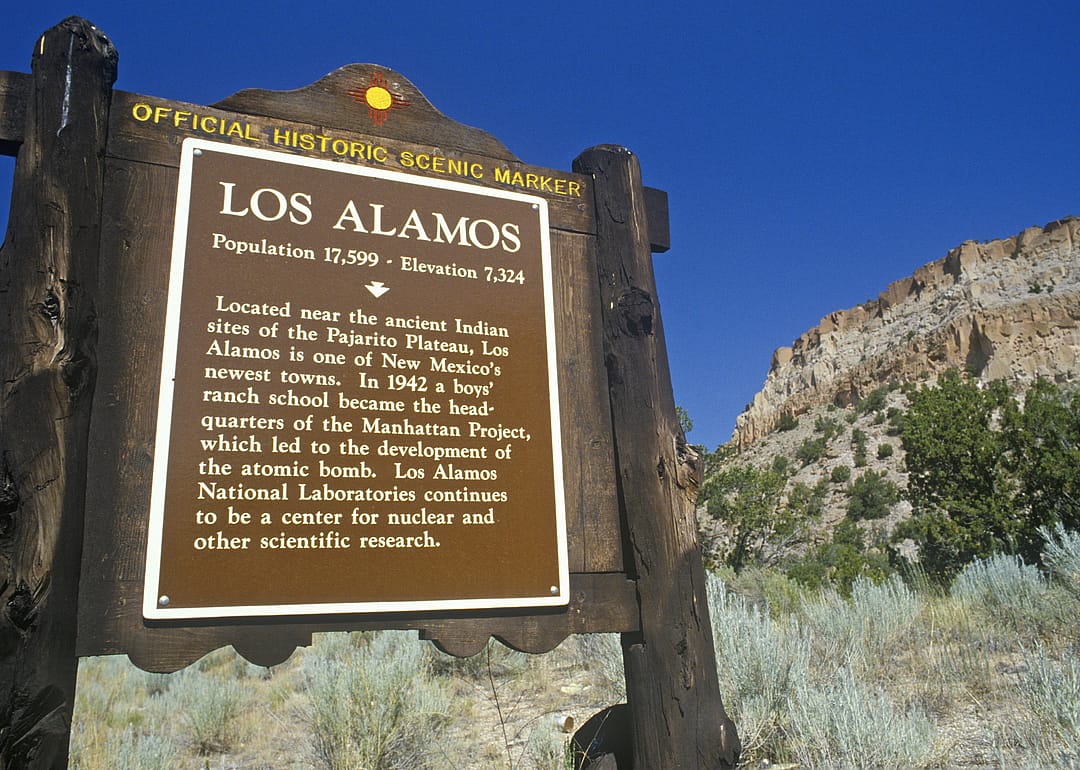
Joseph Sohm // Shutterstock
20 / 20- Bridges in poor condition: 33.3% (1 of 3 bridges)
- Square meters of bridges in poor condition: 93.0% (4,222 of 4,538 square meters of bridges)
You may also like: How New Mexico's unbanked population compares to the rest of the US



