Counties where children have the best opportunity for economic mobility in New Mexico

·Stacker

Joseph Sohm // Shutterstock

Americans have long understood that their birthplace can significantly affect their futures, and academics have increasingly been able to connect tangible early life factors like where they live and the friendships they've cultivated with potential future income.

Among the most recent studies shedding light on what's known as economic mobility—a person's ability to move themselves and their families up the socioeconomic ladder over their lifetime—are a series of papers authored by Harvard University researchers leveraging vast troves of social networking data.

As part of a national analysis, Wealth Enhancement Group used data from Harvard University's Social Capital Atlas project to identify where in New Mexico children have the best (and worst) chances at upward economic mobility.

The research draws on a privacy-protected dataset representing 21 billion friendships from Facebook made public through its parent company Meta's Data for Good project. It also uses anonymous tax records, according to the authors. The scholars assigned a score to locales according to how economically connected low- and high-income people living in the area have historically been over at least a decade, per that data. The dataset does not include scores for about 180 of the 3,000 or so counties in the U.S.

The research attempts to fill in the gaps of previous efforts to study American economic mobility that did not consider a person's vast social networks nor their importance in creating better lives for themselves and their children.

It turns out the ability to cultivate friendships linking people of different socioeconomic backgrounds with one another is the strongest factor in determining whether a child can surpass the earning potential of their parents, Harvard researchers found. They call this economic connectedness.

Read on to find out where economic connectedness is strongest in your state.

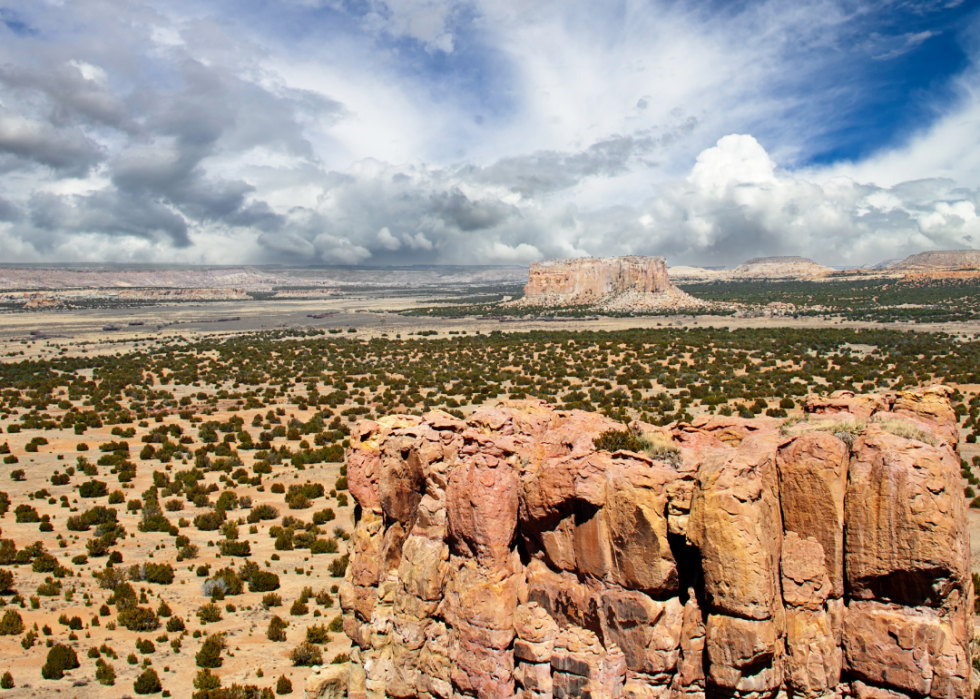
#29. McKinley County

StockPhotoAstur // Shutterstock

1 / 29

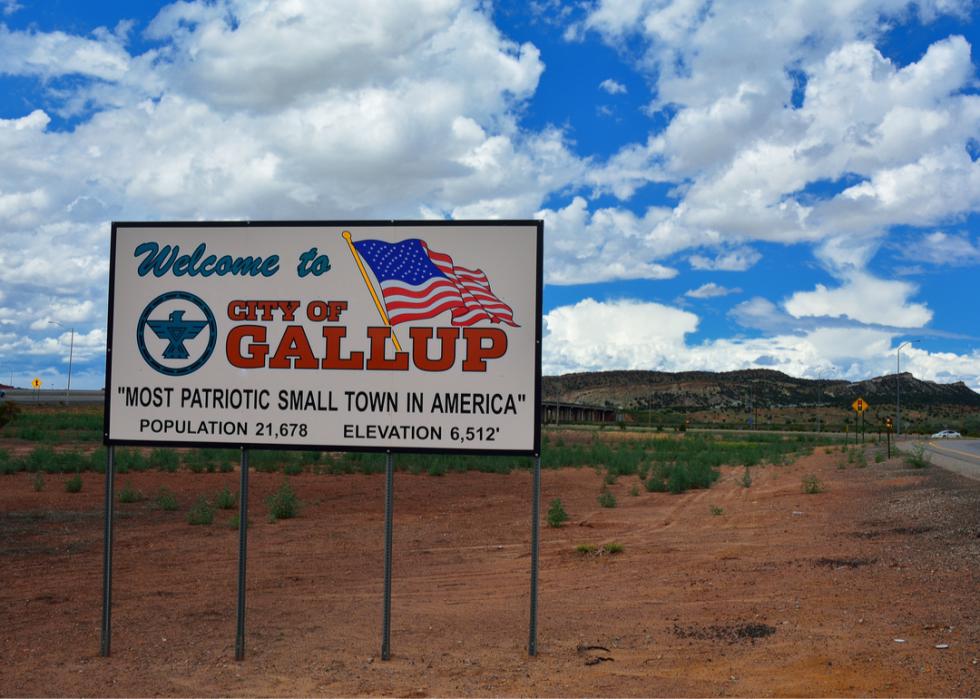
#29. McKinley County

- Economic connectedness: 0.42
- Median Income: $40,262
- Population: 72,946
--- 11.5% white
--- 0.5% Black
--- 75.5% American Indian and Alaska Native
--- 1.3% Asian
#28. Rio Arriba County

Canva

2 / 29

#28. Rio Arriba County

- Economic connectedness: 0.45
- Median Income: $46,994
- Population: 40,347
--- 41.4% white
--- 0.6% Black
--- 15.8% American Indian and Alaska Native
--- 0.5% Asian
#27. Luna County

Rosemarie Mosteller // Shutterstock

3 / 29

#27. Luna County

- Economic connectedness: 0.46
- Median Income: $33,914
- Population: 25,282
--- 74.6% white
--- 1.8% Black
--- 0.9% American Indian and Alaska Native
--- 1% Asian
#26. Cibola County

Canva

4 / 29

#26. Cibola County

- Economic connectedness: 0.47
- Median Income: $47,300
- Population: 27,284
--- 44.4% white
--- 1.6% Black
--- 42.6% American Indian and Alaska Native
--- 0.2% Asian
#25. San Miguel County

Canva

5 / 29

#25. San Miguel County

- Economic connectedness: 0.5
- Median Income: $36,492
- Population: 27,357
--- 58.5% white
--- 1.6% Black
--- 1.6% American Indian and Alaska Native
--- 1% Asian
#24. Socorro County

Canva

6 / 29

#24. Socorro County

- Economic connectedness: 0.53
- Median Income: $38,242
- Population: 16,605
--- 66.8% white
--- 0.8% Black
--- 12% American Indian and Alaska Native
--- 1.9% Asian
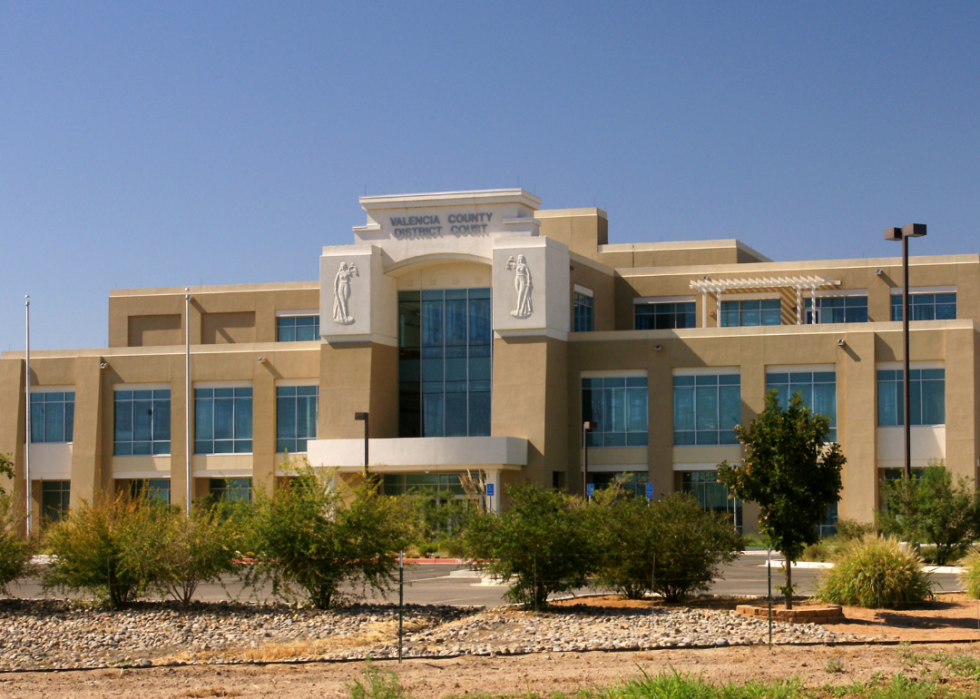
#23. Valencia County

Canva

7 / 29

#23. Valencia County

- Economic connectedness: 0.55
- Median Income: $53,752
- Population: 75,992
--- 68.7% white
--- 1.6% Black
--- 4.2% American Indian and Alaska Native
--- 1.5% Asian
#22. Grant County

Underawesternsky // Shutterstock

8 / 29

#22. Grant County

- Economic connectedness: 0.57
- Median Income: $39,429
- Population: 28,178
--- 80.2% white
--- 0.9% Black
--- 1.5% American Indian and Alaska Native
--- 0.7% Asian
#21. Chaves County

Cheri Alguire // Shutterstock

9 / 29

#21. Chaves County

- Economic connectedness: 0.57
- Median Income: $47,620
- Population: 65,014
--- 74.5% white
--- 1.5% Black
--- 1.1% American Indian and Alaska Native
--- 1.1% Asian
#20. Quay County

Canva

10 / 29

#20. Quay County

- Economic connectedness: 0.58
- Median Income: $33,067
- Population: 8,675
--- 75.3% white
--- 2.5% Black
--- 2.2% American Indian and Alaska Native
--- 1% Asian
#19. Sierra County

Canva

11 / 29

#19. Sierra County

- Economic connectedness: 0.58
- Median Income: $35,939
- Population: 11,512
--- 82% white
--- 0.3% Black
--- 3.7% American Indian and Alaska Native
--- 0.8% Asian
#18. Guadalupe County

Canva

12 / 29

#18. Guadalupe County

- Economic connectedness: 0.59
- Median Income: $35,409
- Population: 4,465
--- 61% white
--- 1.9% Black
--- 8.4% American Indian and Alaska Native
--- 0.2% Asian
#17. San Juan County

Canva

13 / 29

#17. San Juan County

- Economic connectedness: 0.6
- Median Income: $47,485
- Population: 122,912
--- 47% white
--- 0.8% Black
--- 39.1% American Indian and Alaska Native
--- 0.7% Asian
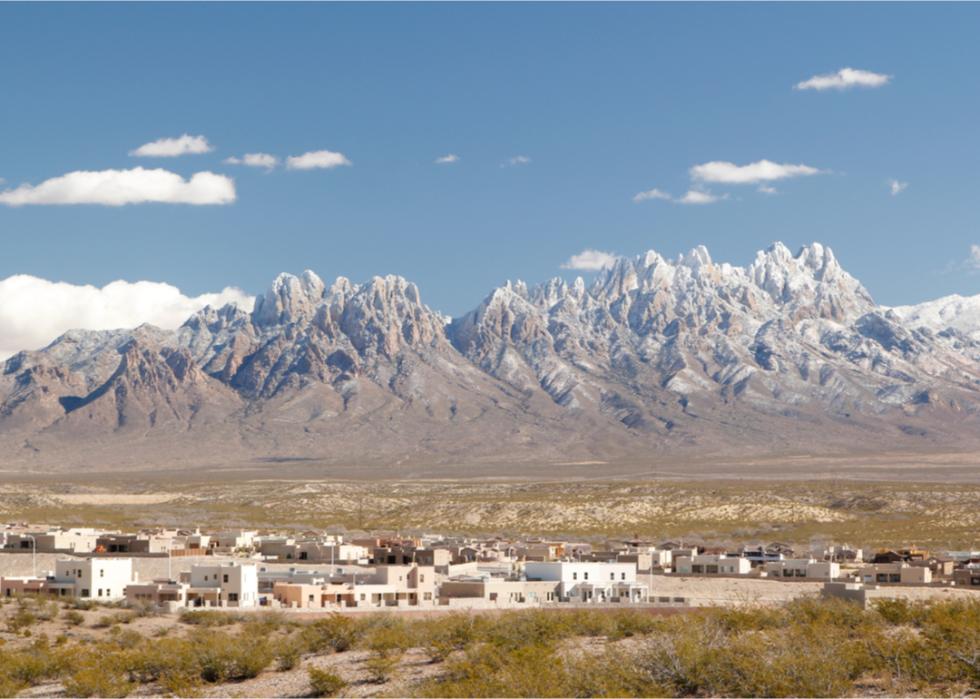
#16. Doña Ana County

David Langford // Shutterstock

14 / 29

#16. Doña Ana County

- Economic connectedness: 0.6
- Median Income: $47,151
- Population: 218,157
--- 67.6% white
--- 1.9% Black
--- 1.3% American Indian and Alaska Native
--- 1.2% Asian
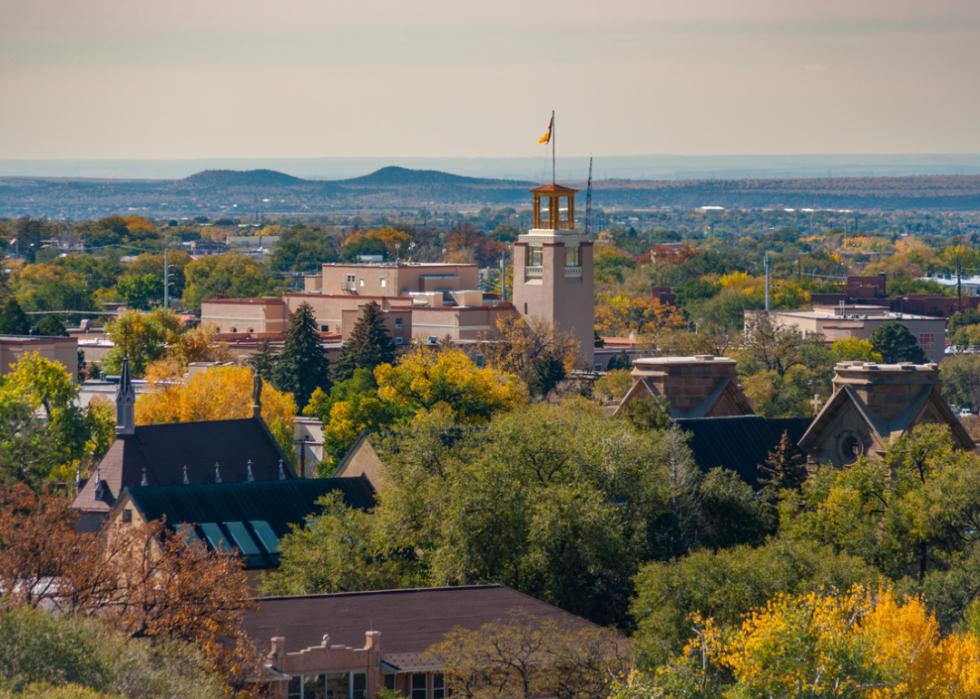
#15. Santa Fe County

Jimack // Shutterstock

15 / 29

#15. Santa Fe County

- Economic connectedness: 0.63
- Median Income: $64,423
- Population: 153,632
--- 74.1% white
--- 1% Black
--- 3.1% American Indian and Alaska Native
--- 1.3% Asian
#14. Hidalgo County

Canva

16 / 29

#14. Hidalgo County

- Economic connectedness: 0.63
- Median Income: $46,097
- Population: 4,214
--- 77.6% white
--- 0.7% Black
--- 1.5% American Indian and Alaska Native
--- 0% Asian
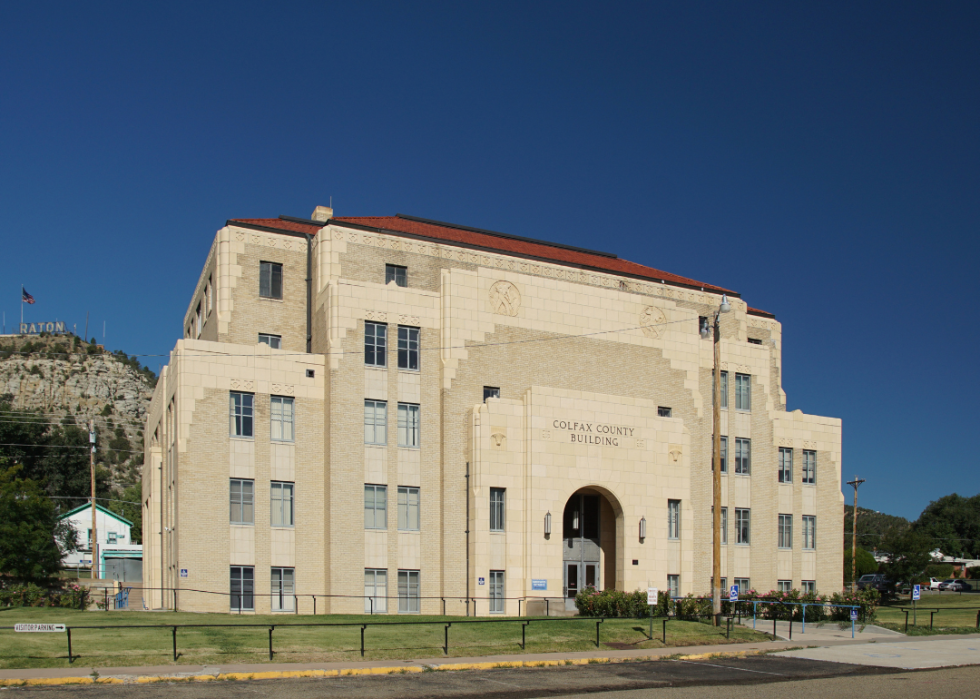
#13. Colfax County

Canva

17 / 29

#13. Colfax County

- Economic connectedness: 0.64
- Median Income: $39,483
- Population: 12,406
--- 79.3% white
--- 0.8% Black
--- 1.9% American Indian and Alaska Native
--- 0.1% Asian
#12. Torrance County

Canva

18 / 29

#12. Torrance County

- Economic connectedness: 0.66
- Median Income: $44,819
- Population: 15,150
--- 74.2% white
--- 2.5% Black
--- 1.4% American Indian and Alaska Native
--- 0.7% Asian
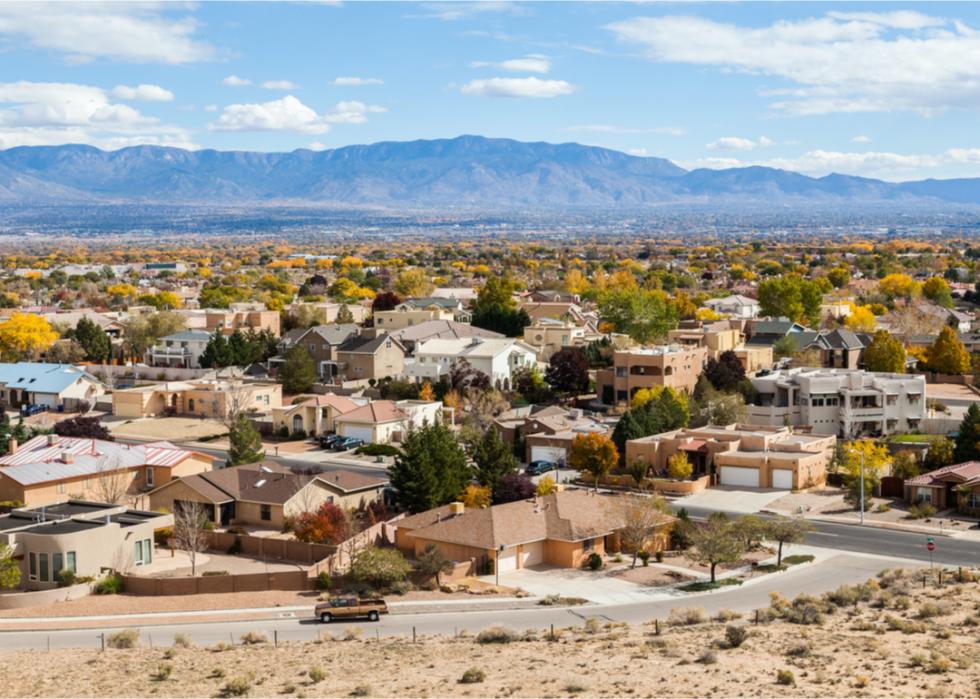
#11. Bernalillo County

Canva

19 / 29

#11. Bernalillo County

- Economic connectedness: 0.66
- Median Income: $56,920
- Population: 674,919
--- 65.6% white
--- 2.9% Black
--- 4.9% American Indian and Alaska Native
--- 2.7% Asian
#10. Curry County

Canva

20 / 29

#10. Curry County

- Economic connectedness: 0.67
- Median Income: $51,199
- Population: 48,716
--- 62.6% white
--- 5.3% Black
--- 0.8% American Indian and Alaska Native
--- 1.4% Asian
#9. Lincoln County

Gestalt Imagery // Shutterstock

21 / 29

#9. Lincoln County

- Economic connectedness: 0.68
- Median Income: $47,247
- Population: 20,084
--- 83.4% white
--- 0.8% Black
--- 2.5% American Indian and Alaska Native
--- 0.5% Asian
#8. Roosevelt County

Robin Nations // Shutterstock

22 / 29

#8. Roosevelt County

- Economic connectedness: 0.69
- Median Income: $47,897
- Population: 19,223
--- 70% white
--- 2.3% Black
--- 0.6% American Indian and Alaska Native
--- 0.8% Asian
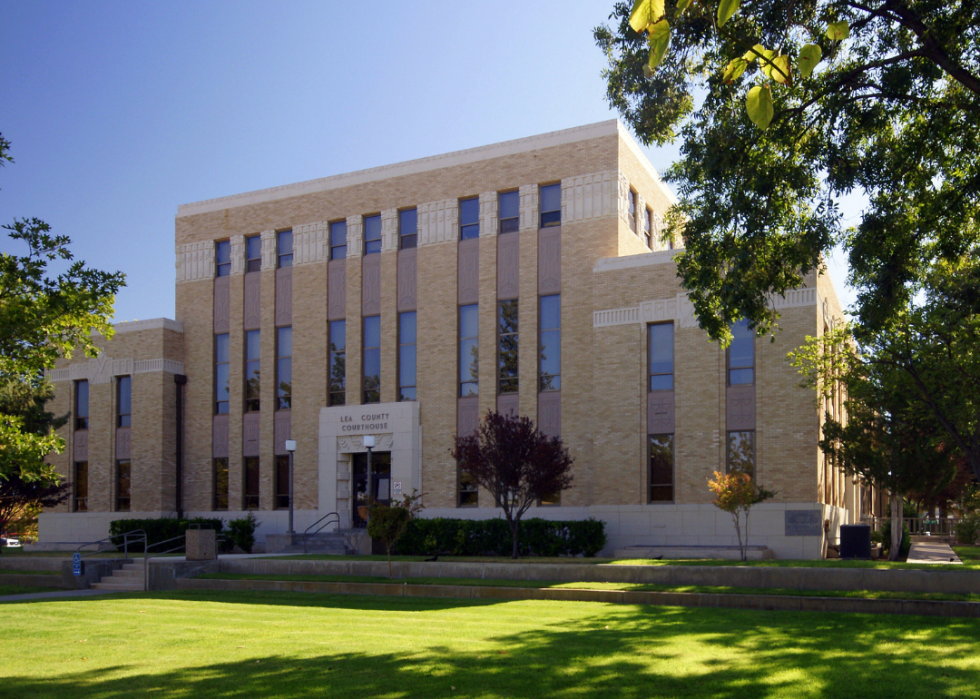
#7. Lea County

Canva

23 / 29

#7. Lea County

- Economic connectedness: 0.69
- Median Income: $62,319
- Population: 72,743
--- 71.5% white
--- 4.2% Black
--- 1.1% American Indian and Alaska Native
--- 0.6% Asian
#6. Taos County

Canva

24 / 29

#6. Taos County

- Economic connectedness: 0.71
- Median Income: $49,481
- Population: 34,322
--- 72.1% white
--- 0.1% Black
--- 6.1% American Indian and Alaska Native
--- 0.7% Asian
#5. Union County

Canva

25 / 29

#5. Union County

- Economic connectedness: 0.72
- Median Income: $37,443
- Population: 4,122
--- 76.9% white
--- 1.2% Black
--- 4.1% American Indian and Alaska Native
--- 0% Asian
#4. Otero County

Kristi Blokhin // Shutterstock

26 / 29

#4. Otero County

- Economic connectedness: 0.73
- Median Income: $46,949
- Population: 67,298
--- 69.6% white
--- 3.4% Black
--- 6.6% American Indian and Alaska Native
--- 1.2% Asian
#3. Eddy County

Canva

27 / 29

#3. Eddy County

- Economic connectedness: 0.74
- Median Income: $67,759
- Population: 61,096
--- 78.2% white
--- 1.5% Black
--- 1.6% American Indian and Alaska Native
--- 0.8% Asian
#2. Sandoval County

turtix // Shutterstock

28 / 29

#2. Sandoval County

- Economic connectedness: 0.75
- Median Income: $68,947
- Population: 147,327
--- 65.3% white
--- 2.2% Black
--- 12.1% American Indian and Alaska Native
--- 1.6% Asian
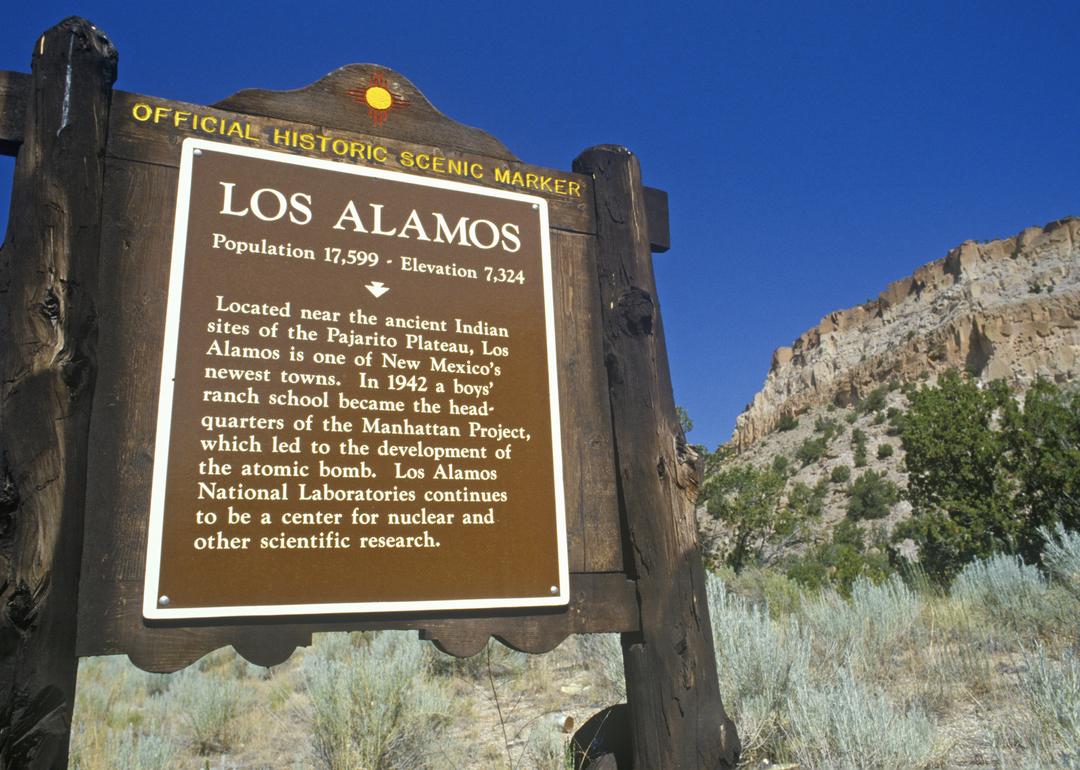
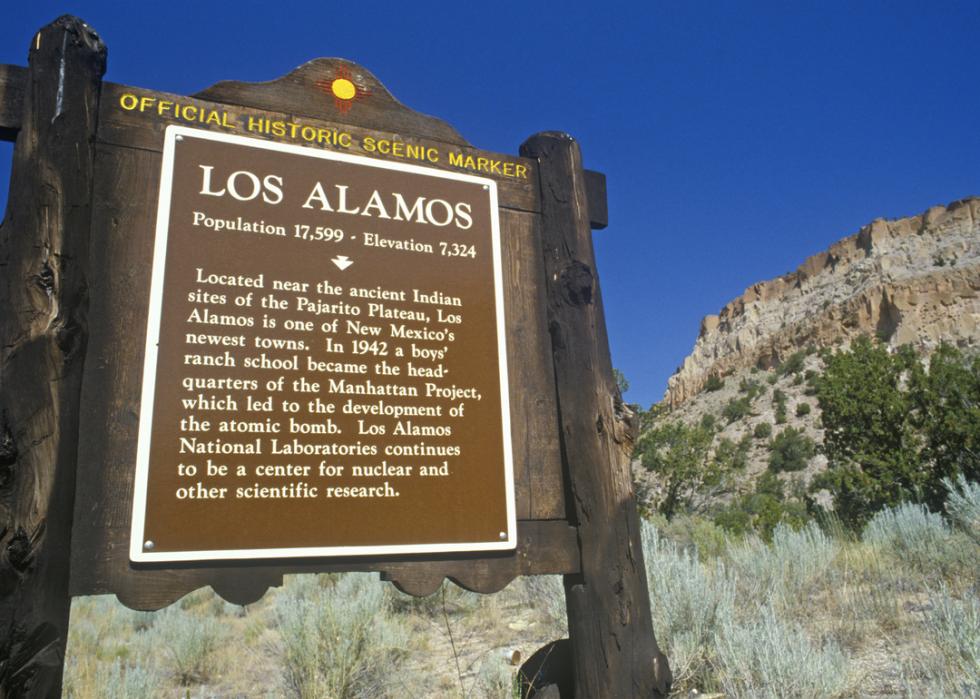
#1. Los Alamos County

Joseph Sohm // Shutterstock

29 / 29

#1. Los Alamos County

- Economic connectedness: 1.12
- Median Income: $123,677
- Population: 19,169
--- 81.3% white
--- 1.1% Black
--- 0.8% American Indian and Alaska Native
--- 5.4% Asian

This story features data reporting and writing by Dom DiFurio and is part of a series utilizing data automation across 50 states.