
Canva
1 / 33#33. Mora County
- Opioid dispensing rate: 2.0 per 100 people
--- 95.1% lower than state average
--- 95.4% lower than national average
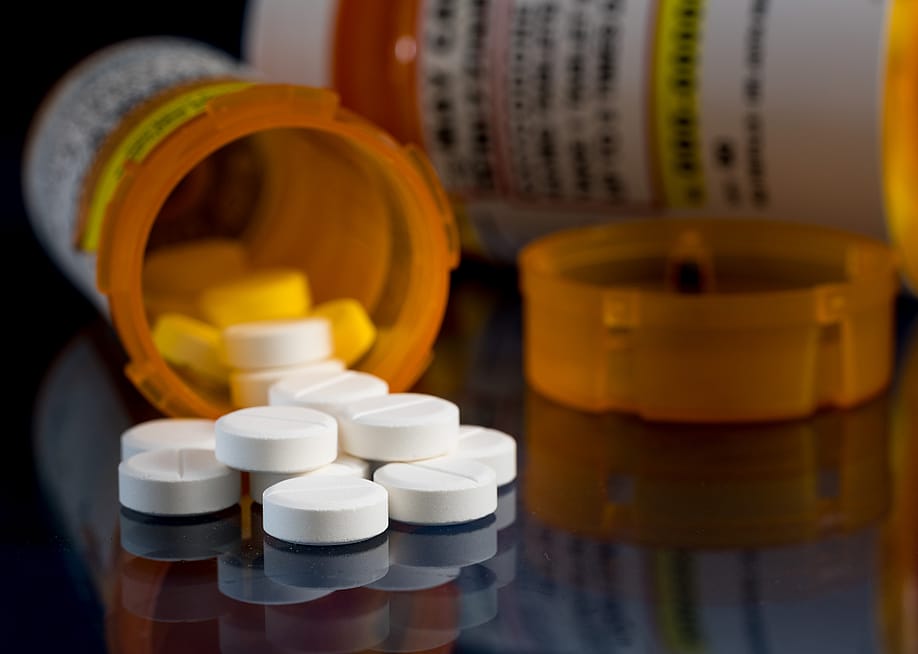
When Purdue Pharma first began sales of OxyContin in the late 1990s, it was advertised as relief for cancer patients and people with chronic pain. Aggressive marketing fueled the drug's popularity, along with that of other opioid pain management drugs on the market. But as the company touted OxyContin to physicians, it downplayed the drug's addictiveness, according to confidential Justice Department reports obtained by news organizations, leading to widespread use that has fueled an opioid epidemic across the U.S.
More than 645,000 people have died from opioid-related overdoses between 1999 and 2021, according to the Centers for Disease Control and Prevention. Provisional data shows just under 80,000 people died in 2022 alone.
Opioid prescriptions have decreased dramatically over the past decade as physicians and public health officials learned about the dangers of OxyContin and other opioids prescribed for pain management. In 2020, the most recent year with data available, the national opioid dispense rate reached 43.3 per 100 people, the lowest rate ever recorded.
A 2022 study funded by the National Institute on Drug Abuse found that counties with higher dispensing rates had more cases of opioid misuse and dependence. The study suggested that reducing prescriptions at the local level can lower a community's rate of opioid abuse or misuse.
Other studies, however, have suggested that decreasing prescriptions may have fueled a new phase of the opioid epidemic: the rise of synthetics like fentanyl. In 2020, synthetics accounted for 82% of all opioid deaths.
It's also important to note that, as awareness has grown about the dangers of dispensing opioid prescription painkillers, more health care professionals are also prescribing medications like Suboxone–which contains buprenorphine and naloxone—for the treatment of addiction and opioid use disorders. While Suboxone is also an opioid medication, it works differently than typical opioid painkillers, blocking the effects of more powerful and addictive opioids to deter intentional misuse.
Using data from the Centers for Disease Control and Prevention, Ophelia broke down counties in every state with the highest opioid dispense rates. In the case of a tie, the county with the higher population and higher raw number is ranked higher. Data was available for 98% of counties in the United States. Overall in New Mexico, the opioid dispensing rate was 40.5 per 100 people, compared to 43.3 nationally.
Read the national story for additional historical context and see where other counties outside of New Mexico stand.
Canva
1 / 33- Opioid dispensing rate: 2.0 per 100 people
--- 95.1% lower than state average
--- 95.4% lower than national average

Canva
2 / 33- Opioid dispensing rate: 5.3 per 100 people
--- 86.9% lower than state average
--- 87.8% lower than national average

Canva
3 / 33- Opioid dispensing rate: 6.6 per 100 people
--- 83.7% lower than state average
--- 84.8% lower than national average

StockPhotoAstur // Shutterstock
4 / 33- Opioid dispensing rate: 13.0 per 100 people
--- 67.9% lower than state average
--- 70.0% lower than national average

Canva
5 / 33- Opioid dispensing rate: 13.5 per 100 people
--- 66.7% lower than state average
--- 68.8% lower than national average

Canva
6 / 33- Opioid dispensing rate: 14.2 per 100 people
--- 64.9% lower than state average
--- 67.2% lower than national average

Canva
7 / 33- Opioid dispensing rate: 14.2 per 100 people
--- 64.9% lower than state average
--- 67.2% lower than national average

Canva
8 / 33- Opioid dispensing rate: 19.1 per 100 people
--- 52.8% lower than state average
--- 55.9% lower than national average

Canva
9 / 33- Opioid dispensing rate: 19.7 per 100 people
--- 51.4% lower than state average
--- 54.5% lower than national average

turtix // Shutterstock
10 / 33- Opioid dispensing rate: 21.6 per 100 people
--- 46.7% lower than state average
--- 50.1% lower than national average

Canva
11 / 33- Opioid dispensing rate: 24.0 per 100 people
--- 40.7% lower than state average
--- 44.6% lower than national average

Robin Nations // Shutterstock
12 / 33- Opioid dispensing rate: 27.4 per 100 people
--- 32.3% lower than state average
--- 36.7% lower than national average

Gestalt Imagery // Shutterstock
13 / 33- Opioid dispensing rate: 28.1 per 100 people
--- 30.6% lower than state average
--- 35.1% lower than national average

Canva
14 / 33- Opioid dispensing rate: 30.7 per 100 people
--- 24.2% lower than state average
--- 29.1% lower than national average

Canva
15 / 33- Opioid dispensing rate: 31.9 per 100 people
--- 21.2% lower than state average
--- 26.3% lower than national average

Canva
16 / 33- Opioid dispensing rate: 32.9 per 100 people
--- 18.8% lower than state average
--- 24.0% lower than national average

Kristi Blokhin // Shutterstock
17 / 33- Opioid dispensing rate: 33.1 per 100 people
--- 18.3% lower than state average
--- 23.6% lower than national average
Canva
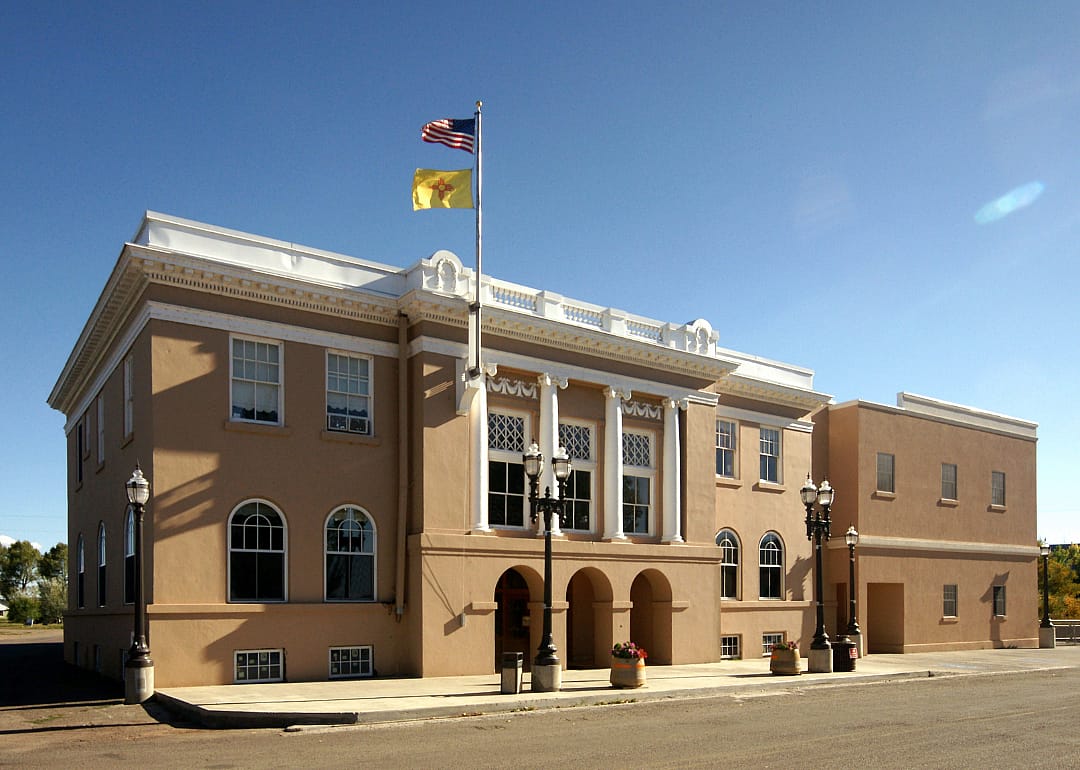
18 / 33- Opioid dispensing rate: 33.4 per 100 people
--- 17.5% lower than state average
--- 22.9% lower than national average

David Langford // Shutterstock
19 / 33- Opioid dispensing rate: 34.0 per 100 people
--- 16.0% lower than state average
--- 21.5% lower than national average

Canva
20 / 33- Opioid dispensing rate: 35.1 per 100 people
--- 13.3% lower than state average
--- 18.9% lower than national average

Joseph Sohm // Shutterstock
21 / 33- Opioid dispensing rate: 35.6 per 100 people
--- 12.1% lower than state average
--- 17.8% lower than national average

Underawesternsky // Shutterstock
22 / 33- Opioid dispensing rate: 40.1 per 100 people
--- 1.0% lower than state average
--- 7.4% lower than national average

Canva
23 / 33- Opioid dispensing rate: 43.4 per 100 people
--- 7.2% higher than state average
--- 0.2% higher than national average

Canva
24 / 33- Opioid dispensing rate: 43.8 per 100 people
--- 8.1% higher than state average
--- 1.2% higher than national average

Rosemarie Mosteller // Shutterstock
25 / 33- Opioid dispensing rate: 44.9 per 100 people
--- 10.9% higher than state average
--- 3.7% higher than national average

Canva
26 / 33- Opioid dispensing rate: 45.8 per 100 people
--- 13.1% higher than state average
--- 5.8% higher than national average
Jimack // Shutterstock
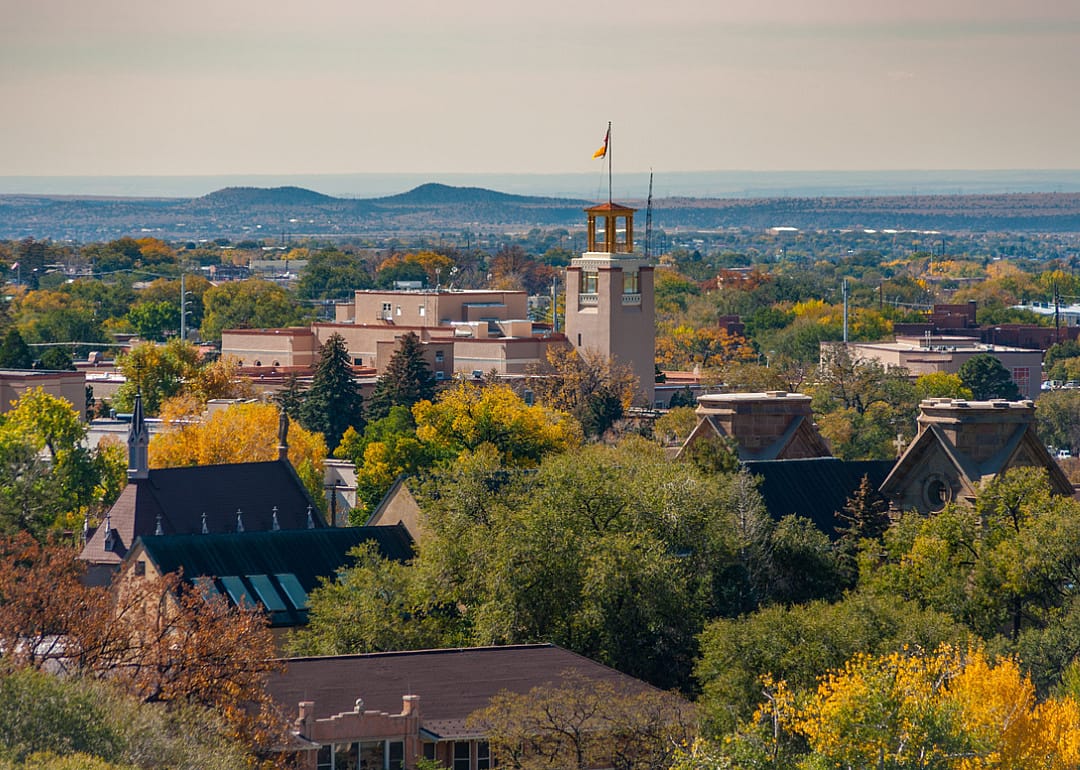
27 / 33- Opioid dispensing rate: 49.5 per 100 people
--- 22.2% higher than state average
--- 14.3% higher than national average
Cheri Alguire // Shutterstock
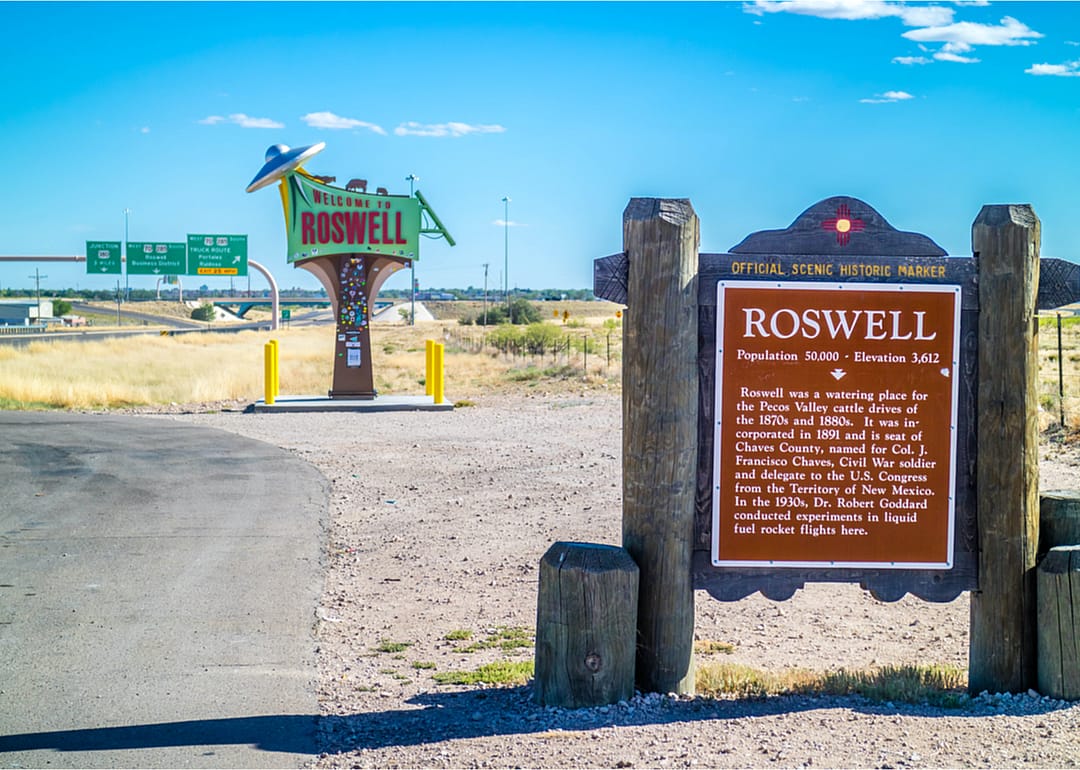
28 / 33- Opioid dispensing rate: 50.0 per 100 people
--- 23.5% higher than state average
--- 15.5% higher than national average

Canva
29 / 33- Opioid dispensing rate: 52.0 per 100 people
--- 28.4% higher than state average
--- 20.1% higher than national average

Canva
30 / 33- Opioid dispensing rate: 62.5 per 100 people
--- 54.3% higher than state average
--- 44.3% higher than national average

Canva
31 / 33- Opioid dispensing rate: 74.9 per 100 people
--- 84.9% higher than state average
--- 73.0% higher than national average

Canva
32 / 33- Opioid dispensing rate: 79.1 per 100 people
--- 95.3% higher than state average
--- 82.7% higher than national average

Canva
33 / 33- Opioid dispensing rate: 108.2 per 100 people
--- 167.2% higher than state average
--- 149.9% higher than national average



