Several factors contribute to cancer rates, from personal habits and genetics to air pollution or groundwater quality in a given area. People experiencing social, economic, or environmental disadvantages are disproportionately affected by high cancer rates in certain regions—including access or barriers to early screening and care.
Cancer rates also fluctuate by jobs: Higher rates of cancer can be found among meat industry and rubber manufacturing workers, and farmers.
Stacker compiled the counties with the highest cancer rates in New York using data from the CDC. Keep reading to see where in your state cancer cases are the most common.
You may also like: Best lookout points in New York by visitors
#50. Franklin County
- Cancer rate per 100,000, 2016-2020: 620.0
- Age-adjusted rate per 100,000, 2016-2020: 478.3
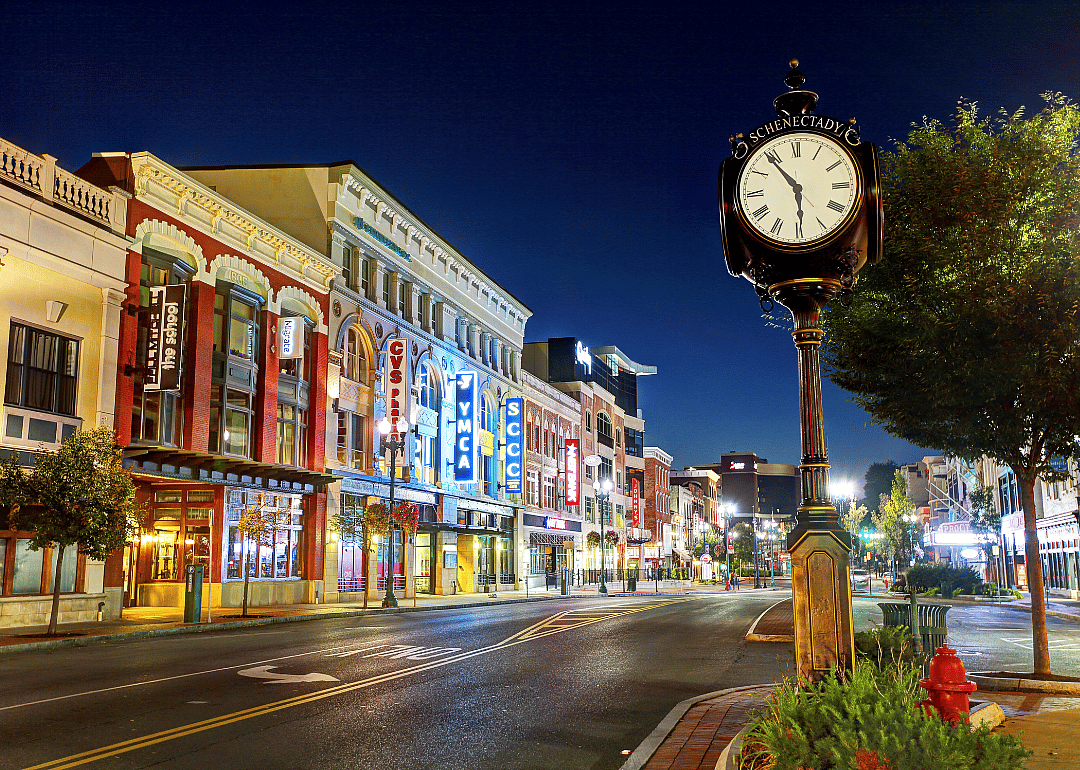
#49. Schenectady County
- Cancer rate per 100,000, 2016-2020: 633.3
- Age-adjusted rate per 100,000, 2016-2020: 492.6
Roman Babakin // Shutterstock
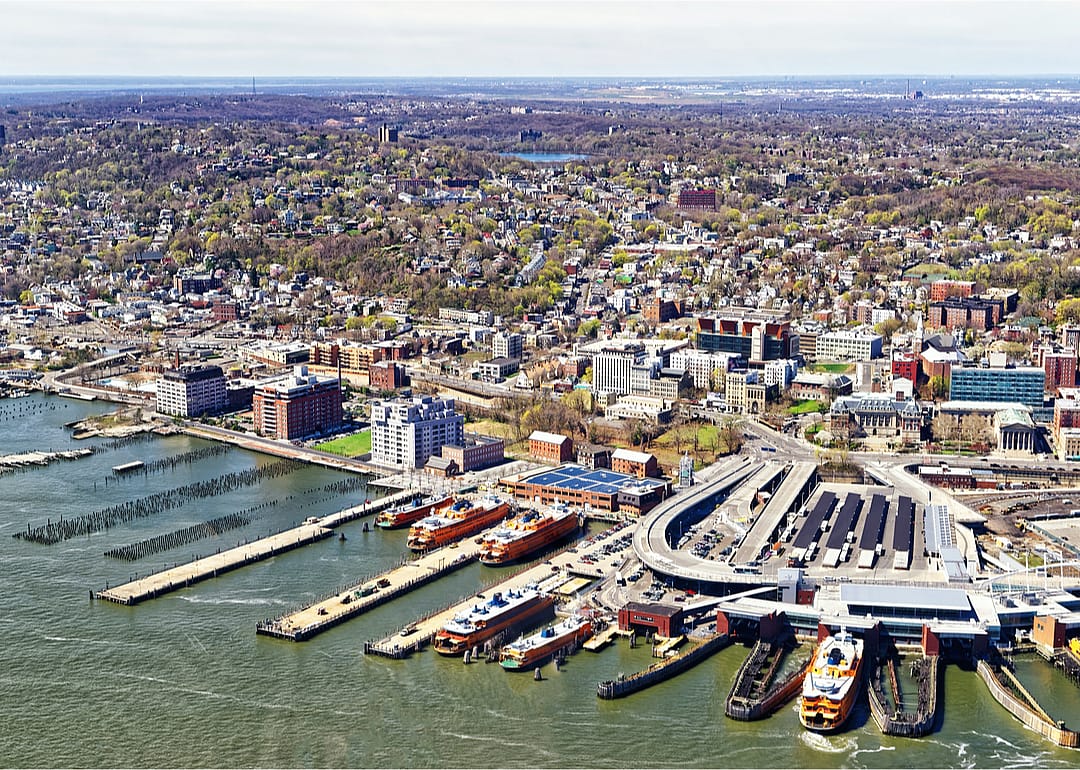
3 / 50#48. Richmond County
- Cancer rate per 100,000, 2016-2020: 639.5
- Age-adjusted rate per 100,000, 2016-2020: 517.4
debra millet // Shutterstock
4 / 50#47. Madison County
- Cancer rate per 100,000, 2016-2020: 643.2
- Age-adjusted rate per 100,000, 2016-2020: 473.2
James Kirkikis // Shutterstock
5 / 50North woodsman // Shutterstock
6 / 50#45. Lewis County
- Cancer rate per 100,000, 2016-2020: 645.6
- Age-adjusted rate per 100,000, 2016-2020: 473.3
Paige Petrie // Shutterstock
7 / 50#44. Allegany County
- Cancer rate per 100,000, 2016-2020: 645.7
- Age-adjusted rate per 100,000, 2016-2020: 484.1
Richard Cavalleri // Shutterstock
8 / 50#43. Clinton County
- Cancer rate per 100,000, 2016-2020: 648.4
- Age-adjusted rate per 100,000, 2016-2020: 500.7
Wangkun Jia // Shutterstock
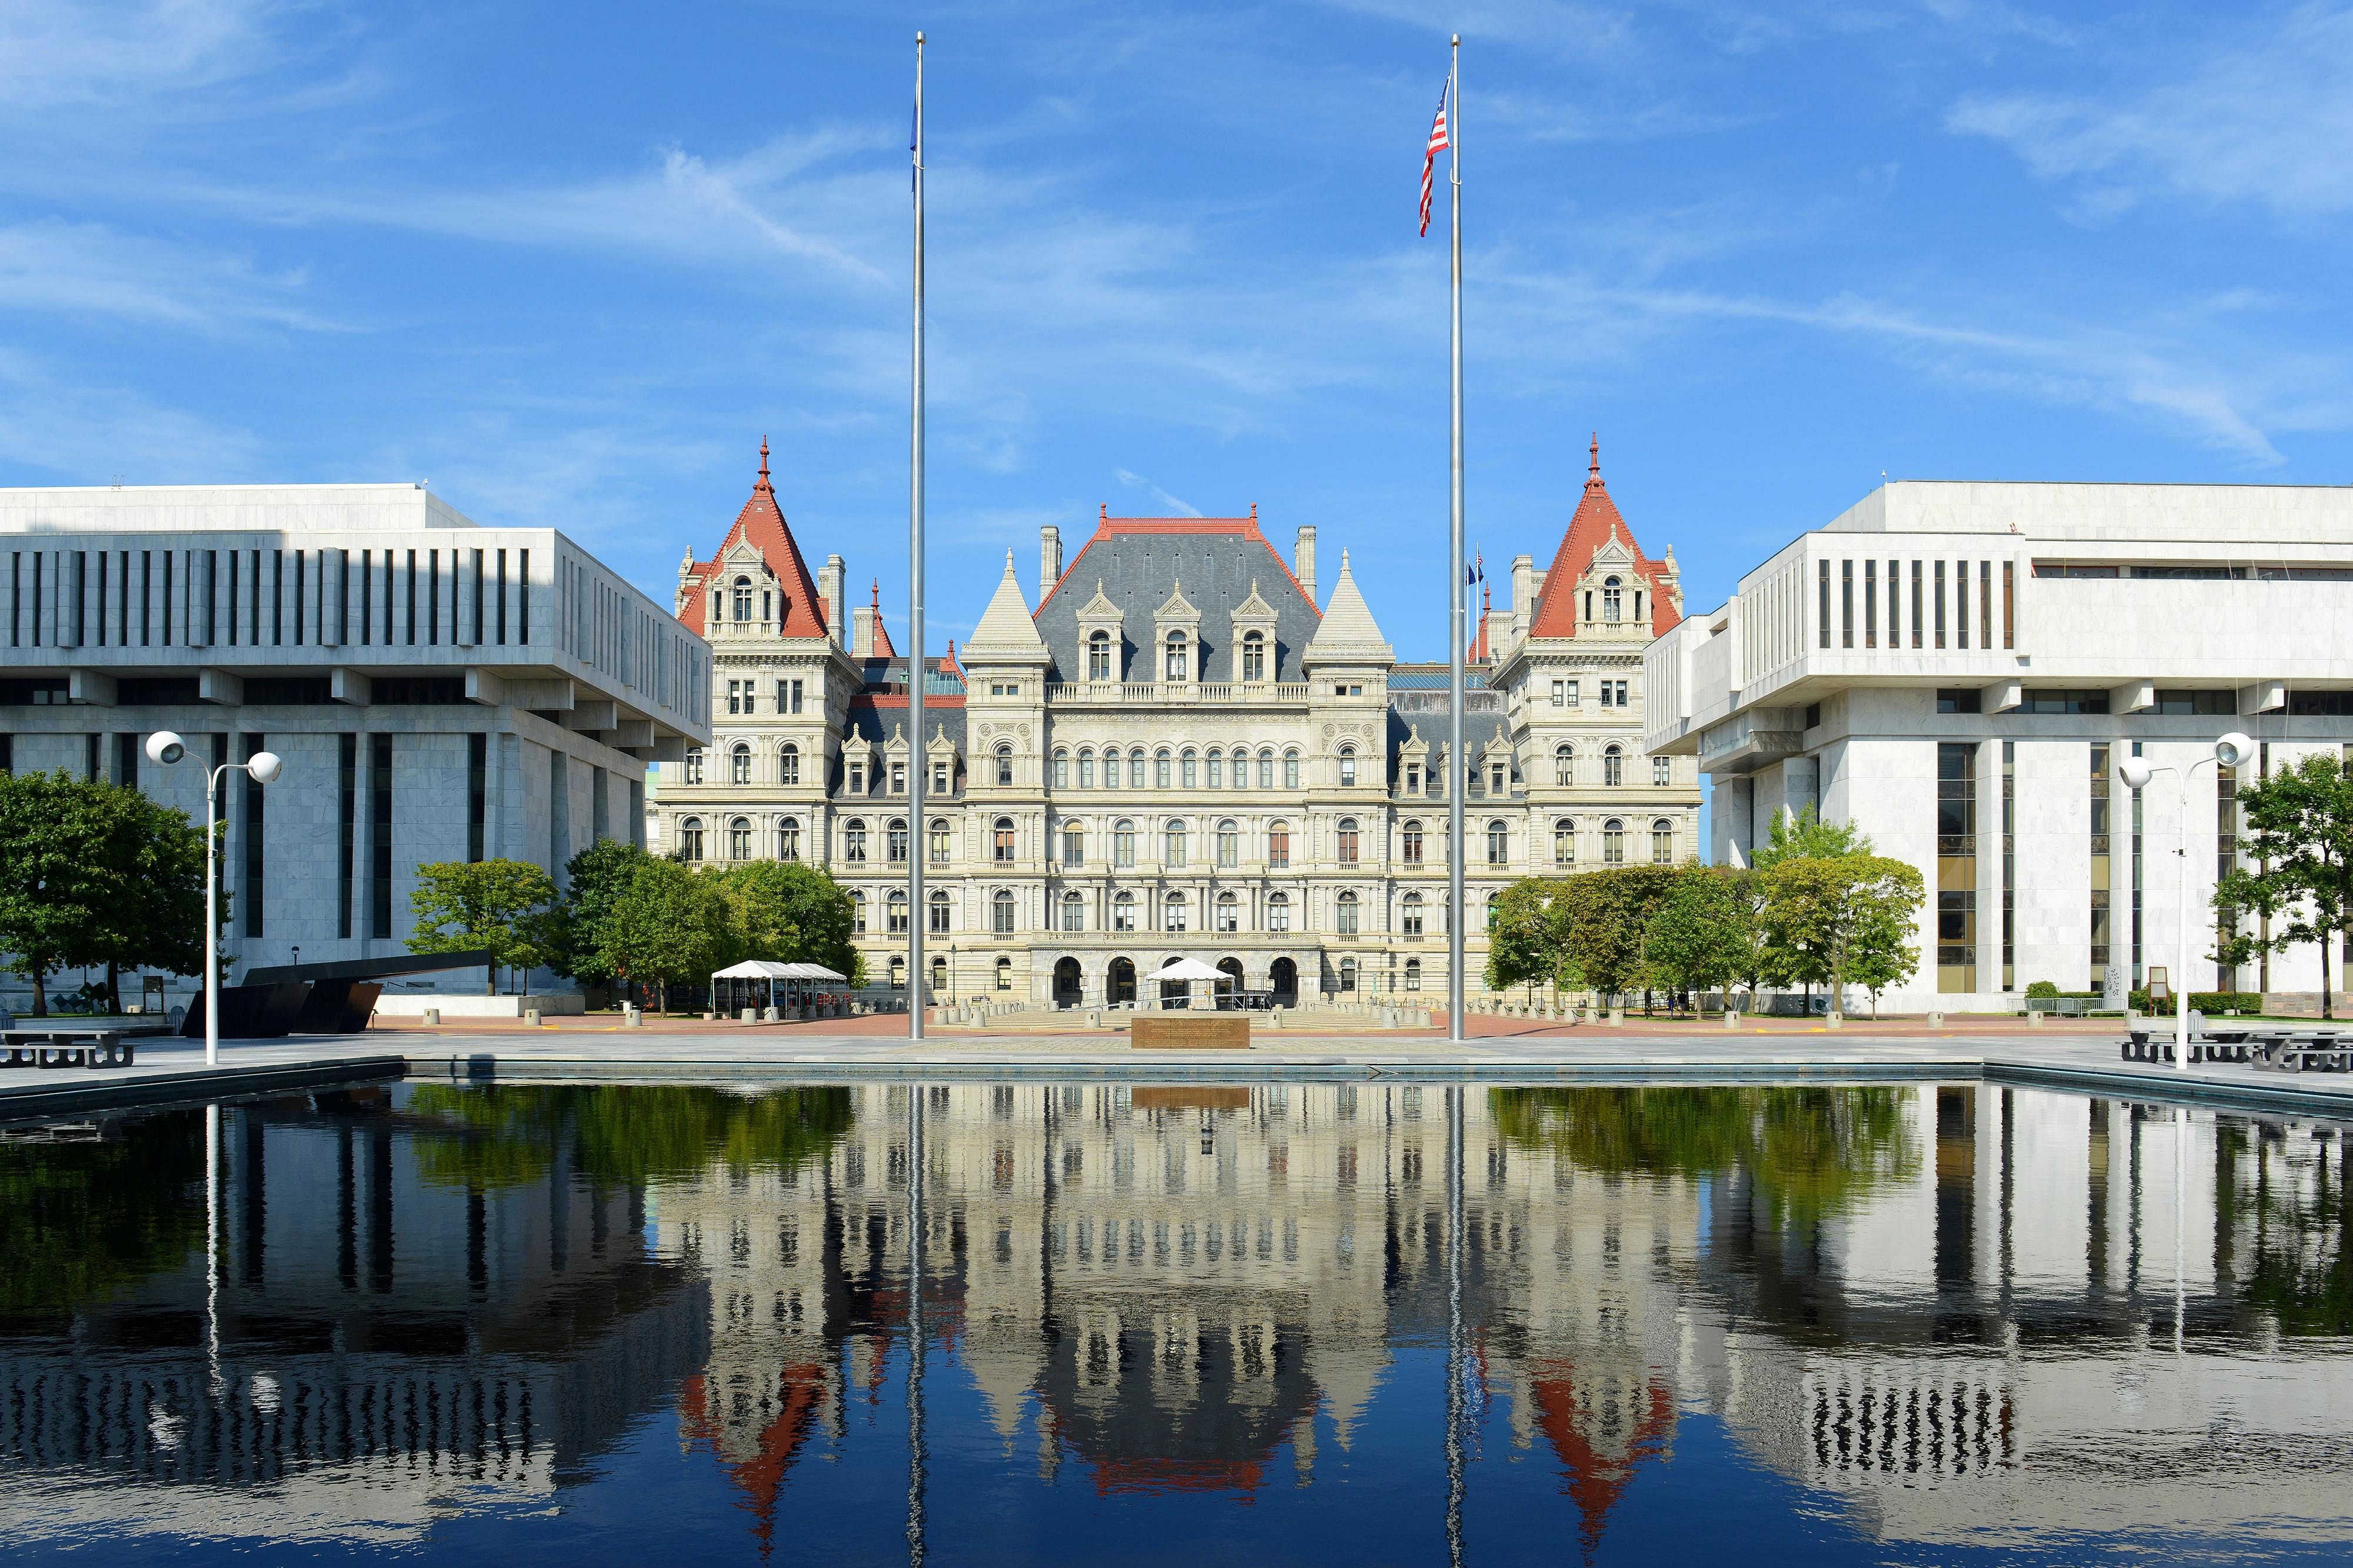
9 / 50#42. Albany County
- Cancer rate per 100,000, 2016-2020: 648.8
- Age-adjusted rate per 100,000, 2016-2020: 518.2
Paul Brady Photography // Shutterstock
10 / 50Stef Ko // Shutterstock
11 / 50#40. Cortland County
- Cancer rate per 100,000, 2016-2020: 652.3
- Age-adjusted rate per 100,000, 2016-2020: 537.0
littlenySTOCK // Shutterstock
12 / 50#39. Onondaga County
- Cancer rate per 100,000, 2016-2020: 654.1
- Age-adjusted rate per 100,000, 2016-2020: 510.9
#38. Ulster County
- Cancer rate per 100,000, 2016-2020: 655.3
- Age-adjusted rate per 100,000, 2016-2020: 458.0
littlenySTOCK // Shutterstock
14 / 50#37. Nassau County
- Cancer rate per 100,000, 2016-2020: 659.0
- Age-adjusted rate per 100,000, 2016-2020: 499.4
Joe Trentacosti // Shutterstock
16 / 50#35. Steuben County
- Cancer rate per 100,000, 2016-2020: 665.5
- Age-adjusted rate per 100,000, 2016-2020: 476.3
#34. Livingston County
- Cancer rate per 100,000, 2016-2020: 668.2
- Age-adjusted rate per 100,000, 2016-2020: 498.3
#33. Suffolk County
- Cancer rate per 100,000, 2016-2020: 675.0
- Age-adjusted rate per 100,000, 2016-2020: 522.0
Nina Alizada // Shutterstock
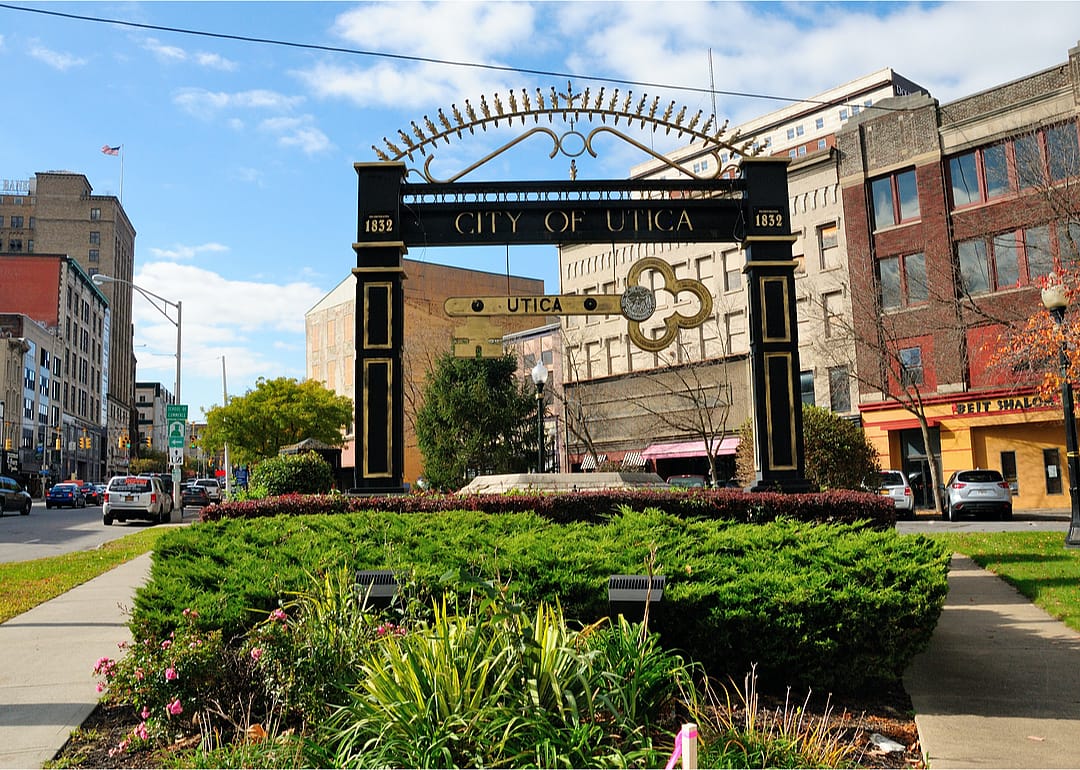
19 / 50#32. Oneida County
- Cancer rate per 100,000, 2016-2020: 676.2
- Age-adjusted rate per 100,000, 2016-2020: 502.8
Wangkun Jia // Shutterstock
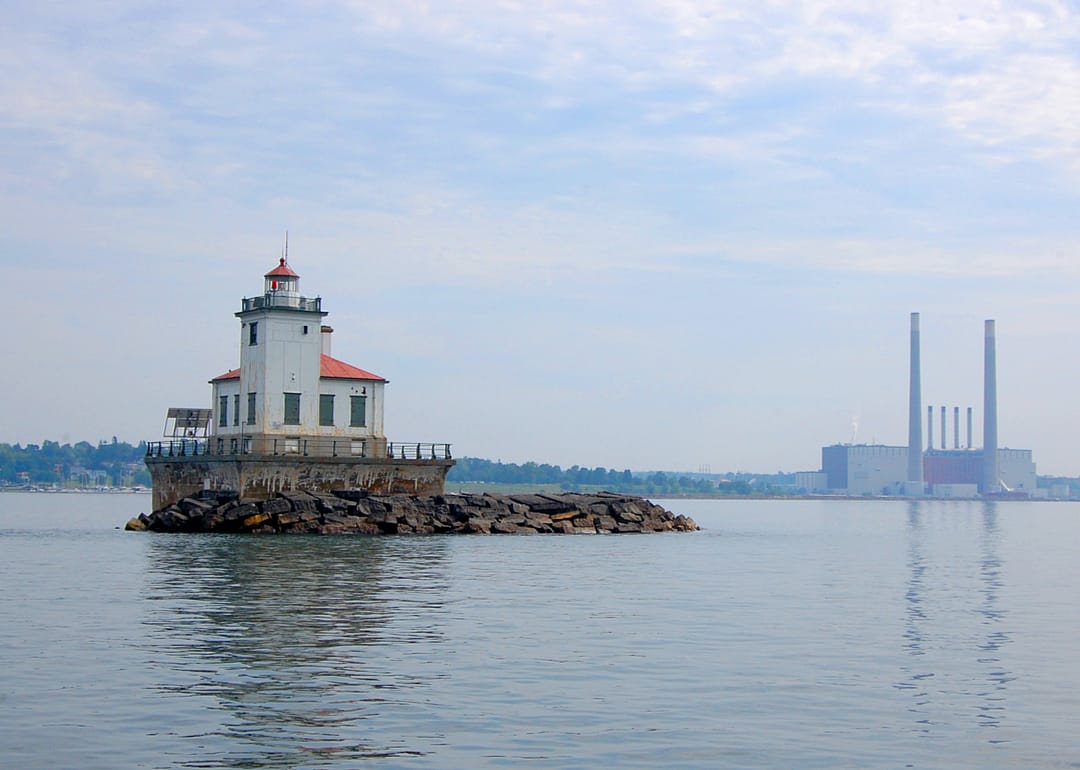
21 / 50#30. Oswego County
- Cancer rate per 100,000, 2016-2020: 684.2
- Age-adjusted rate per 100,000, 2016-2020: 540.3
PhotoItaliaStudio // Shutterstock
22 / 50#29. Saratoga County
- Cancer rate per 100,000, 2016-2020: 684.7
- Age-adjusted rate per 100,000, 2016-2020: 506.3
#28. Cattaraugus County
- Cancer rate per 100,000, 2016-2020: 687.2
- Age-adjusted rate per 100,000, 2016-2020: 496.4
Kenneth Sponsler // Shutterstock
24 / 50#27. Otsego County
- Cancer rate per 100,000, 2016-2020: 688.0
- Age-adjusted rate per 100,000, 2016-2020: 481.3
tomtsya// Shutterstock
25 / 50#25. Erie County
- Cancer rate per 100,000, 2016-2020: 707.3
- Age-adjusted rate per 100,000, 2016-2020: 534.0
#24. Chemung County
- Cancer rate per 100,000, 2016-2020: 707.6
- Age-adjusted rate per 100,000, 2016-2020: 518.1
fandangle // Shutterstock
28 / 50#23. Herkimer County
- Cancer rate per 100,000, 2016-2020: 708.2
- Age-adjusted rate per 100,000, 2016-2020: 491.3
#22. Montgomery County
- Cancer rate per 100,000, 2016-2020: 712.5
- Age-adjusted rate per 100,000, 2016-2020: 525.6
#20. Wyoming County
- Cancer rate per 100,000, 2016-2020: 713.5
- Age-adjusted rate per 100,000, 2016-2020: 527.5
#19. Schoharie County
- Cancer rate per 100,000, 2016-2020: 713.7
- Age-adjusted rate per 100,000, 2016-2020: 466.6
#18. Seneca County
- Cancer rate per 100,000, 2016-2020: 716.1
- Age-adjusted rate per 100,000, 2016-2020: 525.2
WCohen // Shutterstock
34 / 50#17. Tioga County
- Cancer rate per 100,000, 2016-2020: 716.9
- Age-adjusted rate per 100,000, 2016-2020: 494.6
#15. Wayne County
- Cancer rate per 100,000, 2016-2020: 721.2
- Age-adjusted rate per 100,000, 2016-2020: 515.3
#14. Yates County
- Cancer rate per 100,000, 2016-2020: 721.5
- Age-adjusted rate per 100,000, 2016-2020: 507.0
#13. Washington County
- Cancer rate per 100,000, 2016-2020: 723.0
- Age-adjusted rate per 100,000, 2016-2020: 505.5
Sean McDonald // Shutterstock
39 / 50#12. Chenango County
- Cancer rate per 100,000, 2016-2020: 733.5
- Age-adjusted rate per 100,000, 2016-2020: 508.1
SevenMaps // Shutterstock
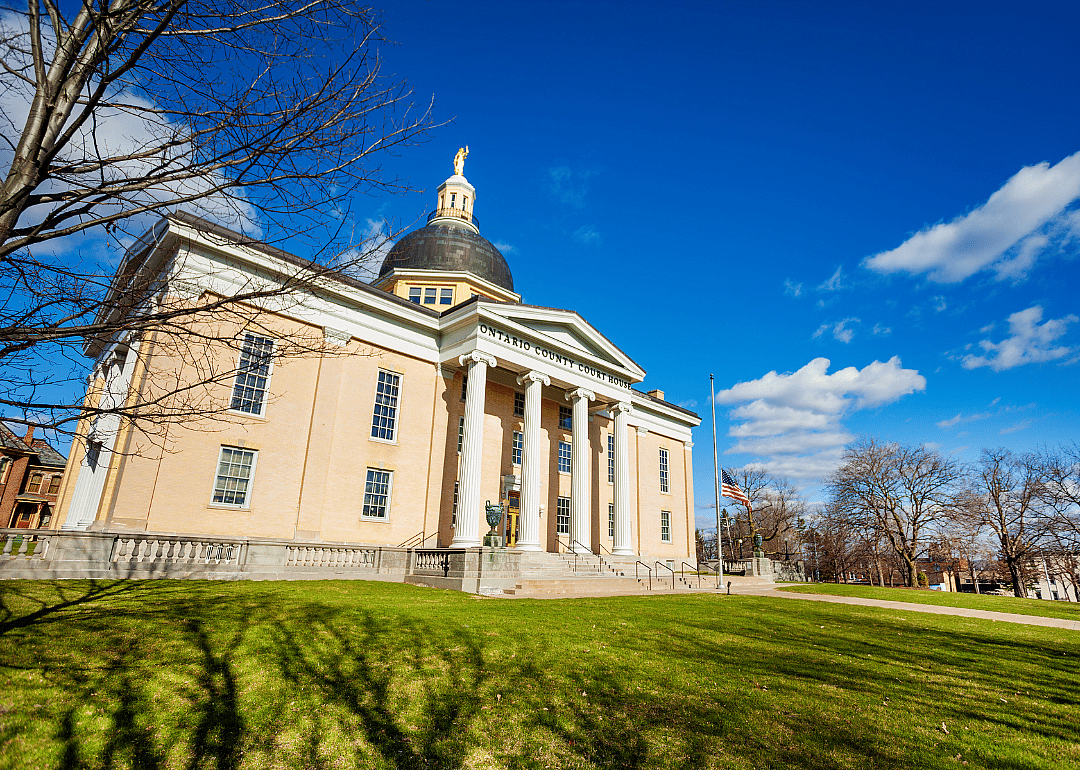
40 / 50#10. Ontario County
- Cancer rate per 100,000, 2016-2020: 744.4
- Age-adjusted rate per 100,000, 2016-2020: 517.5
#9. Chautauqua County
- Cancer rate per 100,000, 2016-2020: 745.4
- Age-adjusted rate per 100,000, 2016-2020: 527.1
Sue Smith // Shutterstock
43 / 50#8. Fulton County
- Cancer rate per 100,000, 2016-2020: 746.1
- Age-adjusted rate per 100,000, 2016-2020: 522.2
Bennekom // Shutterstock
44 / 50#7. Delaware County
- Cancer rate per 100,000, 2016-2020: 758.4
- Age-adjusted rate per 100,000, 2016-2020: 468.4
Mihai_Andritoiu // Shutterstock
45 / 50Felix Lipov // Shutterstock
46 / 50#5. Greene County
- Cancer rate per 100,000, 2016-2020: 780.8
- Age-adjusted rate per 100,000, 2016-2020: 510.7
#4. Schuyler County
- Cancer rate per 100,000, 2016-2020: 791.3
- Age-adjusted rate per 100,000, 2016-2020: 526.9
#3. Warren County
- Cancer rate per 100,000, 2016-2020: 802.7
- Age-adjusted rate per 100,000, 2016-2020: 515.7
#2. Columbia County
- Cancer rate per 100,000, 2016-2020: 804.4
- Age-adjusted rate per 100,000, 2016-2020: 495.8