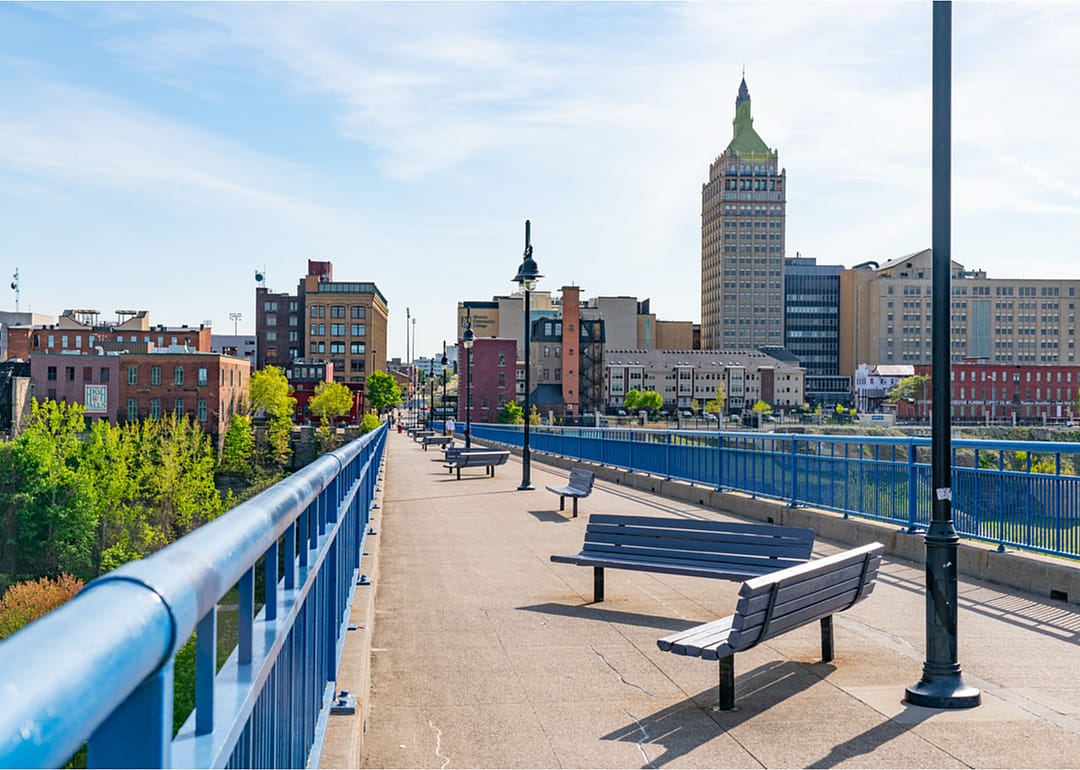
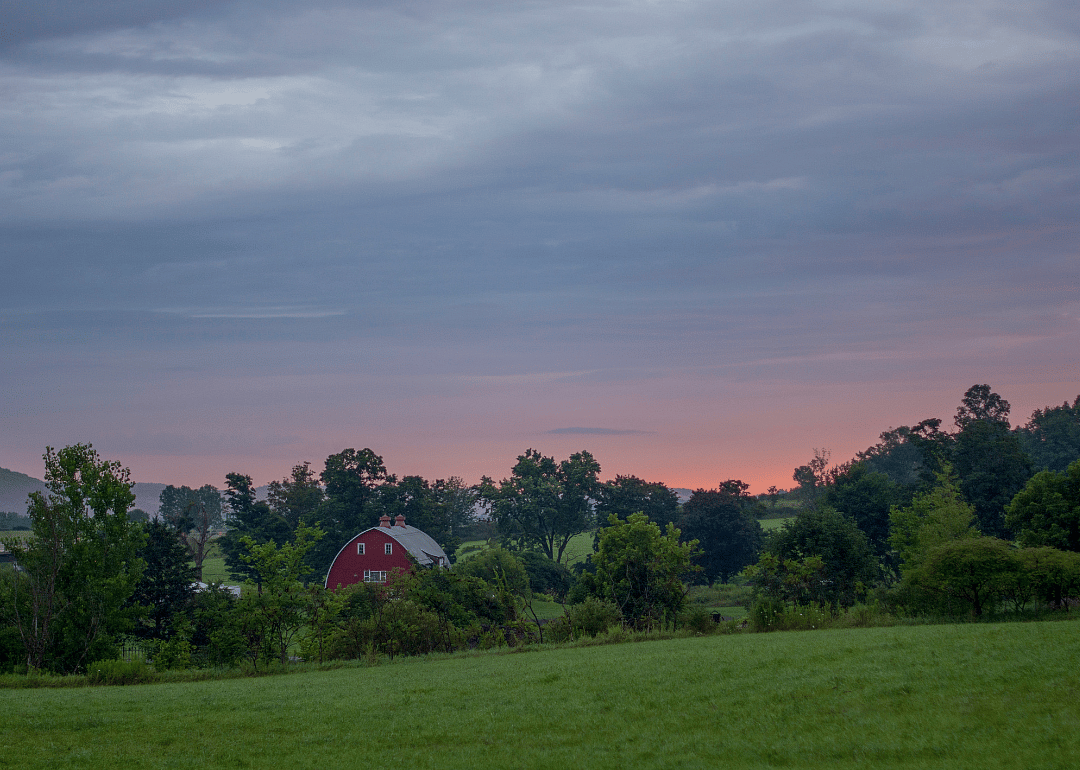
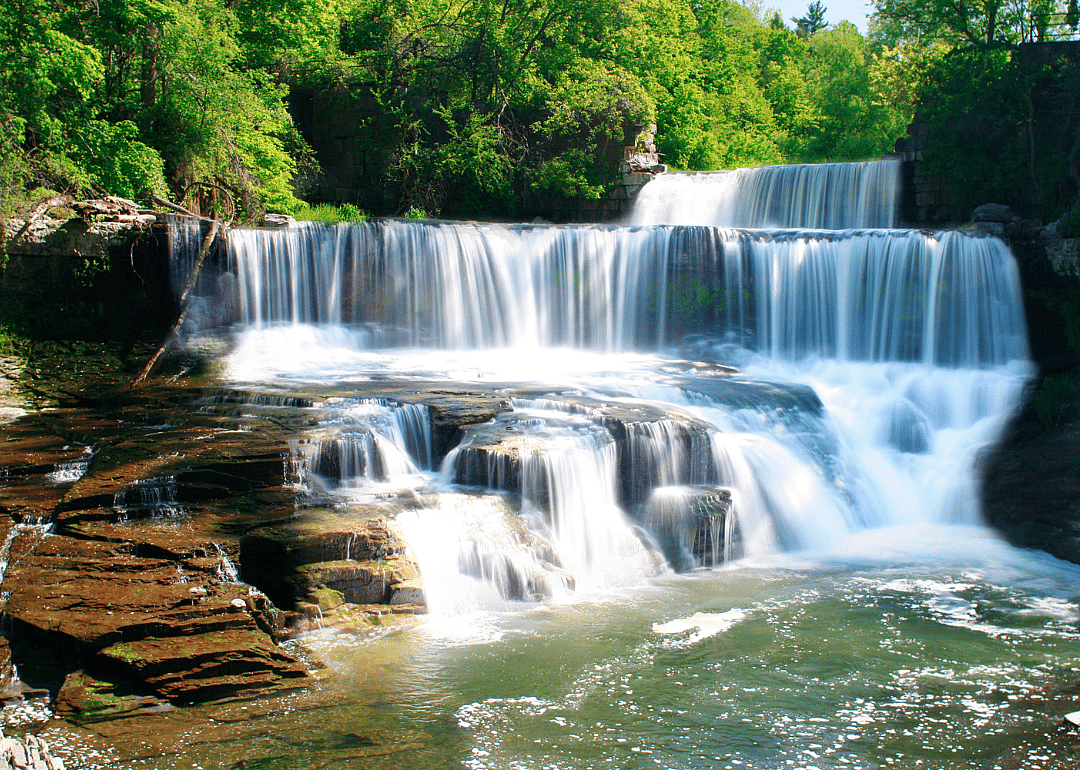
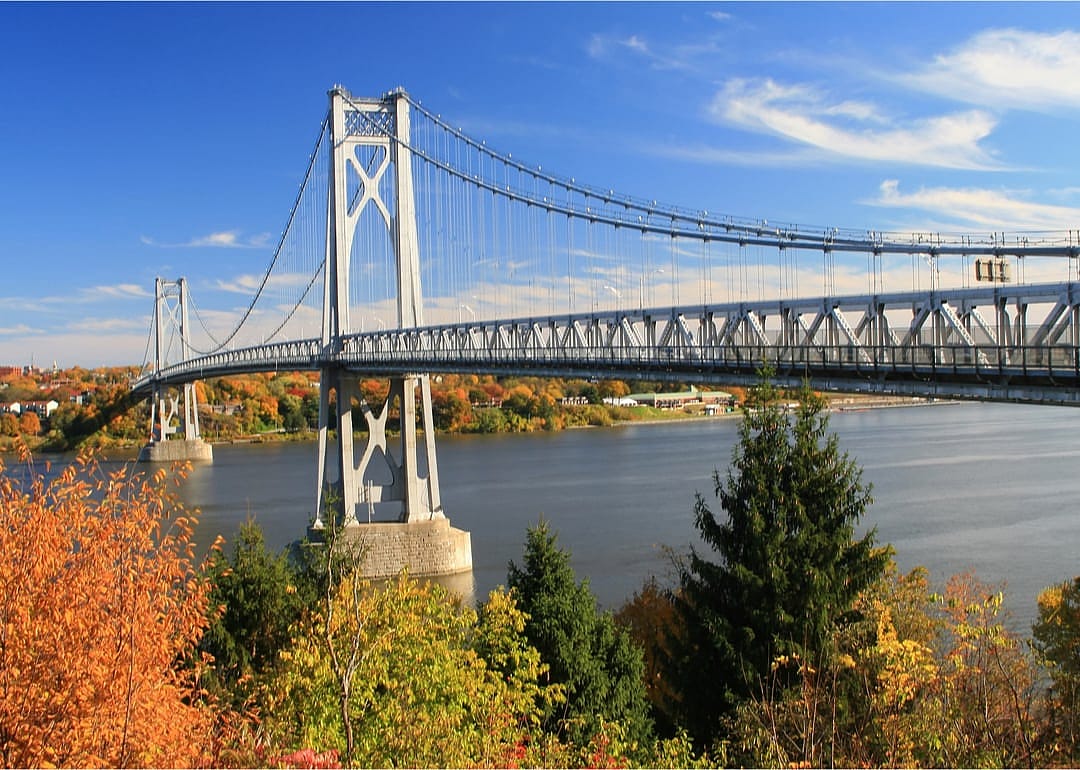
During the past winter, parts of California experienced massive amounts of rain and snow. Though it momentarily eased the frequent drought periods that had been affecting the state, the surge in rainfall flooded roads, knocked out power, and broke levees. Fueled by multiple converging atmospheric rivers, the state's infrastructure was not able to capture all of the excess water, meaning water shortages could again return during future dry spells.
Climate change can both intensify rainfall and also extend droughts. Warmer temperatures increase rates of evaporation, pulling more water from the ocean and causing more precipitation overall. Data indicates single-day precipitation extremes are happening more frequently. Conversely, more evaporation also dries out surface water and soil, leaving less fresh water available. Even as the moist air from oceans and other sources returns to land as rain, sleet, or snow, inconsistent wind patterns and currents mean it isn't distributed evenly. That's why even as some counties experienced their wettest year on record, others experienced their driest.
Nationwide, 43% of counties reported precipitation over the past year greater than their long-term average. A 1,000-year event dumped 25 inches of rainfall over 24 hours in Fort Lauderdale on April 13. Nevada desert regions experienced thunderstorms and heavy rain in June. Severe weather through the mid-Atlantic in August brought tennis ball-sized hail to West Virginia and softball-sized hail and flash flooding in Maryland.
Using data from the National Centers for Environmental Information, Stacker identified counties in New York that received the most precipitation from September 2022 to August 2023 compared to their average annual precipitation from 1901 to 2000. In the case of a tie, the amount of precipitation over the past year served as a tiebreaker.
Read on to see which counties reported more precipitation over the past year than usual.
You may also like: Breweries with the most highly ranked beers in New York
#50. Genesee County
- Precipitation over the past year: 37.4 inches
- Comparison to 1901-2000 average: 3.4 inches above average (#31 rainiest September-August period since 1895)
- Comparison to state's precipitation over past year: 9.7 inches below statewide average
pisaphotography // Shutterstock
2 / 50#49. New York County
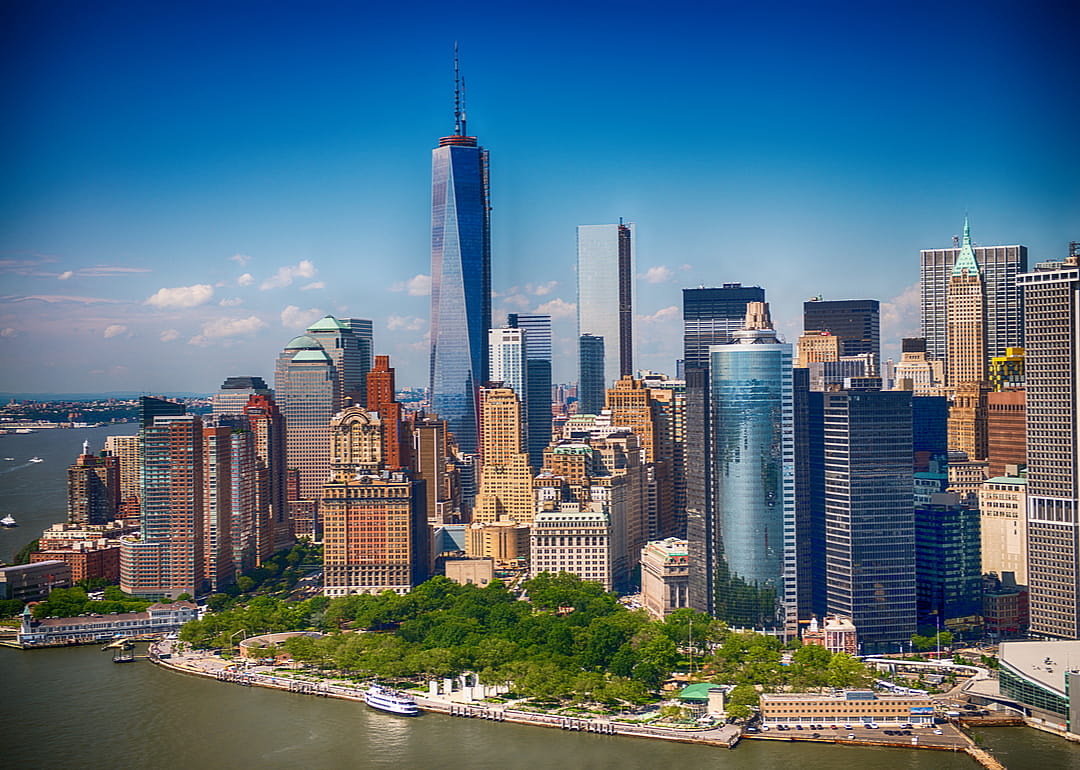
- Precipitation over the past year: 48.6 inches
- Comparison to 1901-2000 average: 3.7 inches above average (#40 rainiest September-August period since 1895)
- Comparison to state's precipitation over past year: 1.5 inches above statewide average
Felix Lipov // Shutterstock
3 / 50#48. Rockland County
- Precipitation over the past year: 50.5 inches
- Comparison to 1901-2000 average: 3.7 inches above average (#43 rainiest September-August period since 1895)
- Comparison to state's precipitation over past year: 3.3 inches above statewide average
#47. Bronx County
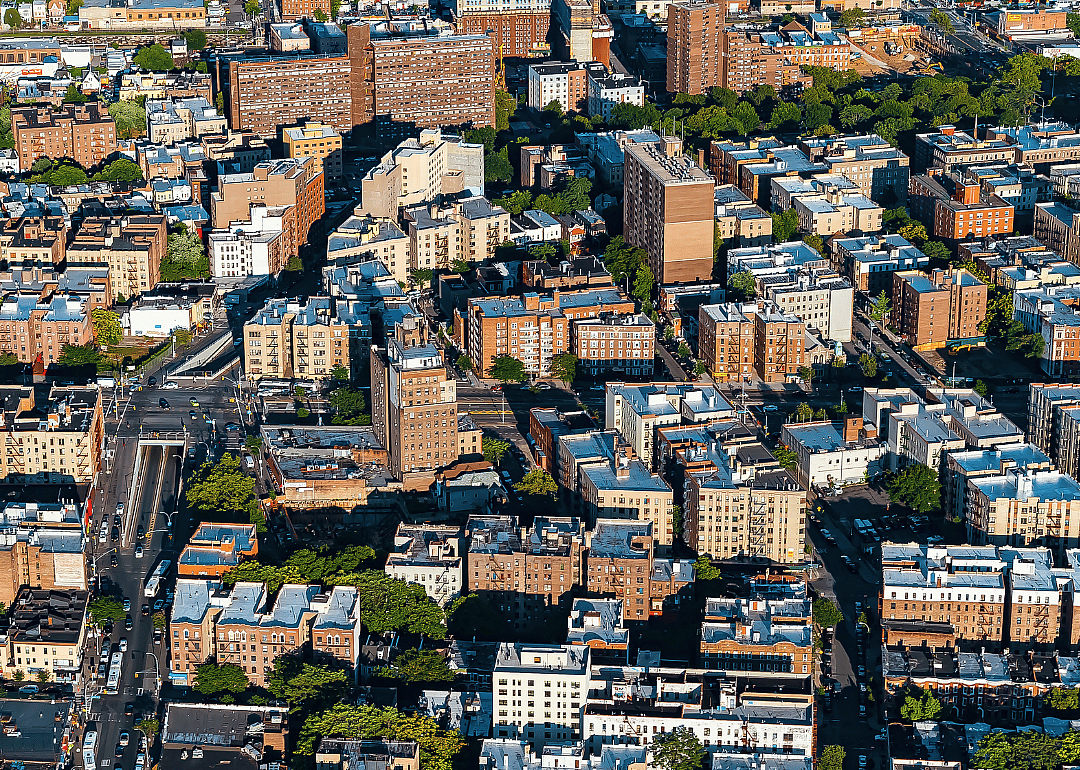
- Precipitation over the past year: 48.8 inches
- Comparison to 1901-2000 average: 3.8 inches above average (#43 rainiest September-August period since 1895)
- Comparison to state's precipitation over past year: 1.7 inches above statewide average
James Kirkikis // Shutterstock
5 / 50#46. Putnam County
- Precipitation over the past year: 50.8 inches
- Comparison to 1901-2000 average: 4.0 inches above average (#36 rainiest September-August period since 1895)
- Comparison to state's precipitation over past year: 3.6 inches above statewide average
You may also like: Most commonly hunted migratory birds in New York
SevenMaps // Shutterstock
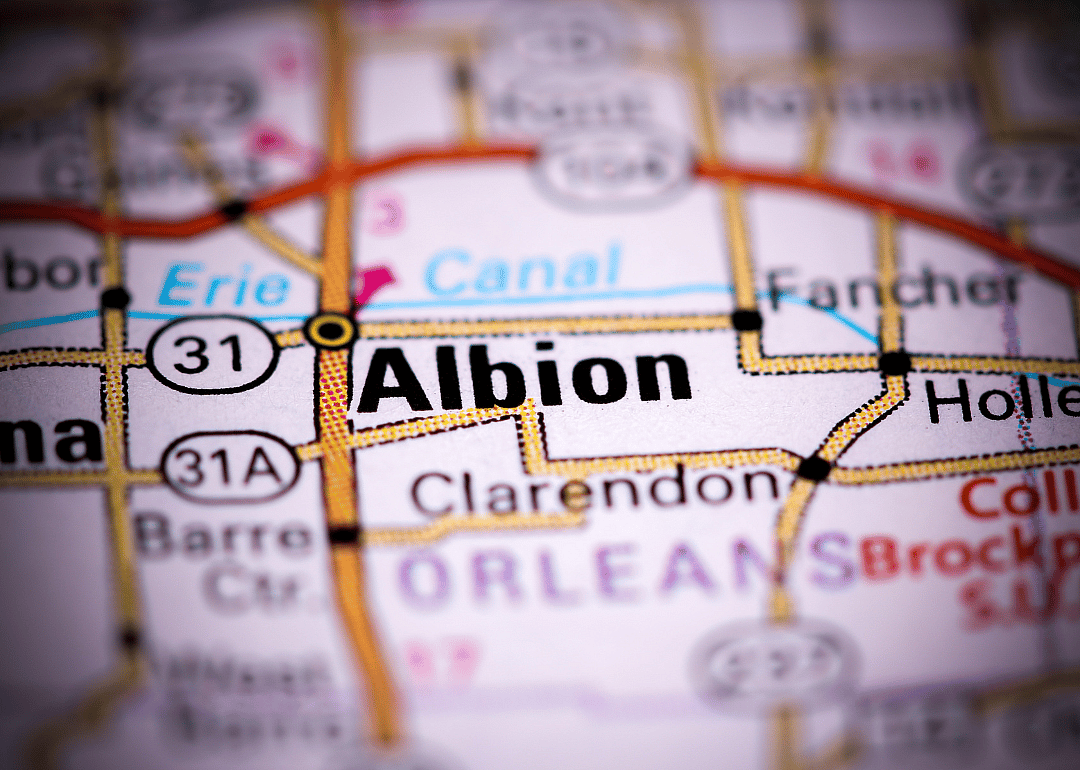
6 / 50#45. Orleans County
- Precipitation over the past year: 36.7 inches
- Comparison to 1901-2000 average: 4.3 inches above average (#26 rainiest September-August period since 1895)
- Comparison to state's precipitation over past year: 10.4 inches below statewide average
Bennekom // Shutterstock
7 / 50#44. Delaware County
- Precipitation over the past year: 47.0 inches
- Comparison to 1901-2000 average: 4.4 inches above average (#37 rainiest September-August period since 1895)
- Comparison to state's precipitation over past year: 0.2 inches below statewide average
#43. Chautauqua County
- Precipitation over the past year: 47.1 inches
- Comparison to 1901-2000 average: 4.5 inches above average (#24 rainiest September-August period since 1895)
- Comparison to state's precipitation over past year: 0.0 inches above statewide average
Paul Brady Photography // Shutterstock
9 / 50#42. Monroe County
- Precipitation over the past year: 36.9 inches
- Comparison to 1901-2000 average: 5.0 inches above average (#21 rainiest September-August period since 1895)
- Comparison to state's precipitation over past year: 10.3 inches below statewide average
#41. Schoharie County
- Precipitation over the past year: 43.7 inches
- Comparison to 1901-2000 average: 5.0 inches above average (#24 rainiest September-August period since 1895)
- Comparison to state's precipitation over past year: 3.5 inches below statewide average
You may also like: Most common jobs 150 years ago in New York
#40. Yates County
- Precipitation over the past year: 37.3 inches
- Comparison to 1901-2000 average: 5.2 inches above average (#26 rainiest September-August period since 1895)
- Comparison to state's precipitation over past year: 9.8 inches below statewide average
Colin D. Young // Shutterstock
12 / 50#39. Dutchess County
- Precipitation over the past year: 49.0 inches
- Comparison to 1901-2000 average: 5.4 inches above average (#31 rainiest September-August period since 1895)
- Comparison to state's precipitation over past year: 1.9 inches above statewide average
Mihai_Andritoiu // Shutterstock
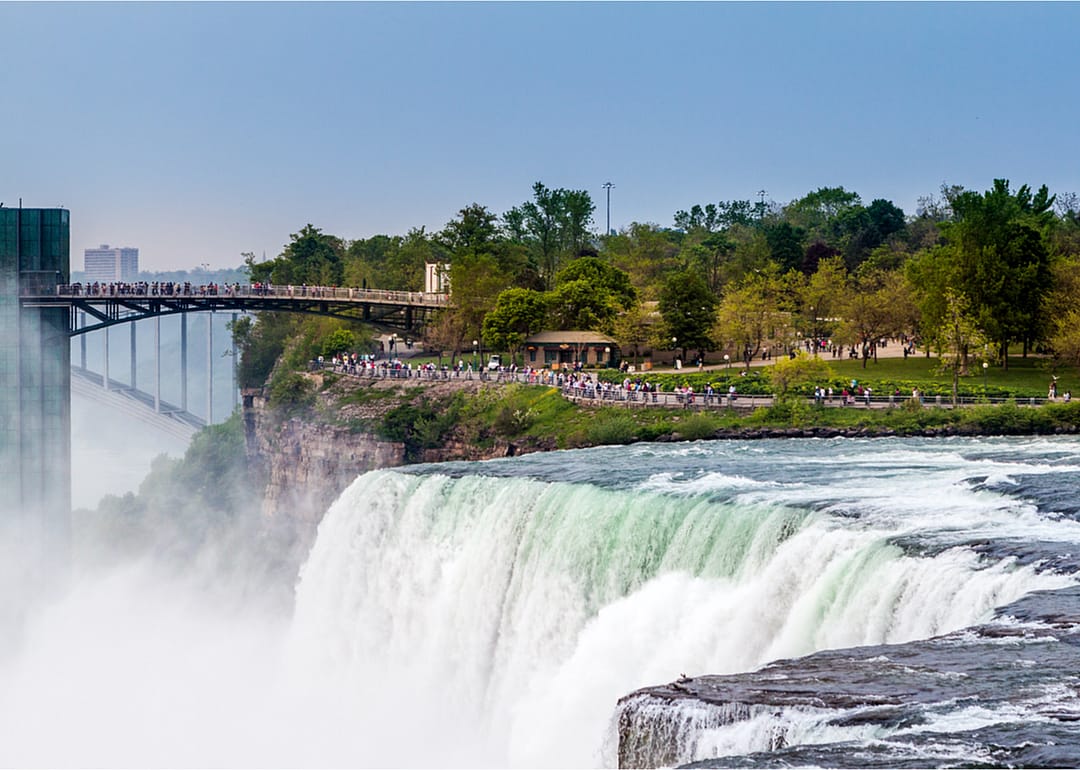
13 / 50#38. Niagara County
- Precipitation over the past year: 37.8 inches
- Comparison to 1901-2000 average: 5.5 inches above average (#17 rainiest September-August period since 1895)
- Comparison to state's precipitation over past year: 9.4 inches below statewide average
Wangkun Jia // Shutterstock
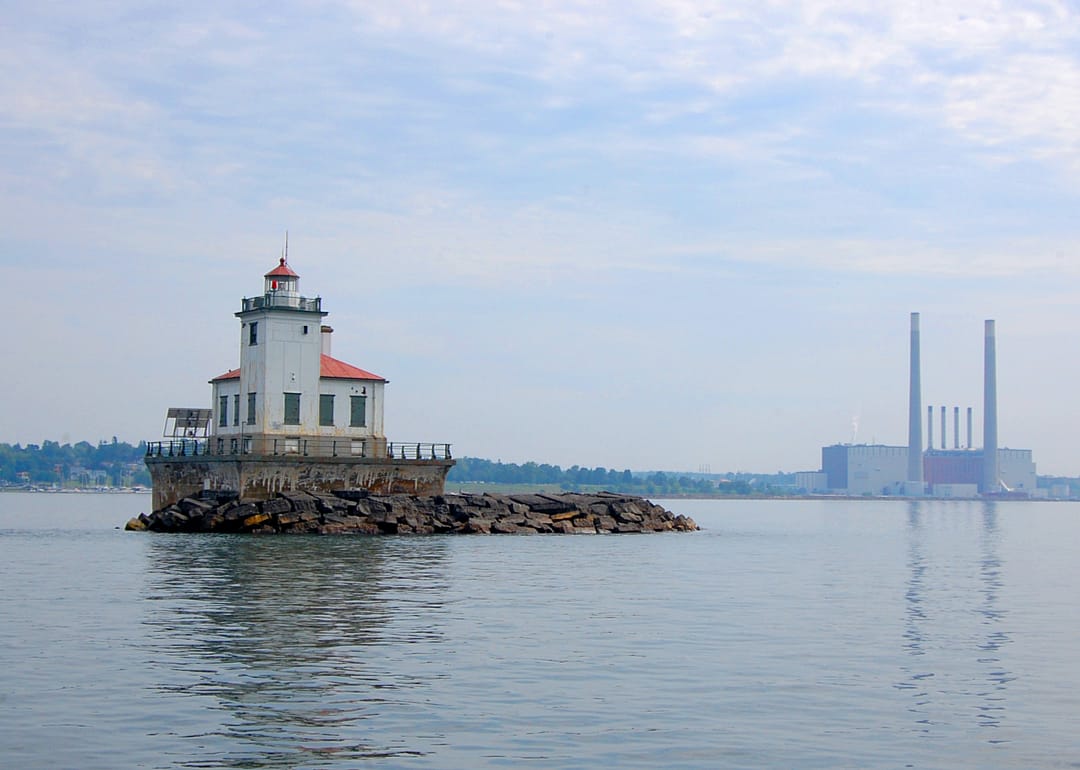
14 / 50#37. Oswego County
- Precipitation over the past year: 47.6 inches
- Comparison to 1901-2000 average: 5.5 inches above average (#28 rainiest September-August period since 1895)
- Comparison to state's precipitation over past year: 0.4 inches above statewide average
Stef Ko // Shutterstock
15 / 50#36. Cortland County
- Precipitation over the past year: 46.6 inches
- Comparison to 1901-2000 average: 5.5 inches above average (#24 rainiest September-August period since 1895)
- Comparison to state's precipitation over past year: 0.5 inches below statewide average
You may also like: Most expensive homes for sale in New York
Felix Lipov // Shutterstock
16 / 50#35. Greene County
- Precipitation over the past year: 48.4 inches
- Comparison to 1901-2000 average: 5.6 inches above average (#31 rainiest September-August period since 1895)
- Comparison to state's precipitation over past year: 1.2 inches above statewide average
#34. Schuyler County
- Precipitation over the past year: 39.4 inches
- Comparison to 1901-2000 average: 5.7 inches above average (#21 rainiest September-August period since 1895)
- Comparison to state's precipitation over past year: 7.7 inches below statewide average
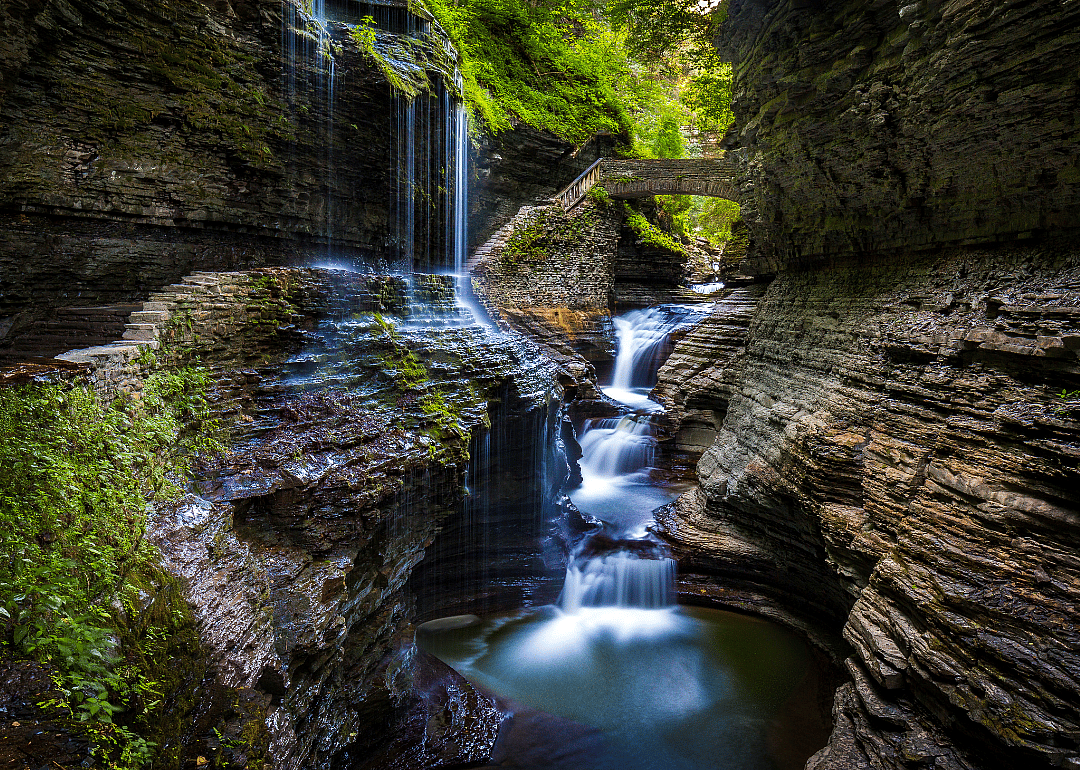
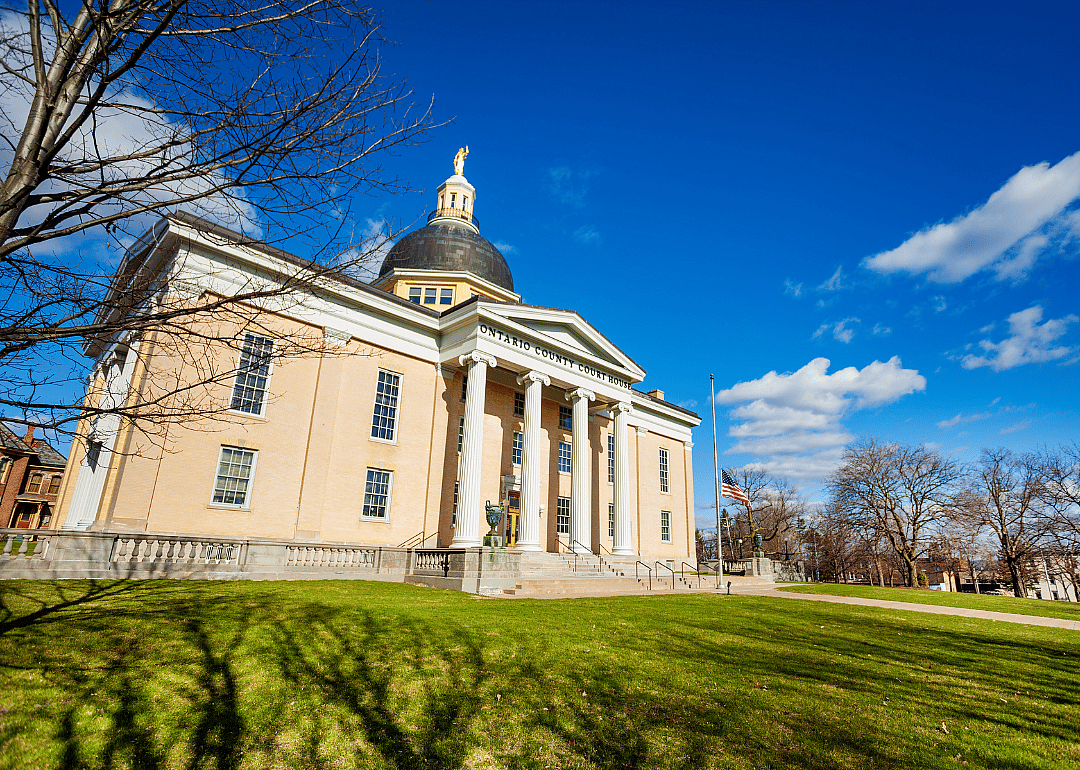
#33. Ontario County
- Precipitation over the past year: 38.3 inches
- Comparison to 1901-2000 average: 5.9 inches above average (#18 rainiest September-August period since 1895)
- Comparison to state's precipitation over past year: 8.9 inches below statewide average
#32. Chemung County
- Precipitation over the past year: 40.8 inches
- Comparison to 1901-2000 average: 6.2 inches above average (#20 rainiest September-August period since 1895)
- Comparison to state's precipitation over past year: 6.3 inches below statewide average
#31. Seneca County
- Precipitation over the past year: 39.6 inches
- Comparison to 1901-2000 average: 6.2 inches above average (#18 rainiest September-August period since 1895)
- Comparison to state's precipitation over past year: 7.6 inches below statewide average
You may also like: Cities with the most expensive homes in New York
Lewis Liu // Shutterstock
21 / 50#30. Tompkins County
- Precipitation over the past year: 43.2 inches
- Comparison to 1901-2000 average: 6.6 inches above average (#22 rainiest September-August period since 1895)
- Comparison to state's precipitation over past year: 3.9 inches below statewide average
Samantha Jo // Shutterstock
22 / 50#29. St. Lawrence County
- Precipitation over the past year: 45.2 inches
- Comparison to 1901-2000 average: 6.8 inches above average (#13 rainiest September-August period since 1895)
- Comparison to state's precipitation over past year: 1.9 inches below statewide average
#28. Washington County
- Precipitation over the past year: 44.7 inches
- Comparison to 1901-2000 average: 6.8 inches above average (#17 rainiest September-August period since 1895)
- Comparison to state's precipitation over past year: 2.4 inches below statewide average
PhotoItaliaStudio // Shutterstock
24 / 50#27. Saratoga County
- Precipitation over the past year: 47.9 inches
- Comparison to 1901-2000 average: 6.9 inches above average (#20 rainiest September-August period since 1895)
- Comparison to state's precipitation over past year: 0.7 inches above statewide average
Nina Alizada // Shutterstock
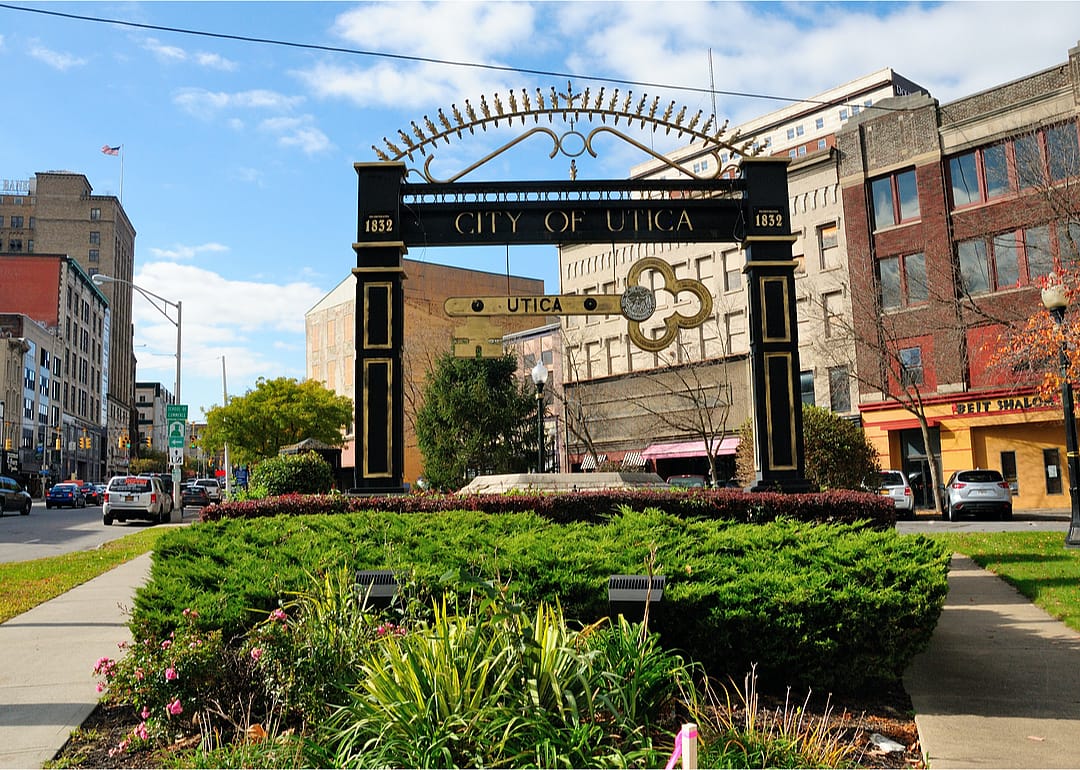
25 / 50#26. Oneida County
- Precipitation over the past year: 52.1 inches
- Comparison to 1901-2000 average: 7.0 inches above average (#18 rainiest September-August period since 1895)
- Comparison to state's precipitation over past year: 5.0 inches above statewide average
You may also like: Counties with the coldest winters in New York
#25. Cayuga County
- Precipitation over the past year: 44.0 inches
- Comparison to 1901-2000 average: 7.0 inches above average (#16 rainiest September-August period since 1895)
- Comparison to state's precipitation over past year: 3.1 inches below statewide average
littlenySTOCK // Shutterstock
27 / 50#24. Onondaga County
- Precipitation over the past year: 45.8 inches
- Comparison to 1901-2000 average: 7.4 inches above average (#15 rainiest September-August period since 1895)
- Comparison to state's precipitation over past year: 1.3 inches below statewide average
debra millet // Shutterstock
28 / 50#23. Madison County
- Precipitation over the past year: 47.8 inches
- Comparison to 1901-2000 average: 7.4 inches above average (#16 rainiest September-August period since 1895)
- Comparison to state's precipitation over past year: 0.7 inches above statewide average
#22. Erie County
- Precipitation over the past year: 45.7 inches
- Comparison to 1901-2000 average: 7.5 inches above average (#9 rainiest September-August period since 1895)
- Comparison to state's precipitation over past year: 1.4 inches below statewide average
WCohen // Shutterstock
30 / 50#21. Tioga County
- Precipitation over the past year: 44.5 inches
- Comparison to 1901-2000 average: 7.6 inches above average (#15 rainiest September-August period since 1895)
- Comparison to state's precipitation over past year: 2.6 inches below statewide average
You may also like: Richest billionaires in New York
North woodsman // Shutterstock
31 / 50#20. Lewis County
- Precipitation over the past year: 53.1 inches
- Comparison to 1901-2000 average: 7.8 inches above average (#15 rainiest September-August period since 1895)
- Comparison to state's precipitation over past year: 6.0 inches above statewide average
#19. Montgomery County
- Precipitation over the past year: 46.3 inches
- Comparison to 1901-2000 average: 7.8 inches above average (#14 rainiest September-August period since 1895)
- Comparison to state's precipitation over past year: 0.8 inches below statewide average
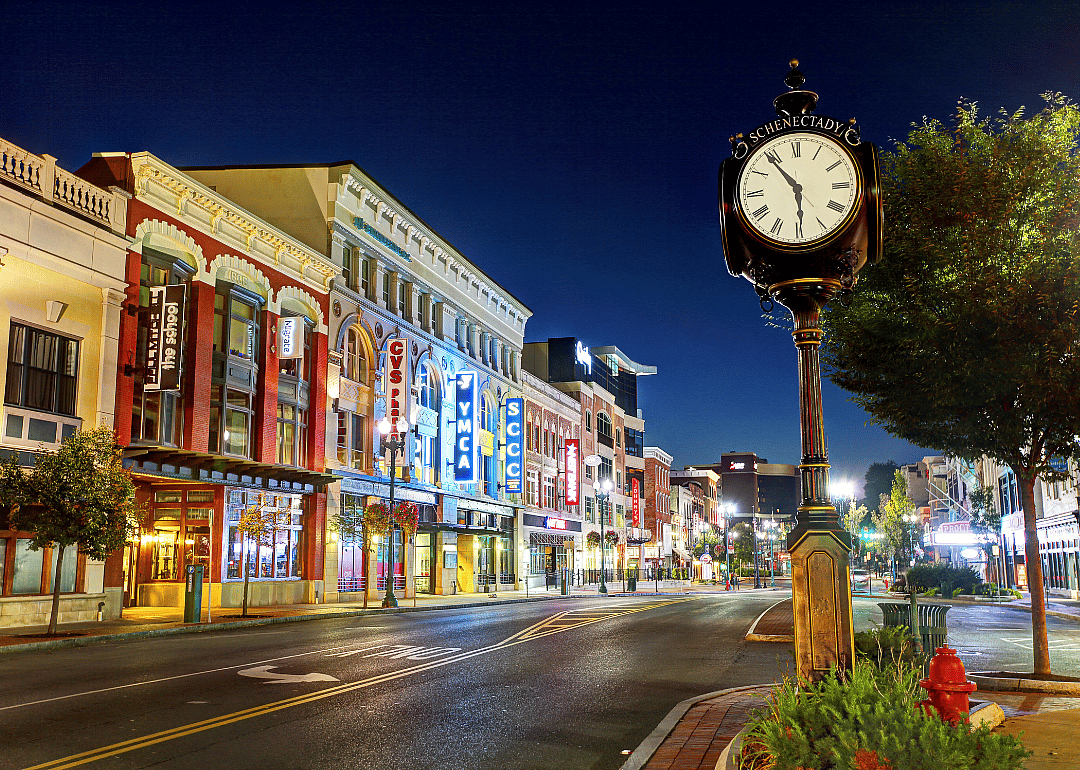
#18. Schenectady County
- Precipitation over the past year: 45.0 inches
- Comparison to 1901-2000 average: 7.9 inches above average (#12 rainiest September-August period since 1895)
- Comparison to state's precipitation over past year: 2.2 inches below statewide average
Kenneth Sponsler // Shutterstock
34 / 50#17. Otsego County
- Precipitation over the past year: 49.3 inches
- Comparison to 1901-2000 average: 7.9 inches above average (#16 rainiest September-August period since 1895)
- Comparison to state's precipitation over past year: 2.1 inches above statewide average
#16. Ulster County
- Precipitation over the past year: 55.2 inches
- Comparison to 1901-2000 average: 7.9 inches above average (#19 rainiest September-August period since 1895)
- Comparison to state's precipitation over past year: 8.0 inches above statewide average
You may also like: Hottest Octobers in New York since 1895
#15. Rensselaer County
- Precipitation over the past year: 47.3 inches
- Comparison to 1901-2000 average: 8.0 inches above average (#18 rainiest September-August period since 1895)
- Comparison to state's precipitation over past year: 0.1 inches above statewide average
Sue Smith // Shutterstock
37 / 50#14. Fulton County
- Precipitation over the past year: 53.9 inches
- Comparison to 1901-2000 average: 8.3 inches above average (#14 rainiest September-August period since 1895)
- Comparison to state's precipitation over past year: 6.7 inches above statewide average
Wangkun Jia // Shutterstock
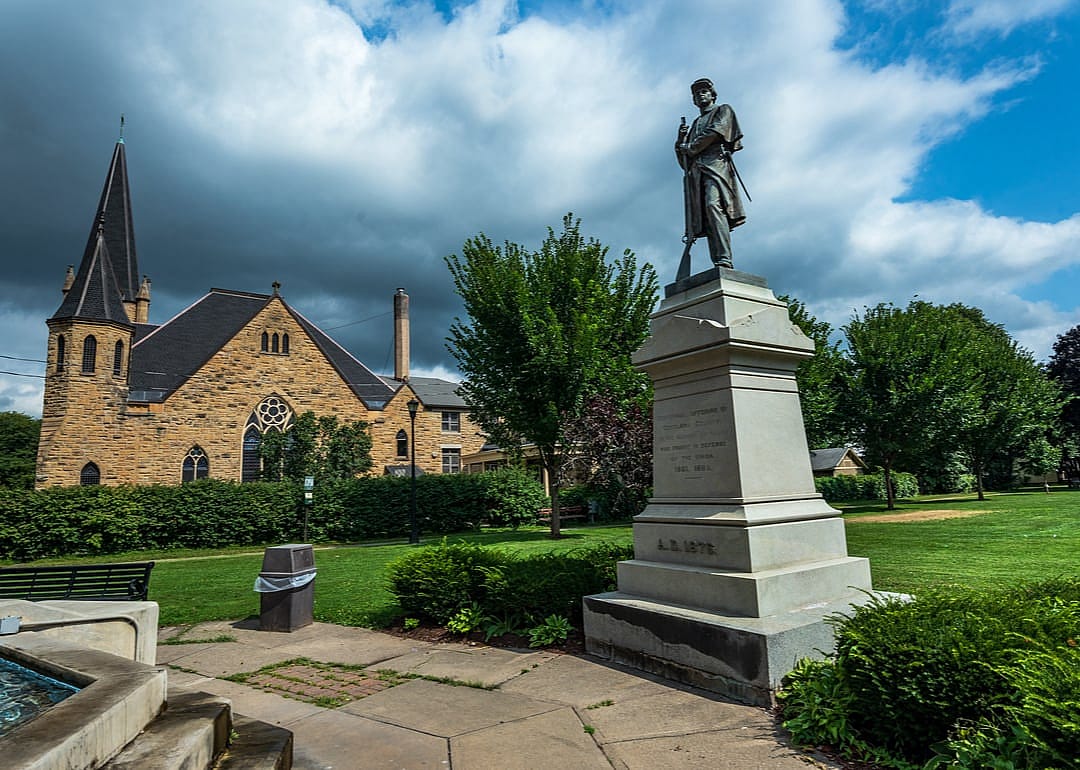
38 / 50#13. Albany County
- Precipitation over the past year: 45.6 inches
- Comparison to 1901-2000 average: 8.3 inches above average (#13 rainiest September-August period since 1895)
- Comparison to state's precipitation over past year: 1.6 inches below statewide average
Sean McDonald // Shutterstock
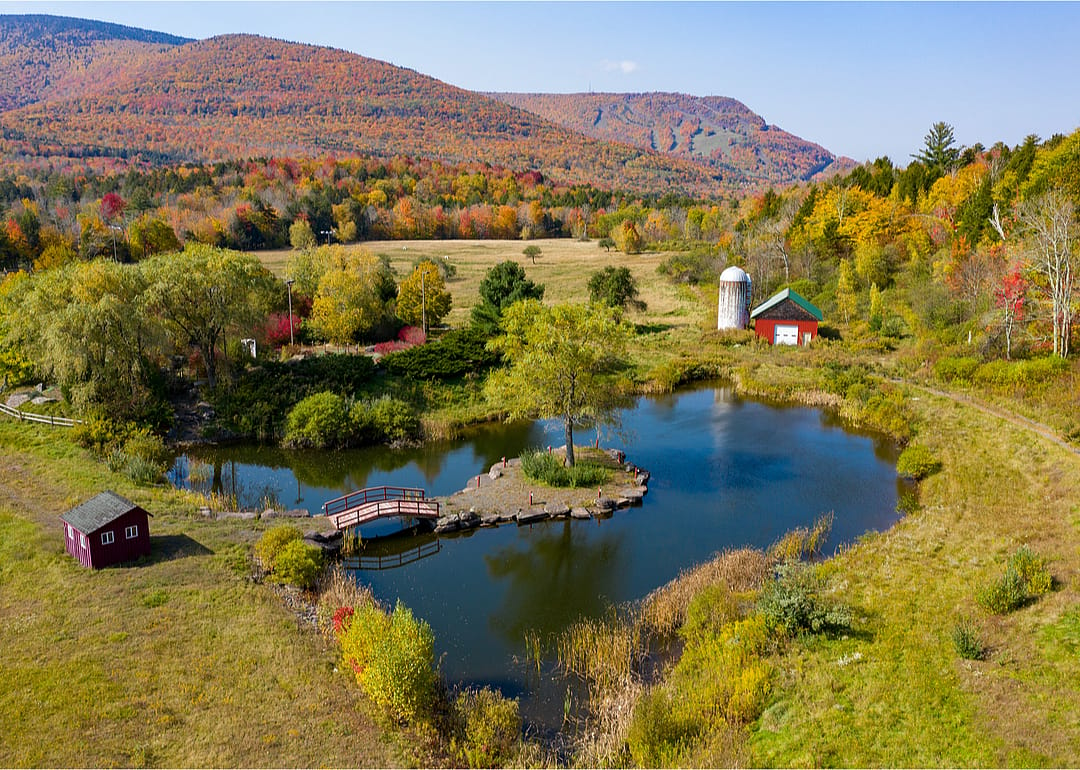
39 / 50#12. Chenango County
- Precipitation over the past year: 49.5 inches
- Comparison to 1901-2000 average: 8.4 inches above average (#16 rainiest September-August period since 1895)
- Comparison to state's precipitation over past year: 2.3 inches above statewide average
fandangle // Shutterstock
40 / 50#11. Herkimer County
- Precipitation over the past year: 55.7 inches
- Comparison to 1901-2000 average: 8.9 inches above average (#9 rainiest September-August period since 1895)
- Comparison to state's precipitation over past year: 8.6 inches above statewide average
You may also like: Highest-rated Class of 2025 football recruits from New York
#10. Orange County
- Precipitation over the past year: 52.9 inches
- Comparison to 1901-2000 average: 9.3 inches above average (#17 rainiest September-August period since 1895)
- Comparison to state's precipitation over past year: 5.8 inches above statewide average
#9. Warren County
- Precipitation over the past year: 51.5 inches
- Comparison to 1901-2000 average: 9.5 inches above average (#10 rainiest September-August period since 1895)
- Comparison to state's precipitation over past year: 4.3 inches above statewide average
Wangkun Jia // Shutterstock
43 / 50#8. Jefferson County
- Precipitation over the past year: 48.3 inches
- Comparison to 1901-2000 average: 9.5 inches above average (#8 rainiest September-August period since 1895)
- Comparison to state's precipitation over past year: 1.2 inches above statewide average
Richard Cavalleri // Shutterstock
44 / 50#7. Clinton County
- Precipitation over the past year: 44.4 inches
- Comparison to 1901-2000 average: 10.0 inches above average (#7 rainiest September-August period since 1895)
- Comparison to state's precipitation over past year: 2.7 inches below statewide average
#6. Columbia County
- Precipitation over the past year: 50.5 inches
- Comparison to 1901-2000 average: 10.0 inches above average (#12 rainiest September-August period since 1895)
- Comparison to state's precipitation over past year: 3.3 inches above statewide average
You may also like: Highest-earning counties in New York
#5. Broome County
- Precipitation over the past year: 49.0 inches
- Comparison to 1901-2000 average: 10.1 inches above average (#12 rainiest September-August period since 1895)
- Comparison to state's precipitation over past year: 1.9 inches above statewide average
#4. Sullivan County
- Precipitation over the past year: 55.9 inches
- Comparison to 1901-2000 average: 10.3 inches above average (#13 rainiest September-August period since 1895)
- Comparison to state's precipitation over past year: 8.8 inches above statewide average
#3. Franklin County
- Precipitation over the past year: 50.3 inches
- Comparison to 1901-2000 average: 11.3 inches above average (#5 rainiest September-August period since 1895)
- Comparison to state's precipitation over past year: 3.2 inches above statewide average
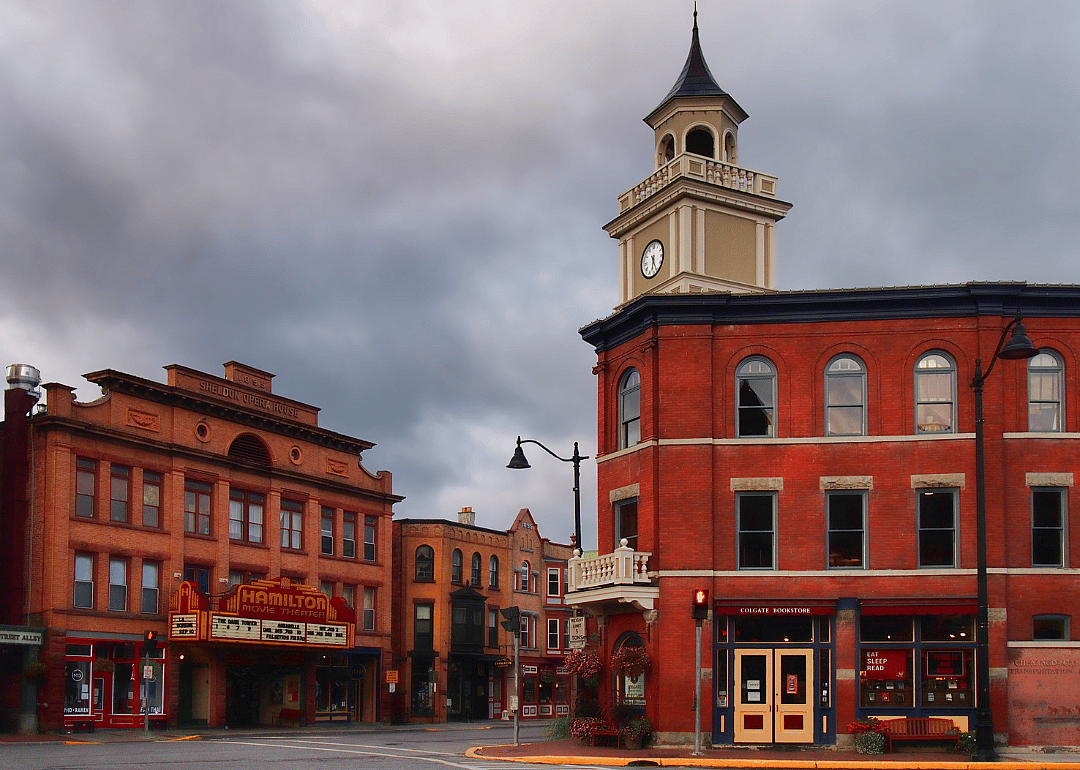
#2. Hamilton County
- Precipitation over the past year: 59.1 inches
- Comparison to 1901-2000 average: 12.2 inches above average (#5 rainiest September-August period since 1895)
- Comparison to state's precipitation over past year: 11.9 inches above statewide average
tomtsya// Shutterstock
50 / 50#1. Essex County
- Precipitation over the past year: 55.7 inches
- Comparison to 1901-2000 average: 14.8 inches above average (#3 rainiest September-August period since 1895)
- Comparison to state's precipitation over past year: 8.6 inches above statewide average
This story features data reporting and writing by Emma Rubin, and is part of a series utilizing data automation across 44 states.
You may also like: Highest-rated specialty museums in New York by visitors