Drew Angerer // Getty Images
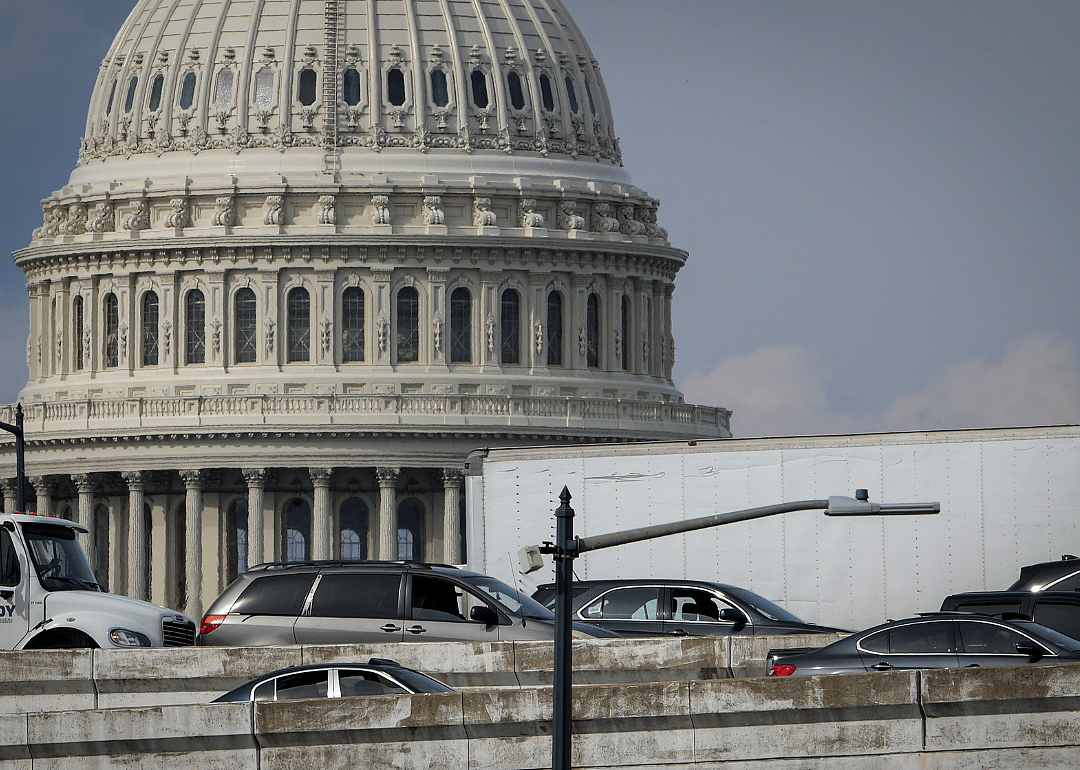
1 / 51#51. Washington DC
Annual vehicle-miles driven: 3.25 billion
---Per capita: 4,843.7

If a symbol of the American lifestyle exists, it might very well be the car. So perhaps it's not surprising that, according to the Federal Highway Administration, the average American drives an average of 14,000 miles per year or just under 1,200 miles a month. That's enough for a round-trip drive from Miami to Seattle twice—with a few hundred miles left over.
Another way to measure driving is with vehicle miles traveled per capita, the sum of annual miles traveled by vehicles divided by the state's total population. Collectively, Americans drive roughly 3.2 trillion miles every year—which measures out to 9,780 miles per capita.
But people in different states drive different amounts. Population density and the cost of gas are among the factors influencing driving habits. CheapInsurance.com used data from the Federal Highway Administration and the Census Bureau to find out which state's residents do the most driving. The data are ranked by the average number of vehicle-miles driven in each state, by capita. Driving data are from September 20211 through August 2023, and population data are from 2022.
Southern and Western states lead the rankings of where drivers spend more time behind the wheel. The top five states are more rural and have lower population densities than others, meaning they may have longer distances to travel for work or regular errands. It's also likely they have less access to public transportation.
At the other end of the list, the five states with the lowest miles driven per capita are in the Northeast and along the Pacific coast. Some of them are home to cities with the best public transportation systems in the country.
Drew Angerer // Getty Images
1 / 51Annual vehicle-miles driven: 3.25 billion
---Per capita: 4,843.7

Canva
2 / 51Annual vehicle-miles driven: 112.65 billion
---Per capita: 5,724.9
Canva
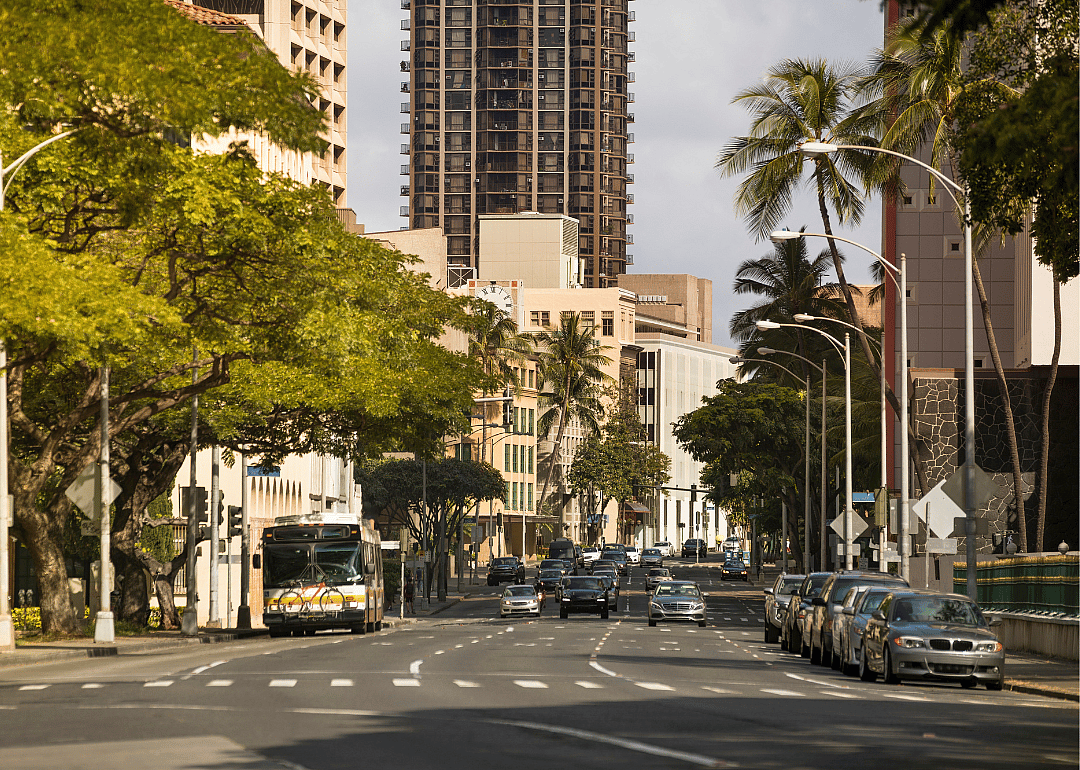
3 / 51Annual vehicle-miles driven: 10.48 billion
---Per capita: 7,278.2

Canva
4 / 51Annual vehicle-miles driven: 8.10 billion
---Per capita: 7,407.7

Canva
5 / 51Annual vehicle-miles driven: 59.18 billion
---Per capita: 7,600.6

Canva
6 / 51Annual vehicle-miles driven: 5.80 billion
---Per capita: 7,902.3

Canva
7 / 51Annual vehicle-miles driven: 103.89 billion
---Per capita: 8,008.7
Canva
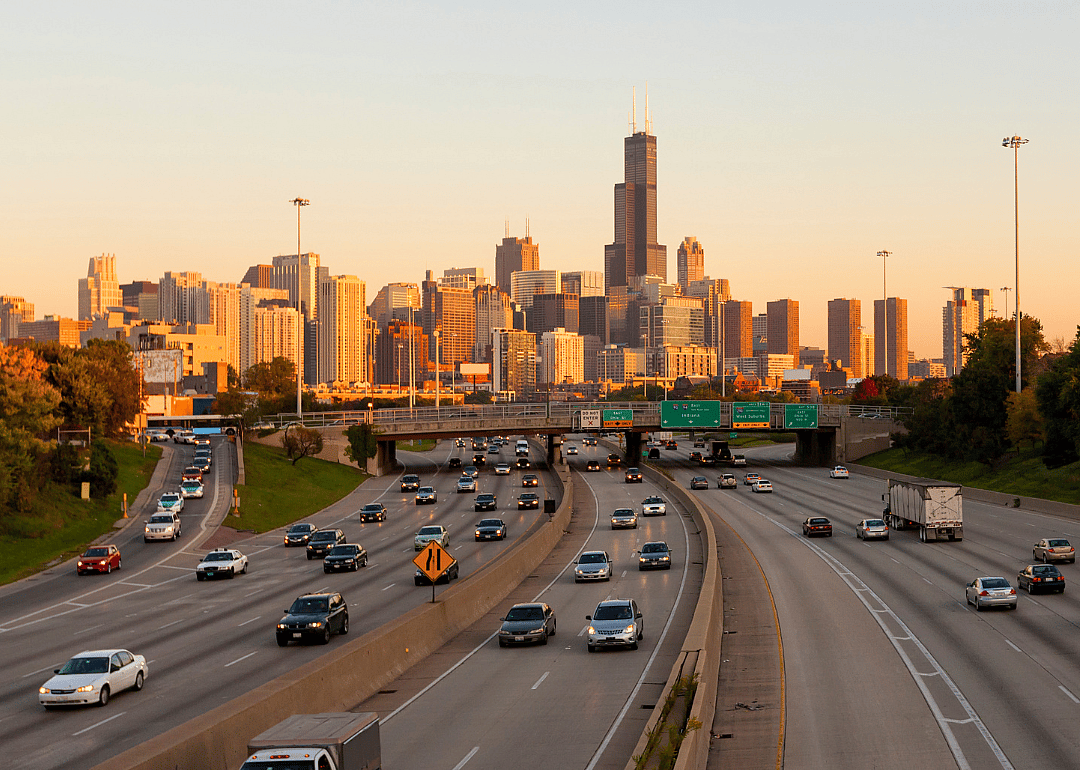
8 / 51Annual vehicle-miles driven: 101.66 billion
---Per capita: 8,079.8

Canva
9 / 51Annual vehicle-miles driven: 319.63 billion
---Per capita: 8,189.5

Canva
10 / 51Annual vehicle-miles driven: 30.40 billion
---Per capita: 8,383.7

Canva
11 / 51Annual vehicle-miles driven: 78.62 billion
---Per capita: 8,488.2

Canva
12 / 51Annual vehicle-miles driven: 36.49 billion
---Per capita: 8,606.8

Canva
13 / 51Annual vehicle-miles driven: 27.54 billion
---Per capita: 8,666.1

Canva
14 / 51Annual vehicle-miles driven: 62.12 billion
---Per capita: 8,897.6

Canva
15 / 51Annual vehicle-miles driven: 16.35 billion
---Per capita: 9,211.6
Canva
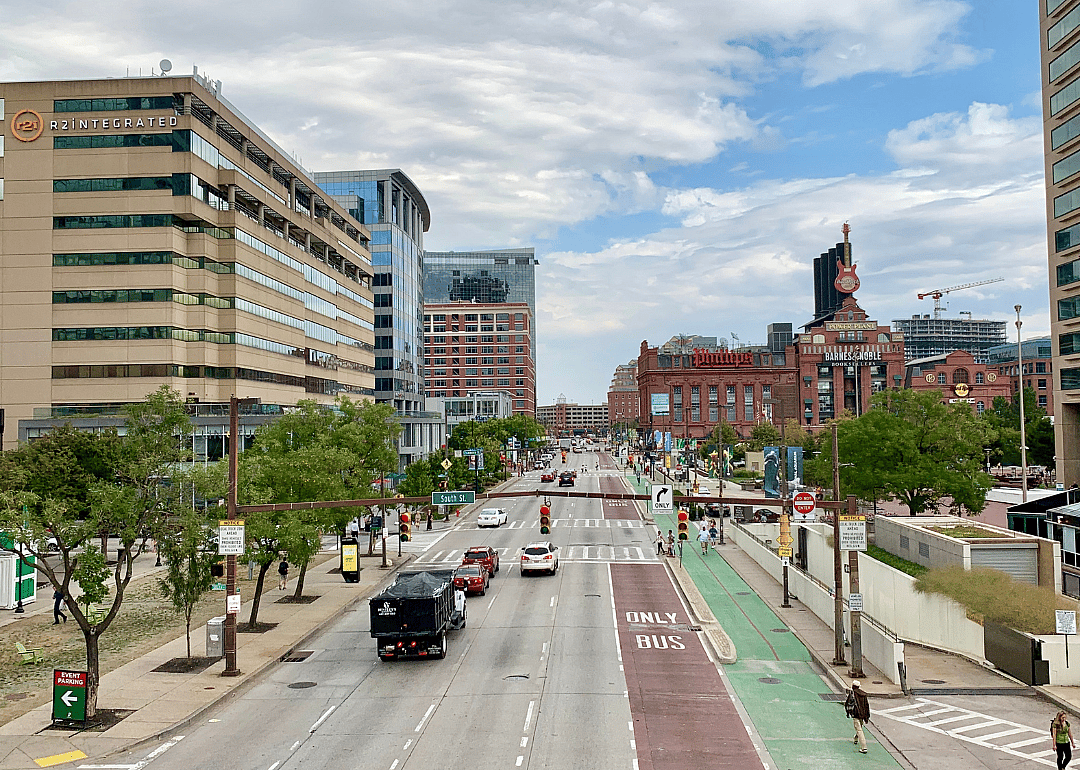
16 / 51Annual vehicle-miles driven: 57.68 billion
---Per capita: 9,355.9

Canva
17 / 51Annual vehicle-miles driven: 54.67 billion
---Per capita: 9,361.6
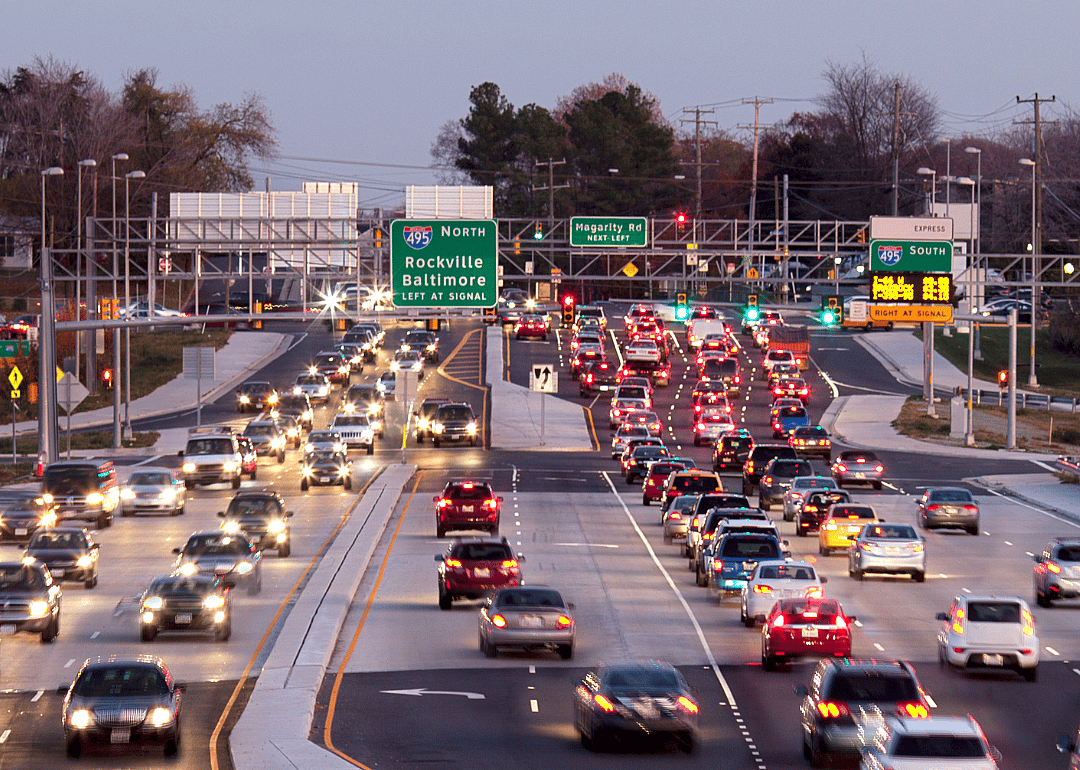
Canva
18 / 51Annual vehicle-miles driven: 83.20 billion
---Per capita: 9,580.9

Canva
19 / 51Annual vehicle-miles driven: 113.94 billion
---Per capita: 9,692.2

Canva
20 / 51Annual vehicle-miles driven: 13.61 billion
---Per capita: 9,753.9

Canva
21 / 51Annual vehicle-miles driven: 10.02 billion
---Per capita: 9,839.0

Canva
22 / 51Annual vehicle-miles driven: 99.17 billion
---Per capita: 9,883.6

Canva
23 / 51Annual vehicle-miles driven: 299.85 billion
---Per capita: 9,985.0
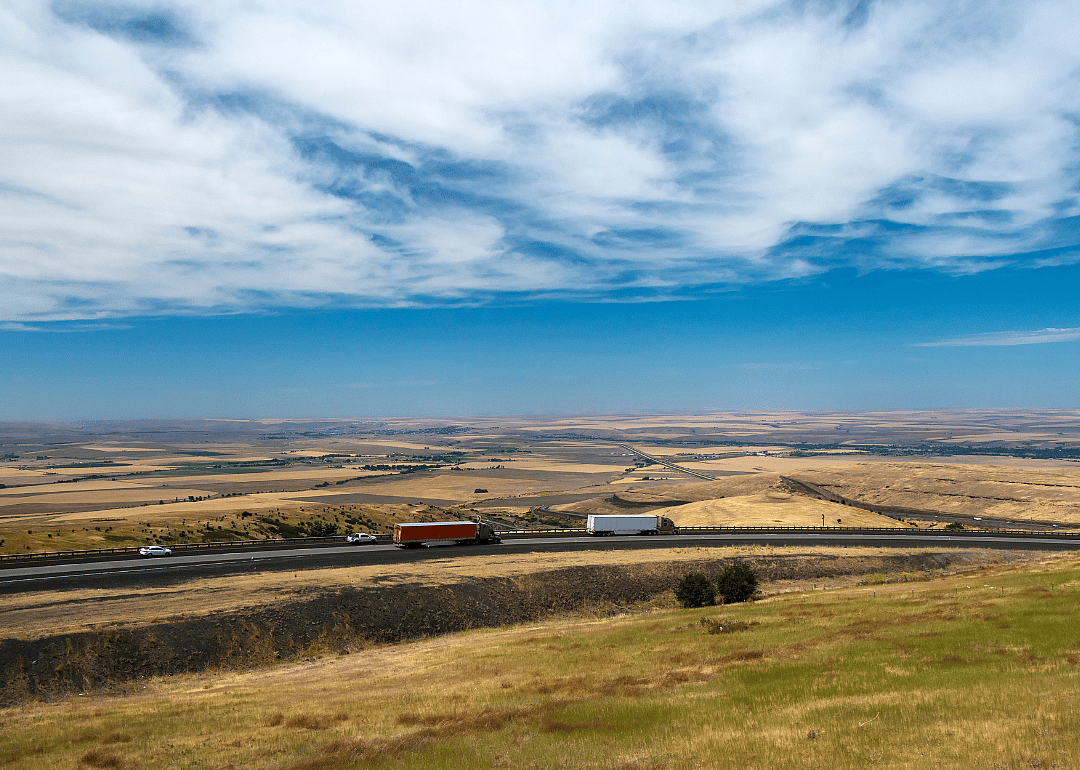
Canva
24 / 51Annual vehicle-miles driven: 19.47 billion
---Per capita: 10,043.2

Canva
25 / 51Annual vehicle-miles driven: 57.78 billion
---Per capita: 10,106.9
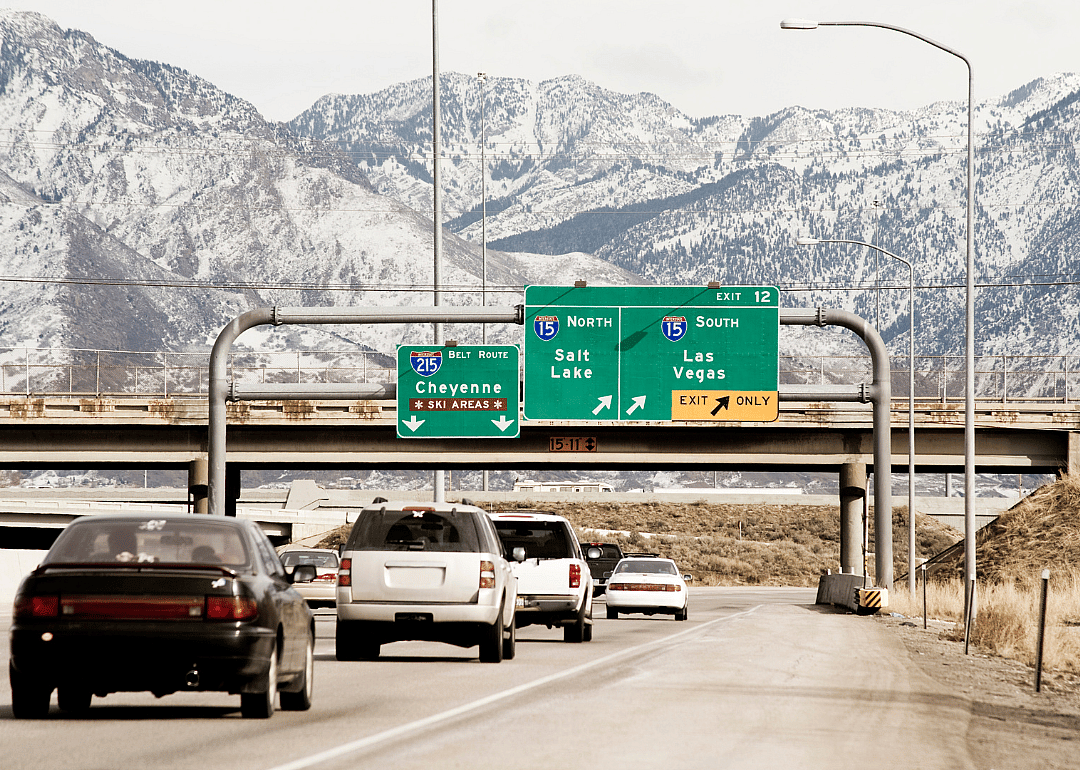
Canva
26 / 51Annual vehicle-miles driven: 34.35 billion
---Per capita: 10,161.5

Canva
27 / 51Annual vehicle-miles driven: 33.15 billion
---Per capita: 10,356.1
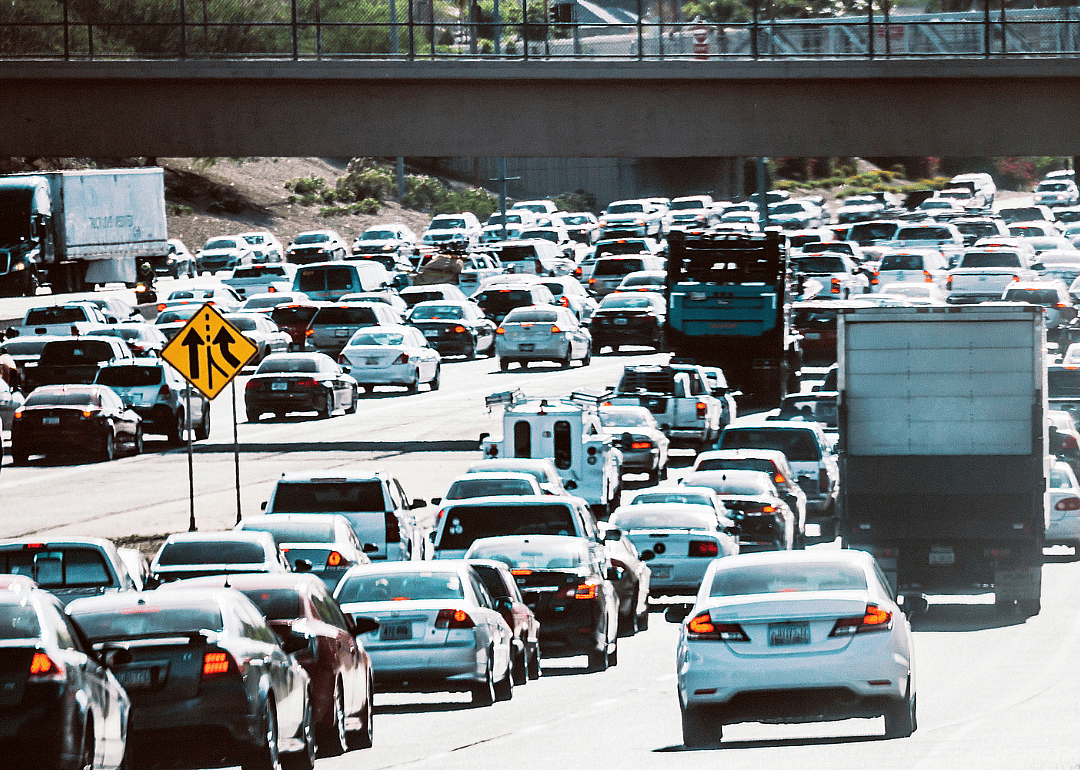
Canva
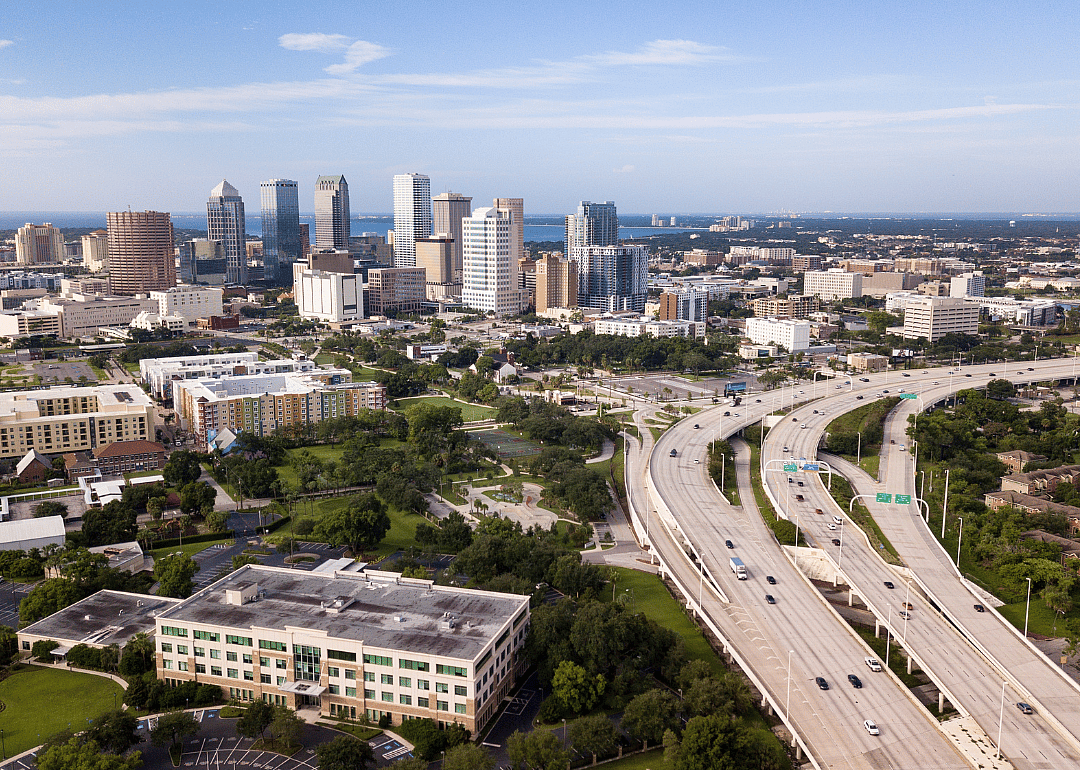
28 / 51Annual vehicle-miles driven: 77.38 billion
---Per capita: 10,514.5
Canva
29 / 51Annual vehicle-miles driven: 234.29 billion
---Per capita: 10,532.4

Canva
30 / 51Annual vehicle-miles driven: 20.86 billion
---Per capita: 10,598.5

Canva
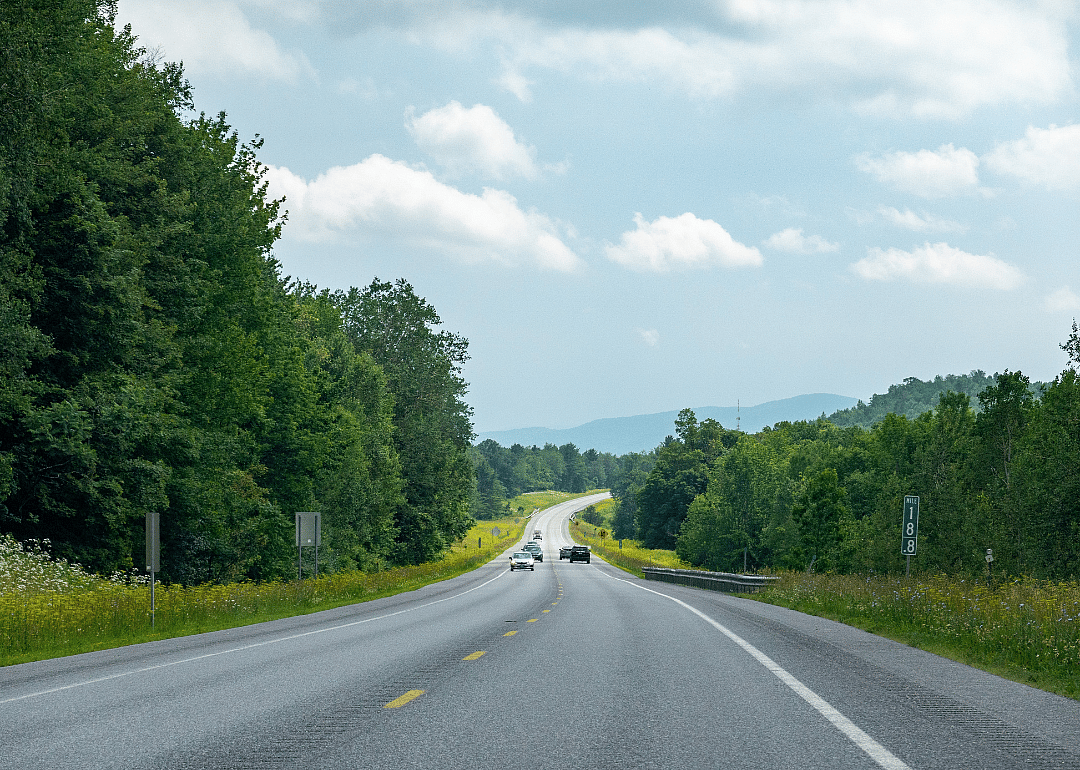
31 / 51Annual vehicle-miles driven: 9.75 billion
---Per capita: 10,718.6
Canva
32 / 51Annual vehicle-miles driven: 6.97 billion
---Per capita: 10,774.8

Canva
33 / 51Annual vehicle-miles driven: 14.93 billion
---Per capita: 10,780.0

Canva
34 / 51Annual vehicle-miles driven: 31.67 billion
---Per capita: 10,782.2

Canva
35 / 51Annual vehicle-miles driven: 50.26 billion
---Per capita: 11,138.4

Canva
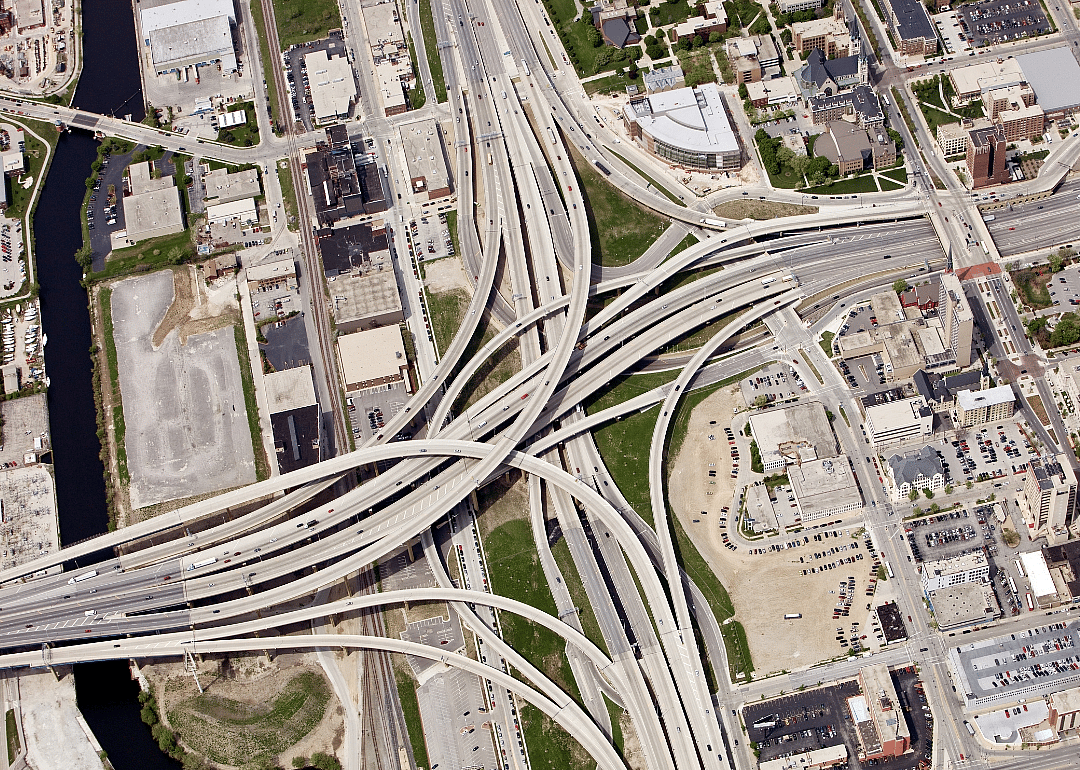
36 / 51Annual vehicle-miles driven: 119.59 billion
---Per capita: 11,178.1
Canva
37 / 51Annual vehicle-miles driven: 65.88 billion
---Per capita: 11,179.9

Canva
38 / 51Annual vehicle-miles driven: 45.20 billion
---Per capita: 11,243.3

Canva
39 / 51Annual vehicle-miles driven: 60.26 billion
---Per capita: 11,407.8

Canva
40 / 51Annual vehicle-miles driven: 125.48 billion
---Per capita: 11,498.3

Canva
41 / 51Annual vehicle-miles driven: 80.70 billion
---Per capita: 11,810.9

Canva
42 / 51Annual vehicle-miles driven: 9.33 billion
---Per capita: 11,978.0

Canva
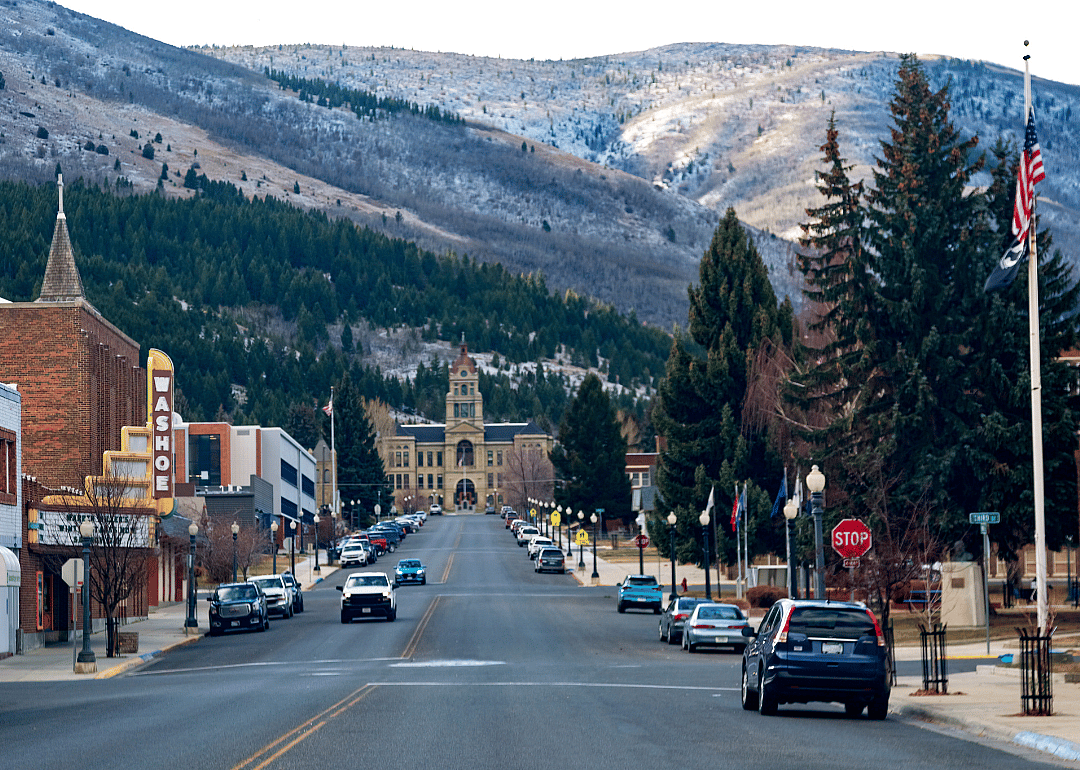
43 / 51Annual vehicle-miles driven: 84.72 billion
---Per capita: 12,014.5
Canva
44 / 51Annual vehicle-miles driven: 13.53 billion
---Per capita: 12,045.1
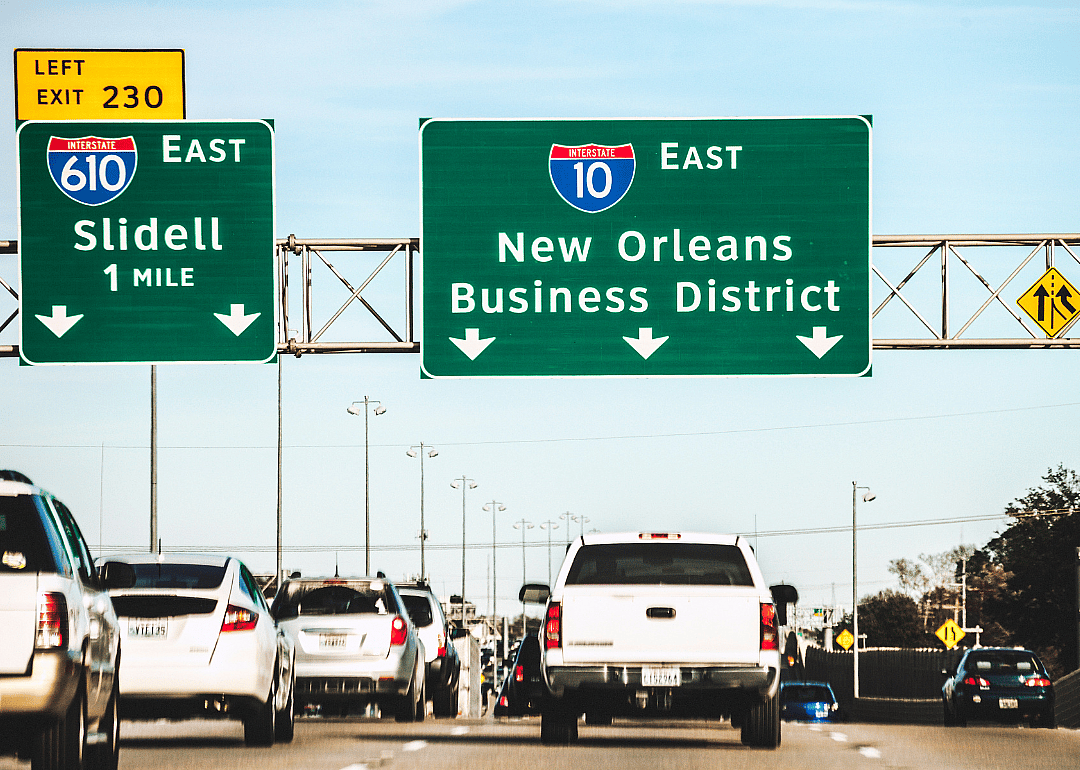
Canva
45 / 51Annual vehicle-miles driven: 55.33 billion
---Per capita: 12,054.7
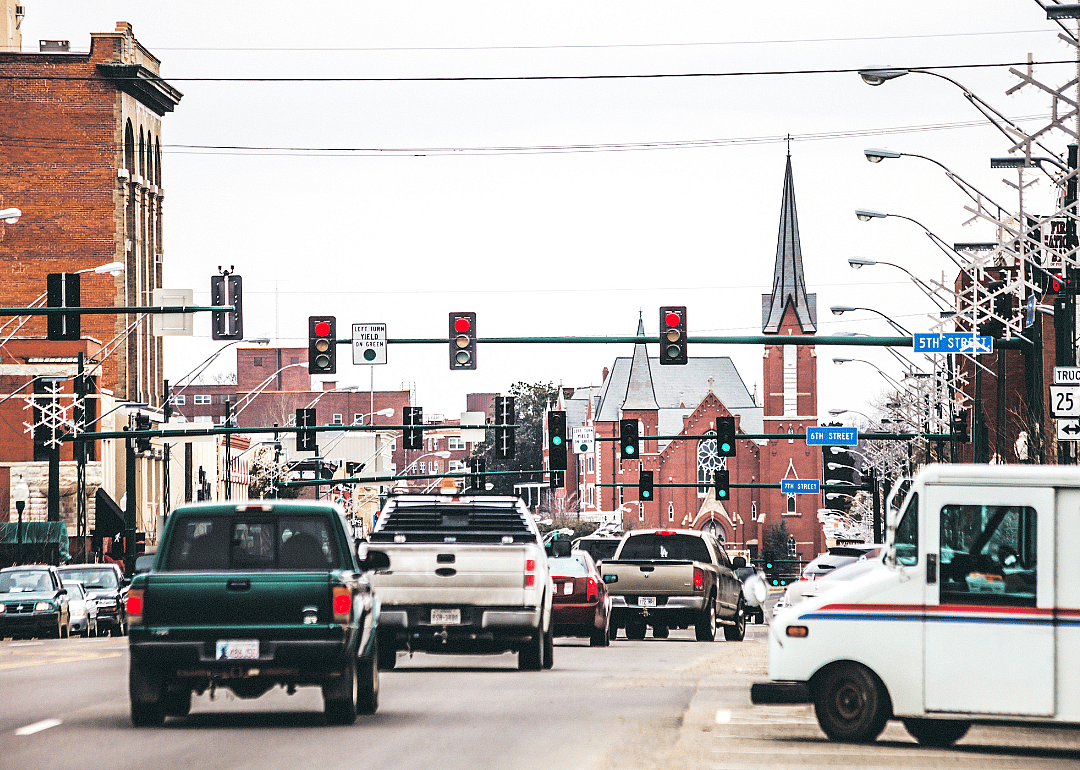
Canva
46 / 51Annual vehicle-miles driven: 38.25 billion
---Per capita: 12,560.3
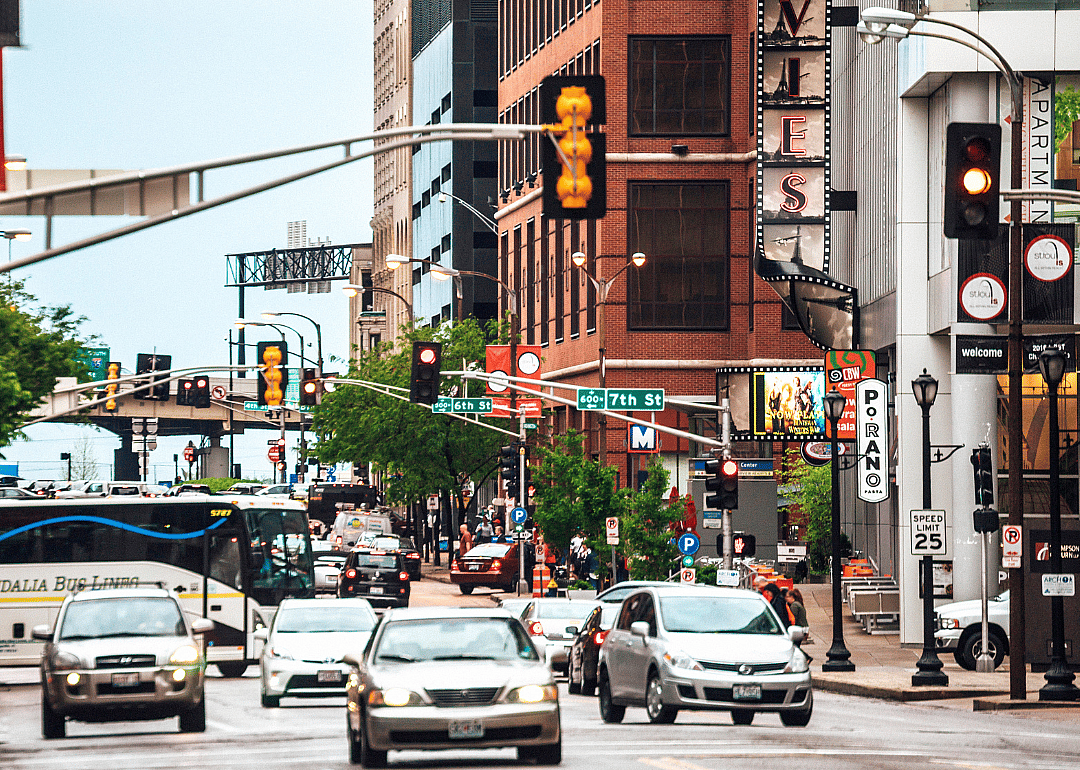
Canva
47 / 51Annual vehicle-miles driven: 80.59 billion
---Per capita: 13,045.1
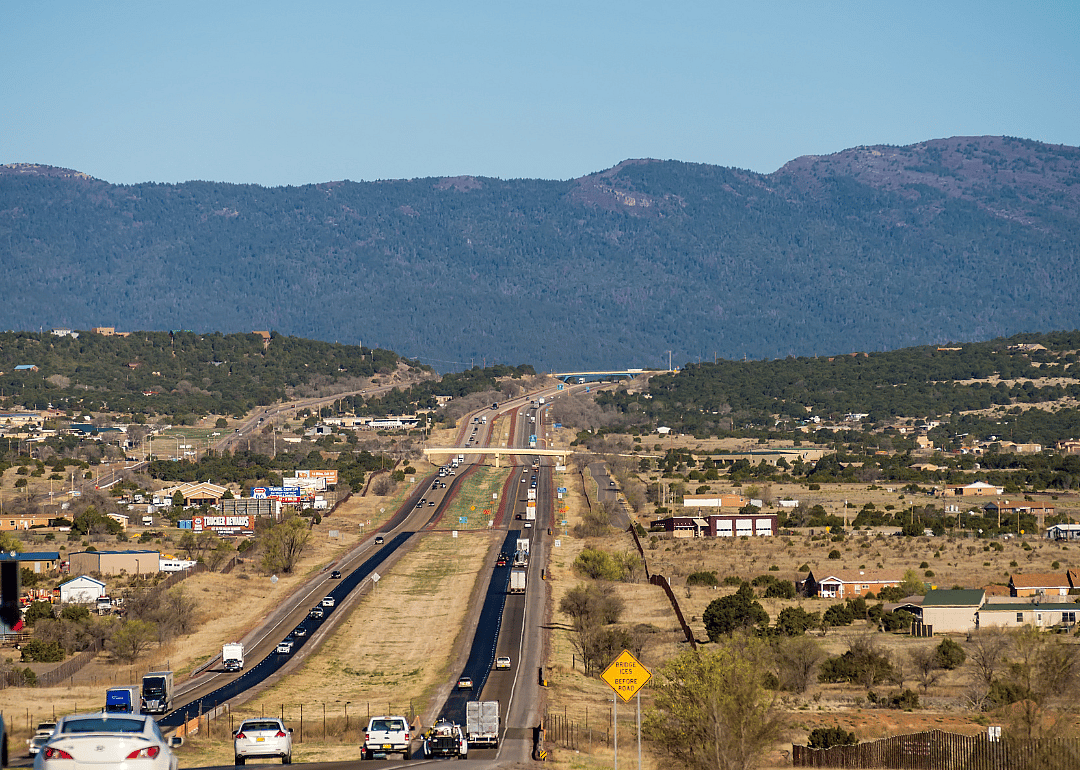
Canva
48 / 51Annual vehicle-miles driven: 27.62 billion
---Per capita: 13,068.4
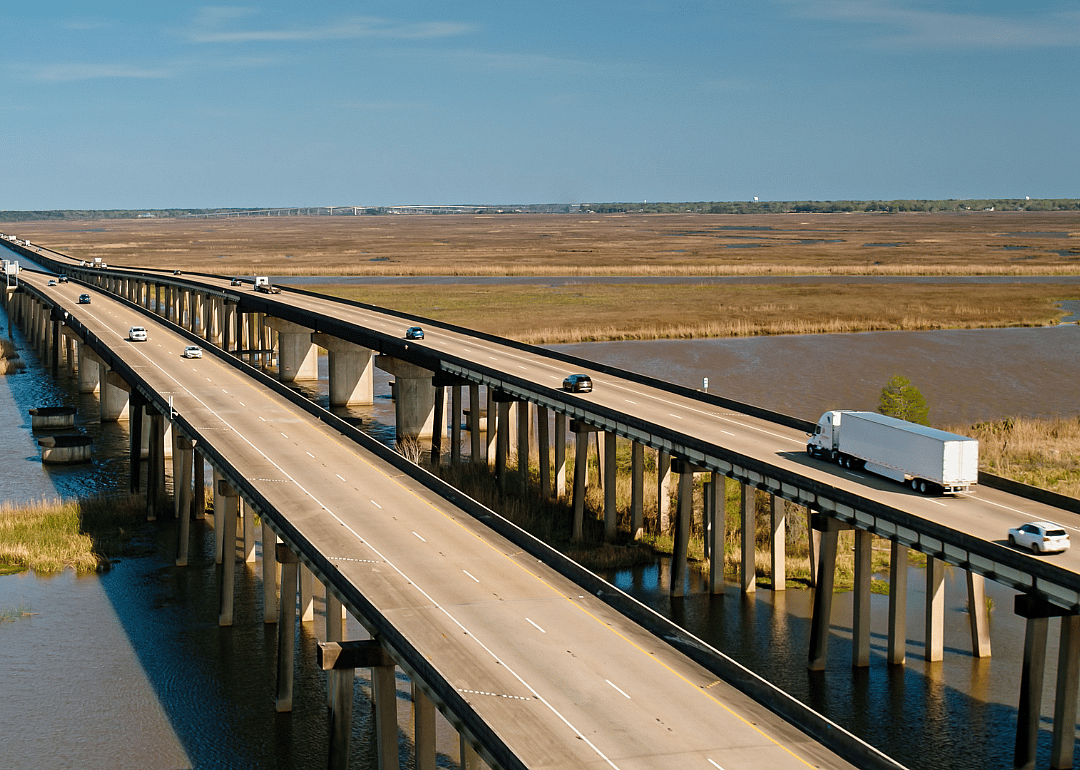
Canva
49 / 51Annual vehicle-miles driven: 40.49 billion
---Per capita: 13,771.5

Canva
50 / 51Annual vehicle-miles driven: 77.64 billion
---Per capita: 15,300.3
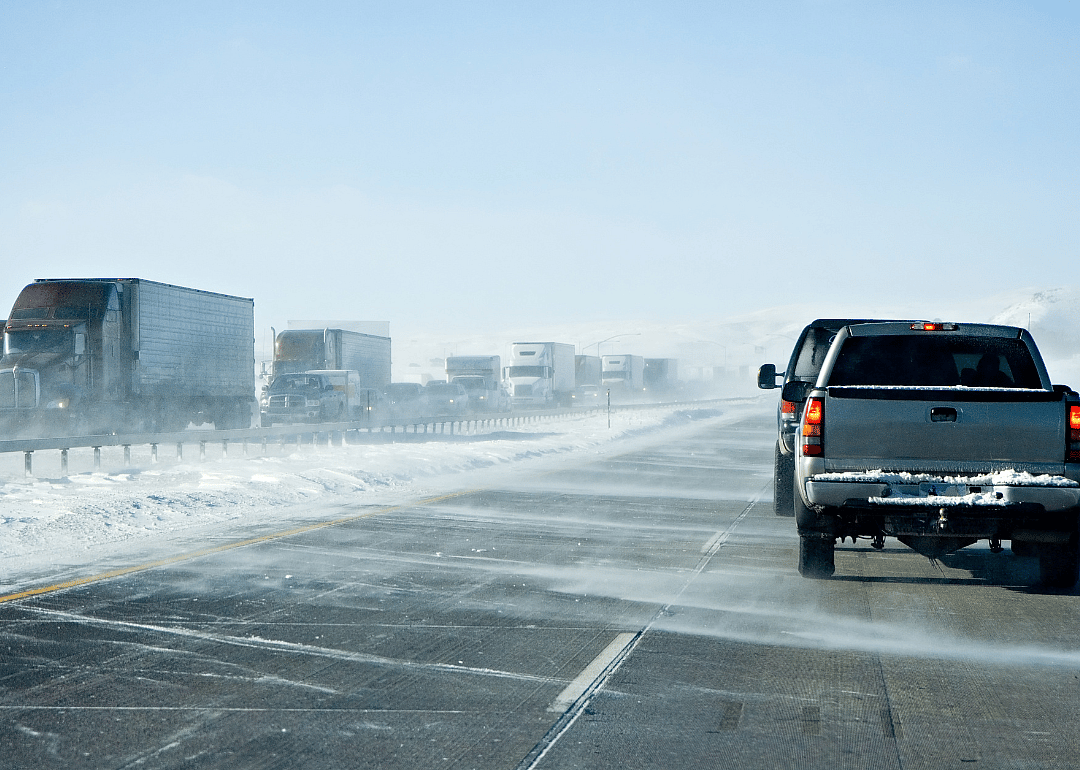
Canva
51 / 51Annual vehicle-miles driven: 10.69 billion
---Per capita: 18,378.7
Story editing by Jeff Inglis. Copy editing by Kristen Wegrzyn. Photo selection by Ania Antecka.