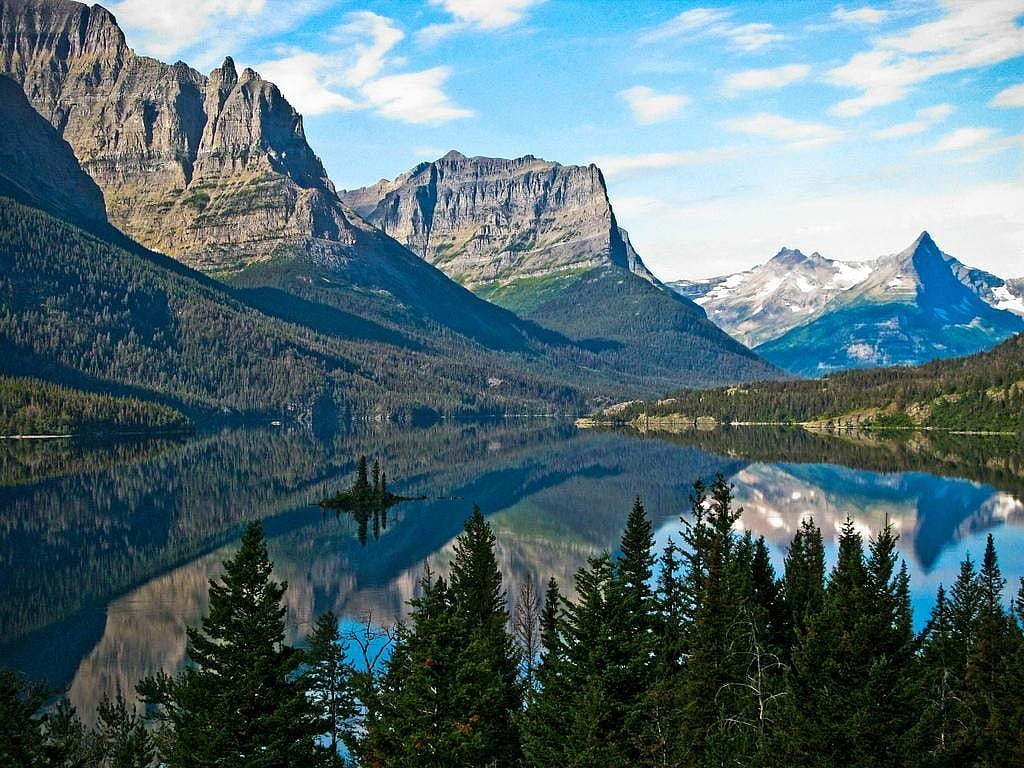
Dave Sizer // Flickr
1 / 50Montana
Migrations from Montana in 2016: 139
Migrations from Montana in 2006: 49 (#50 among all states)
Change in migrations 2006-2016: up 183.7%

Each year, an average of about 35.5 million Americans pack up and switch homes. While most people who move stay in the same counties they lived in the year prior, there are still roughly 6 million people who decide to cross state lines for their next place of residence. According to statistics from Forbes, the top states that are seeing more people moving in than out include Idaho, Oregon, and Nevada.
To get a sense of which states migrate most heavily to North Carolina, Stacker analyzed 2006 and 2016 state-to-state migration flow statistics from the U.S. Census Bureau. The data is taken from the American Community Survey conducted for both years and shows estimated migration flows all over the United States.
Whether it's to find a better house or apartment, transfer closer to a new job, or to start a family, Americans have several reasons to change their surrounding environments. Read on to find out who will be likely to join your neighborhood soon.
RELATED: Where people in every state are moving to
You may also like: What salary do I need to afford a house in Charlotte in 2026?
Dave Sizer // Flickr
1 / 50Migrations from Montana in 2016: 139
Migrations from Montana in 2006: 49 (#50 among all states)
Change in migrations 2006-2016: up 183.7%
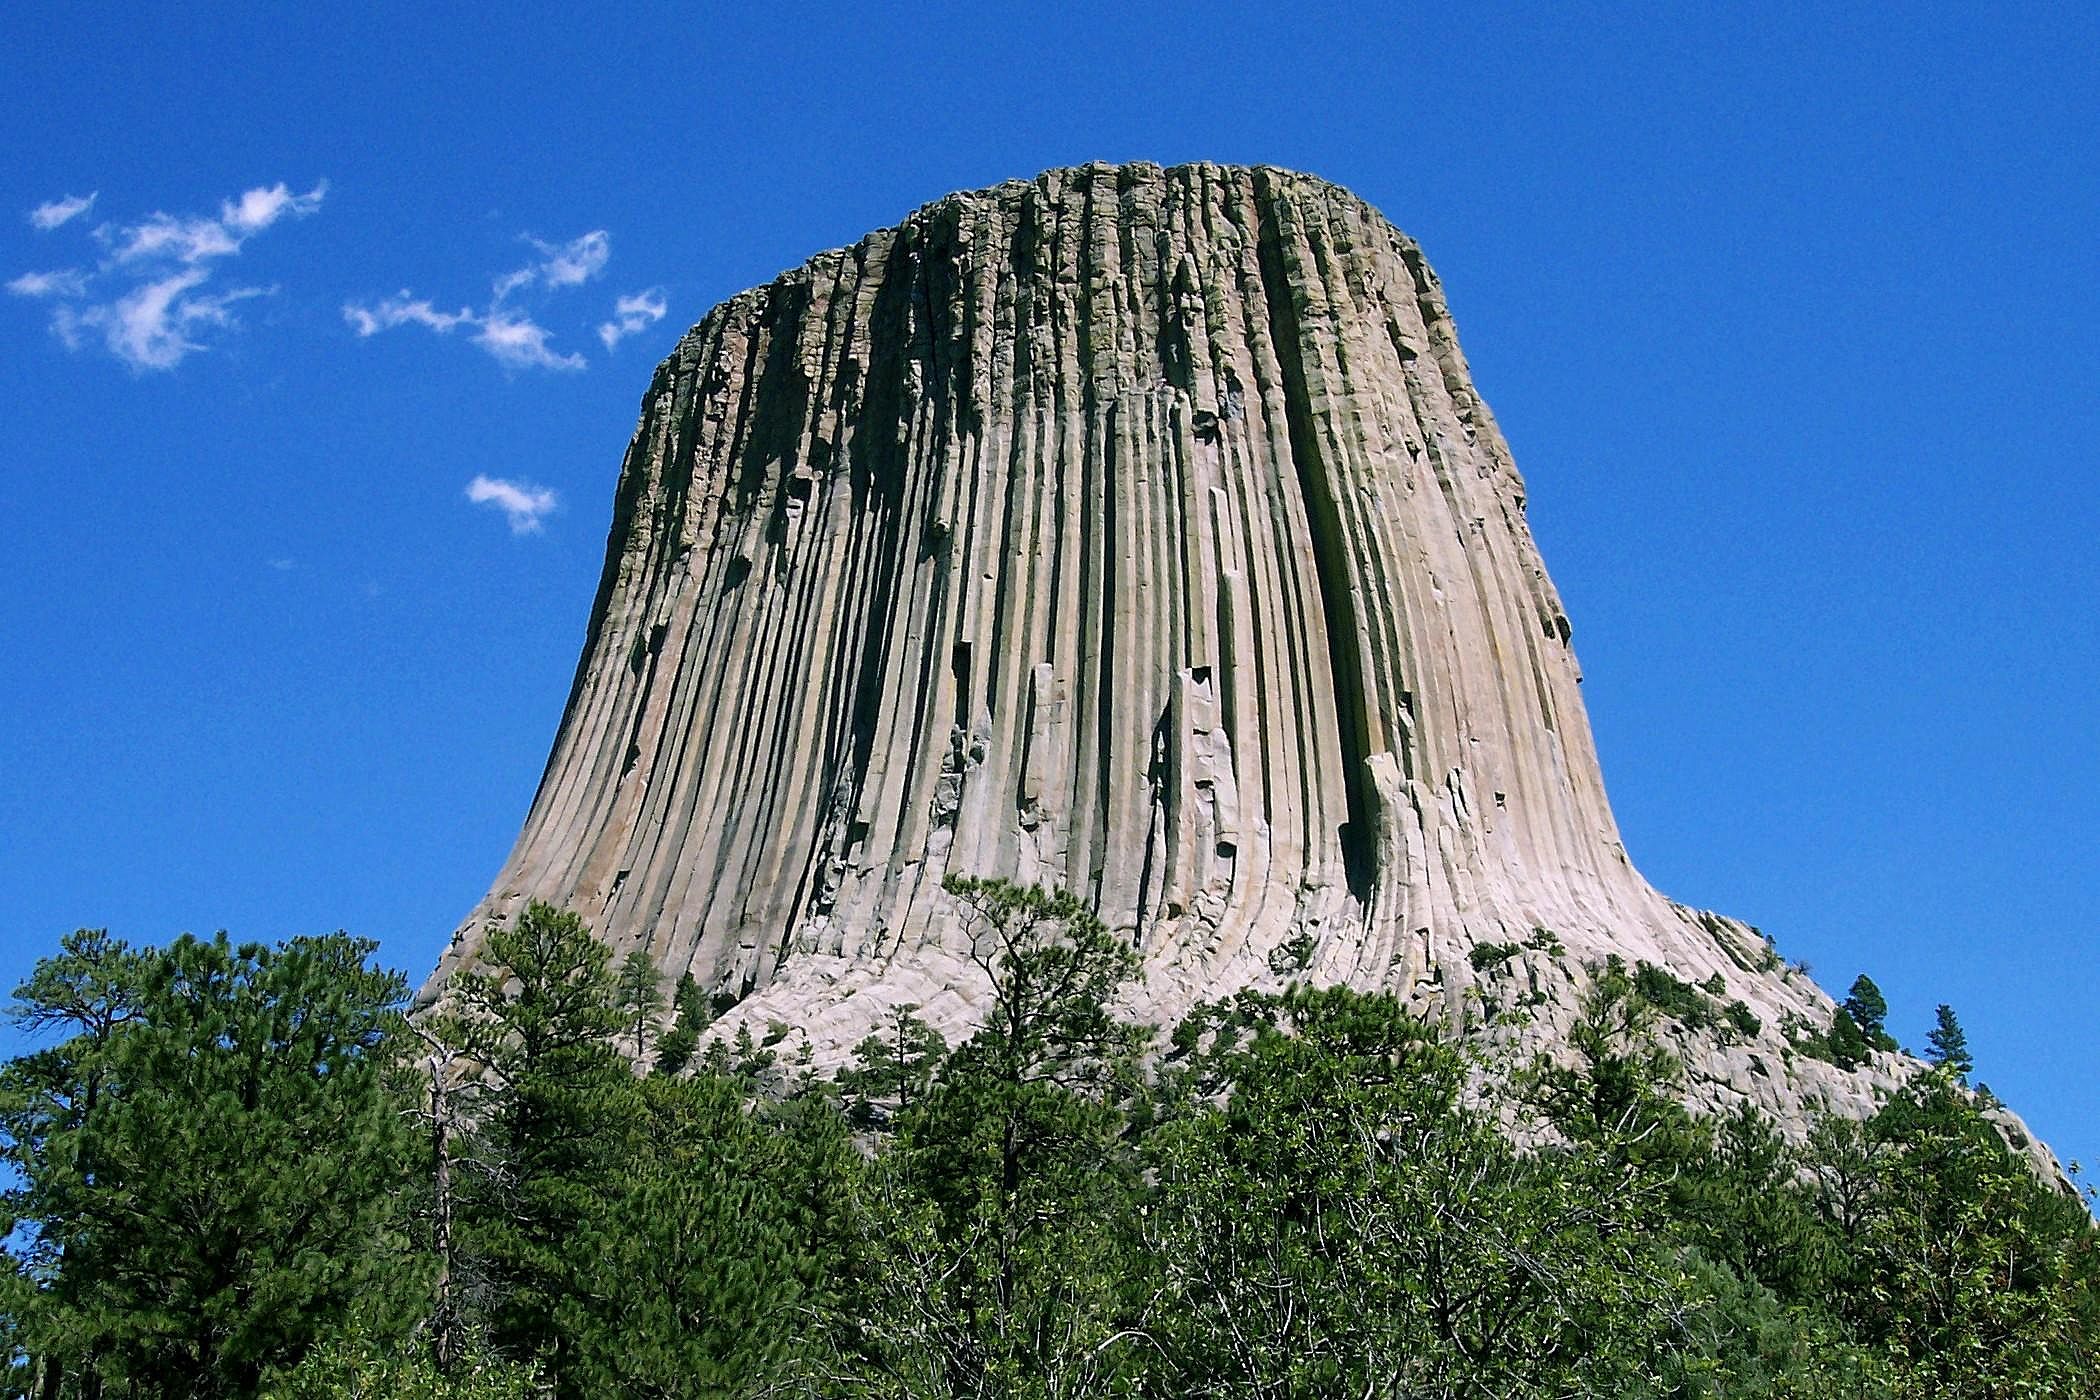
Colin.faulkingham // Wikimedia Commons
2 / 50Migrations from Wyoming in 2016: 145
Migrations from Wyoming in 2006: 592 (#46 among all states)
Change in migrations 2006-2016: down 75.5%

Clemens Vasters // Flickr
3 / 50Migrations from Nebraska in 2016: 164
Migrations from Nebraska in 2006: 564 (#47 among all states)
Change in migrations 2006-2016: down 70.9%

Daniel Mayer // Wikimedia Commons
4 / 50Migrations from New Mexico in 2016: 462
Migrations from New Mexico in 2006: 1,732 (#33 among all states)
Change in migrations 2006-2016: down 73.3%

Carl Wycoff // Flickr
5 / 50Migrations from Iowa in 2016: 480
Migrations from Iowa in 2006: 762 (#44 among all states)
Change in migrations 2006-2016: down 37.0%
You may also like: The most expensive neighborhoods in Charlotte

Jonathanking // Wikimedia Commons
6 / 50Migrations from Vermont in 2016: 608
Migrations from Vermont in 2006: 929 (#42 among all states)
Change in migrations 2006-2016: down 34.6%

Kurt Haubrich // Flickr
7 / 50Migrations from North Dakota in 2016: 668
Migrations from North Dakota in 2006: 862 (#43 among all states)
Change in migrations 2006-2016: down 22.5%
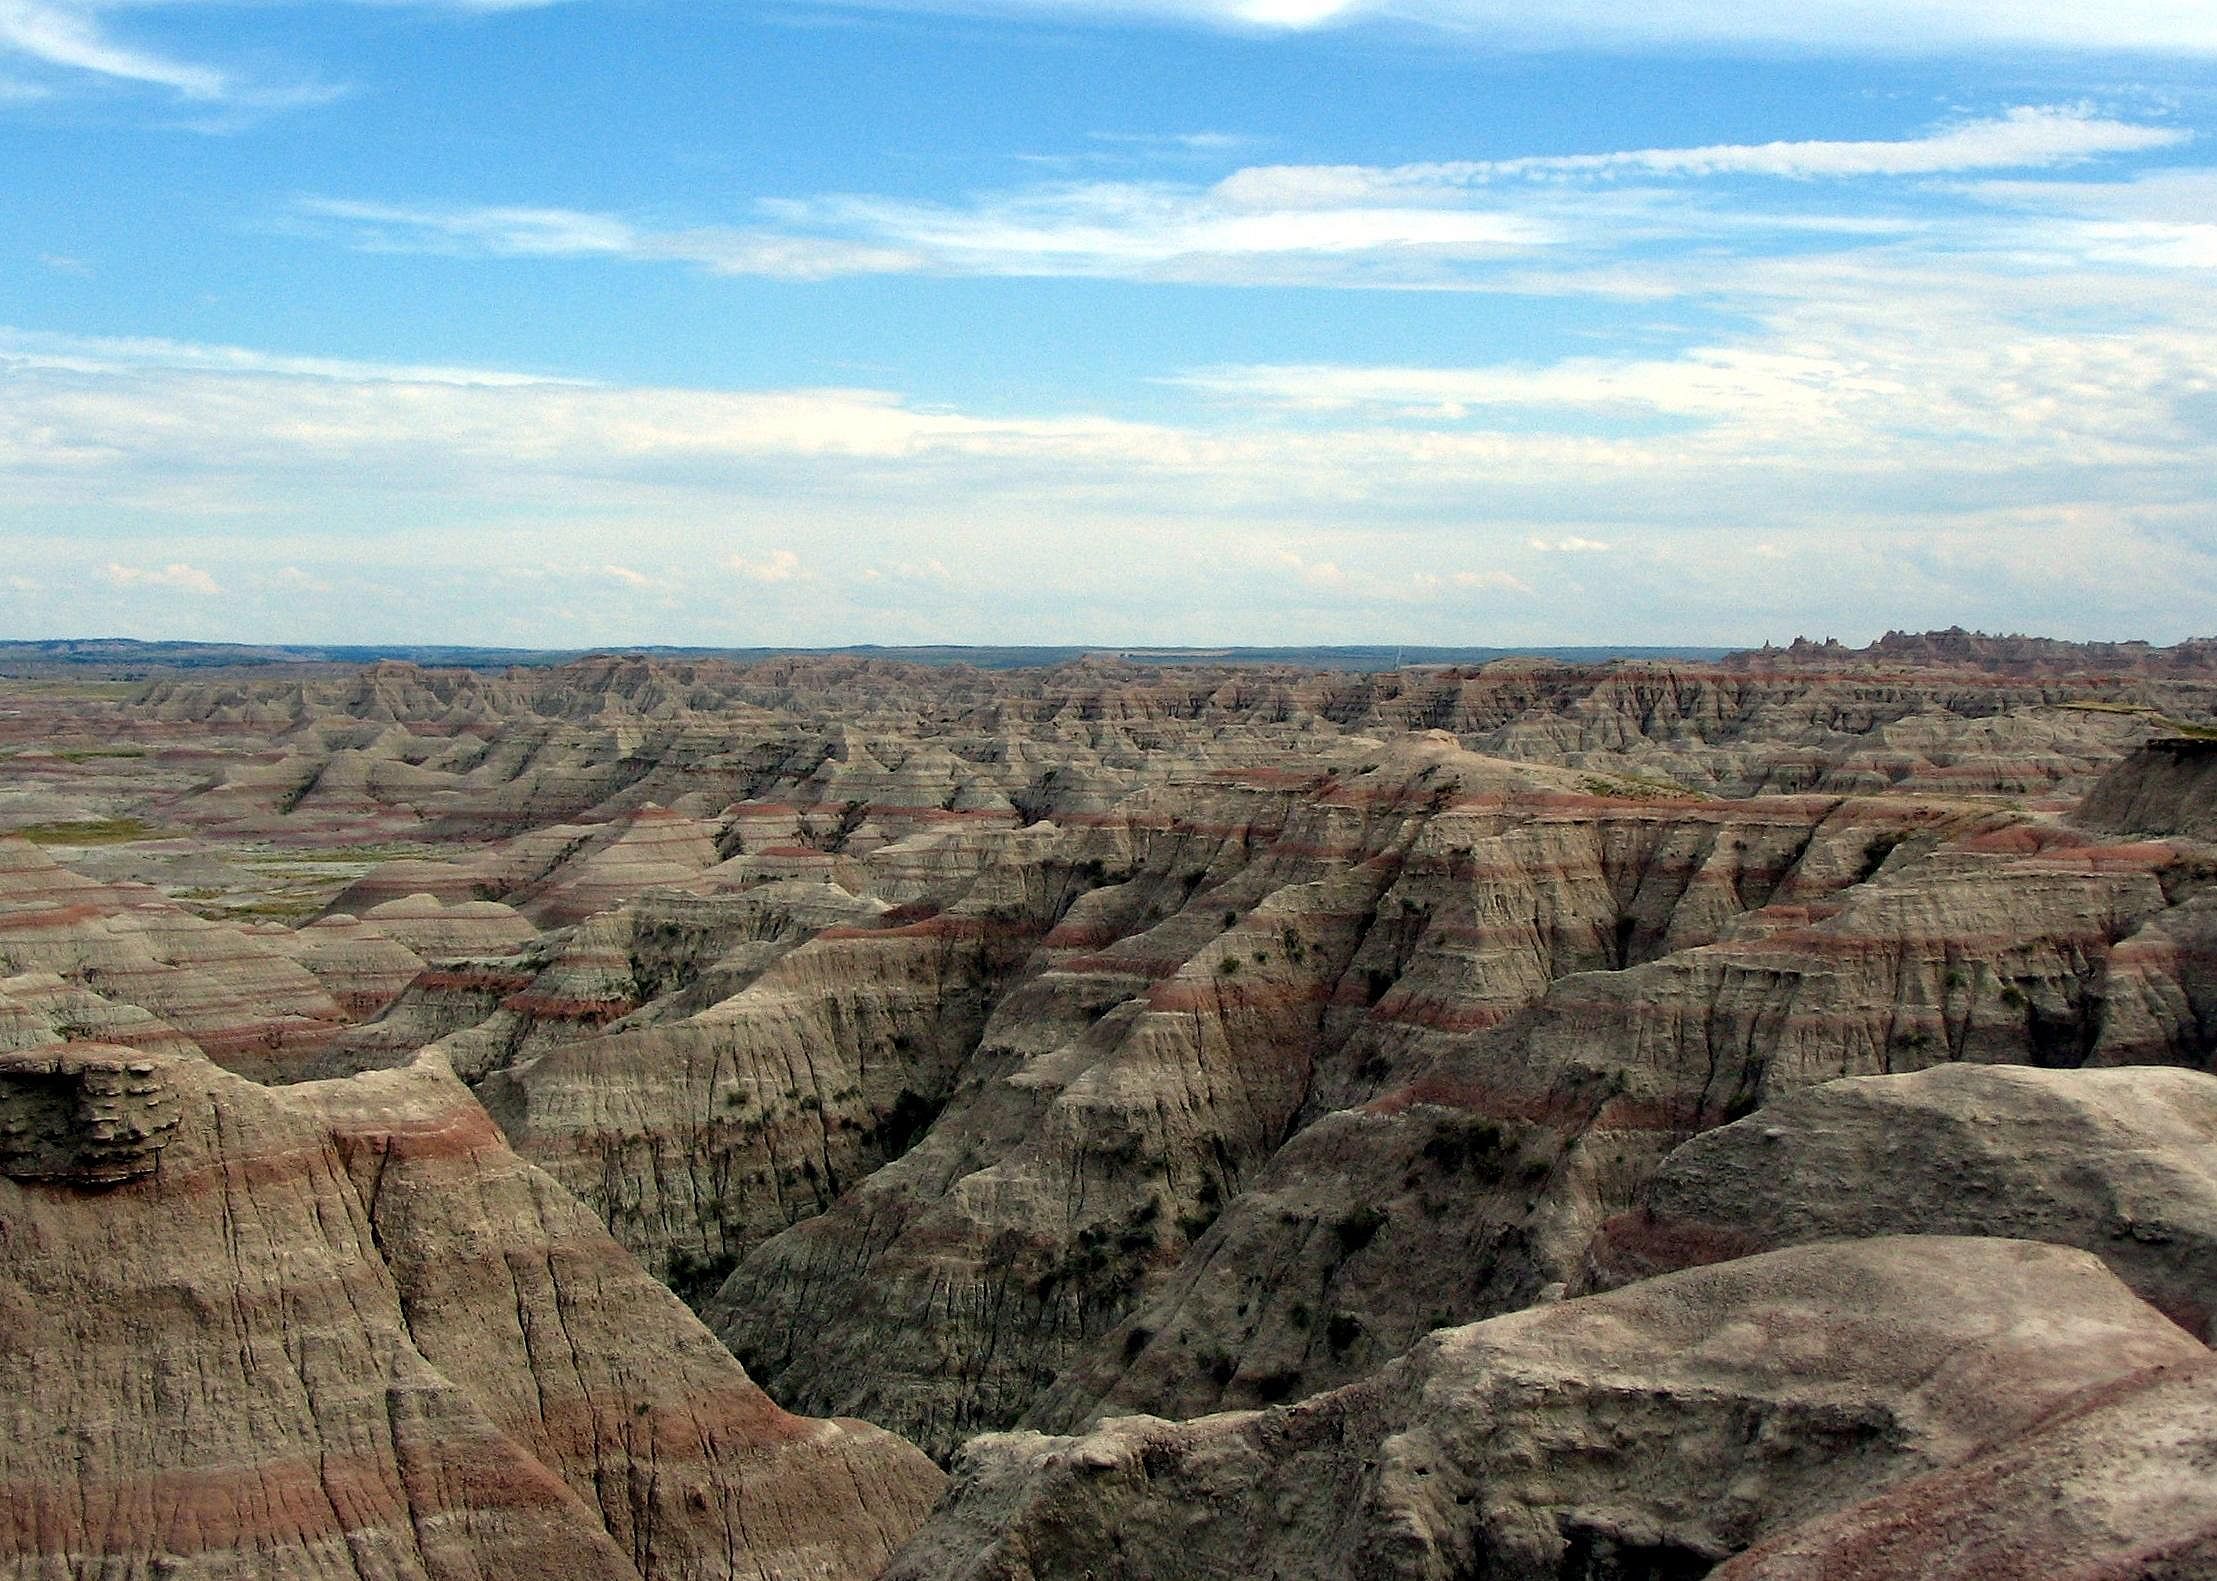
Wereldburger758 // Wikimedia Commons
8 / 50Migrations from South Dakota in 2016: 743
Migrations from South Dakota in 2006: 222 (#49 among all states)
Change in migrations 2006-2016: up 234.7%

Juliancolton // Wikimedia Commons
9 / 50Migrations from Rhode Island in 2016: 897
Migrations from Rhode Island in 2006: 1,219 (#38 among all states)
Change in migrations 2006-2016: down 26.4%

IIP Photo Archive // Flickr
10 / 50Migrations from Delaware in 2016: 955
Migrations from Delaware in 2006: 443 (#48 among all states)
Change in migrations 2006-2016: up 115.6%
You may also like: The most expensive homes sold in Charlotte this year
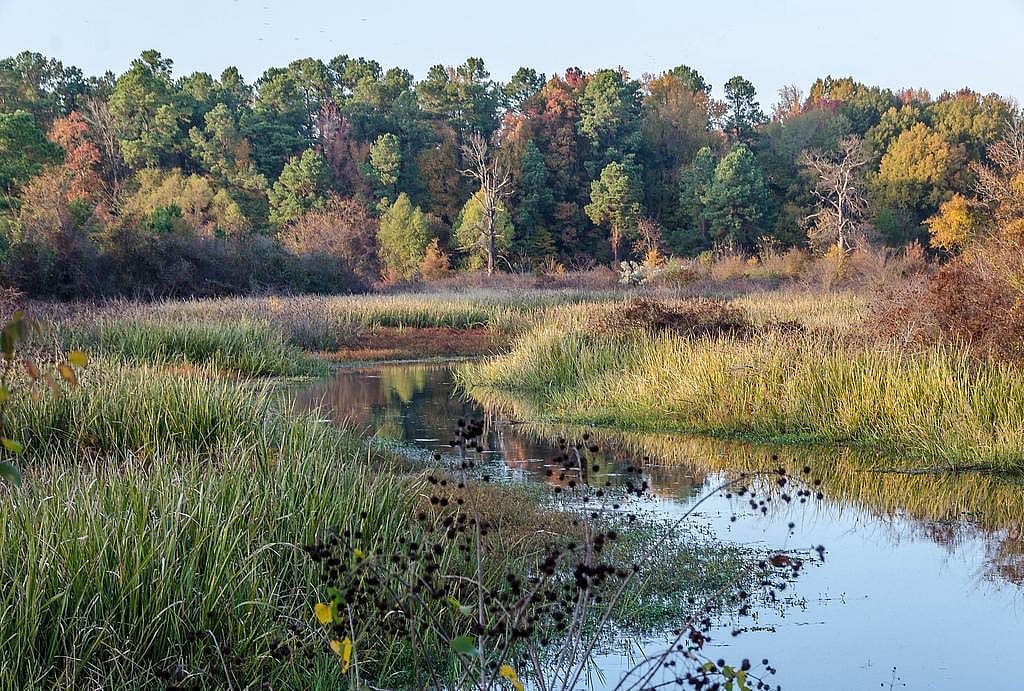
Keith Yahl // Flickr
11 / 50Migrations from Arkansas in 2016: 1,135
Migrations from Arkansas in 2006: 1,648 (#34 among all states)
Change in migrations 2006-2016: down 31.1%

Jeffrey Johnson // Wikimedia Commons
12 / 50Migrations from Oregon in 2016: 1,263
Migrations from Oregon in 2006: 2,135 (#29 among all states)
Change in migrations 2006-2016: down 40.8%

MotoWebMistress // Flickr
13 / 50Migrations from Idaho in 2016: 1,267
Migrations from Idaho in 2006: 1,627 (#35 among all states)
Change in migrations 2006-2016: down 22.1%

Palacemusic // Wikimedia Commons
14 / 50Migrations from Utah in 2016: 1,271
Migrations from Utah in 2006: 1,795 (#32 among all states)
Change in migrations 2006-2016: down 29.2%

heipei // Wikimedia Commons
15 / 50Migrations from Maine in 2016: 1,324
Migrations from Maine in 2006: 1,176 (#40 among all states)
Change in migrations 2006-2016: up 12.6%
You may also like: Best public middle schools in the Charlotte metro area

Jonathanking // Wikimedia Commons
16 / 50Migrations from Hawaii in 2016: 1,365
Migrations from Hawaii in 2006: 2,807 (#26 among all states)
Change in migrations 2006-2016: down 51.4%

Brent Moore // Wikimedia Commons
17 / 50Migrations from Mississippi in 2016: 1,509
Migrations from Mississippi in 2006: 2,664 (#27 among all states)
Change in migrations 2006-2016: down 43.4%

eric // Wikimedia Commons
18 / 50Migrations from New Hampshire in 2016: 1,548
Migrations from New Hampshire in 2006: 1,181 (#39 among all states)
Change in migrations 2006-2016: up 31.1%

Sean Pavone // Shutterstock
19 / 50Migrations from Washington D.C. in 2016: 1,737
Migrations from Washington D.C. in 2006: 3,076 (#22 among all states)
Change in migrations 2006-2016: down 43.5%

Greg Gjerdingen // Flickr
20 / 50Migrations from Minnesota in 2016: 1,782
Migrations from Minnesota in 2006: 1,467 (#36 among all states)
Change in migrations 2006-2016: up 21.5%
You may also like: People from these metros are looking to buy homes in Charlotte

Max Pixel
21 / 50Migrations from Alaska in 2016: 2,059
Migrations from Alaska in 2006: 997 (#41 among all states)
Change in migrations 2006-2016: up 106.5%

Samartur // Wikimedia Commons
22 / 50Migrations from Nevada in 2016: 2,111
Migrations from Nevada in 2006: 1,821 (#31 among all states)
Change in migrations 2006-2016: up 15.9%

K-State Research and Extension // Flickr
23 / 50Migrations from Kansas in 2016: 2,245
Migrations from Kansas in 2006: 665 (#45 among all states)
Change in migrations 2006-2016: up 237.6%

Pxhere
24 / 50Migrations from Louisiana in 2016: 2,562
Migrations from Louisiana in 2006: 5,627 (#15 among all states)
Change in migrations 2006-2016: down 54.5%

Jeremy Thompson // Flickr
25 / 50Migrations from Wisconsin in 2016: 2,600
Migrations from Wisconsin in 2006: 3,489 (#21 among all states)
Change in migrations 2006-2016: down 25.5%
You may also like: How much house does $500,000 buy you in Charlotte?

luissaenz_com // Flickr
26 / 50Migrations from Oklahoma in 2016: 2,997
Migrations from Oklahoma in 2006: 1,906 (#30 among all states)
Change in migrations 2006-2016: up 57.2%
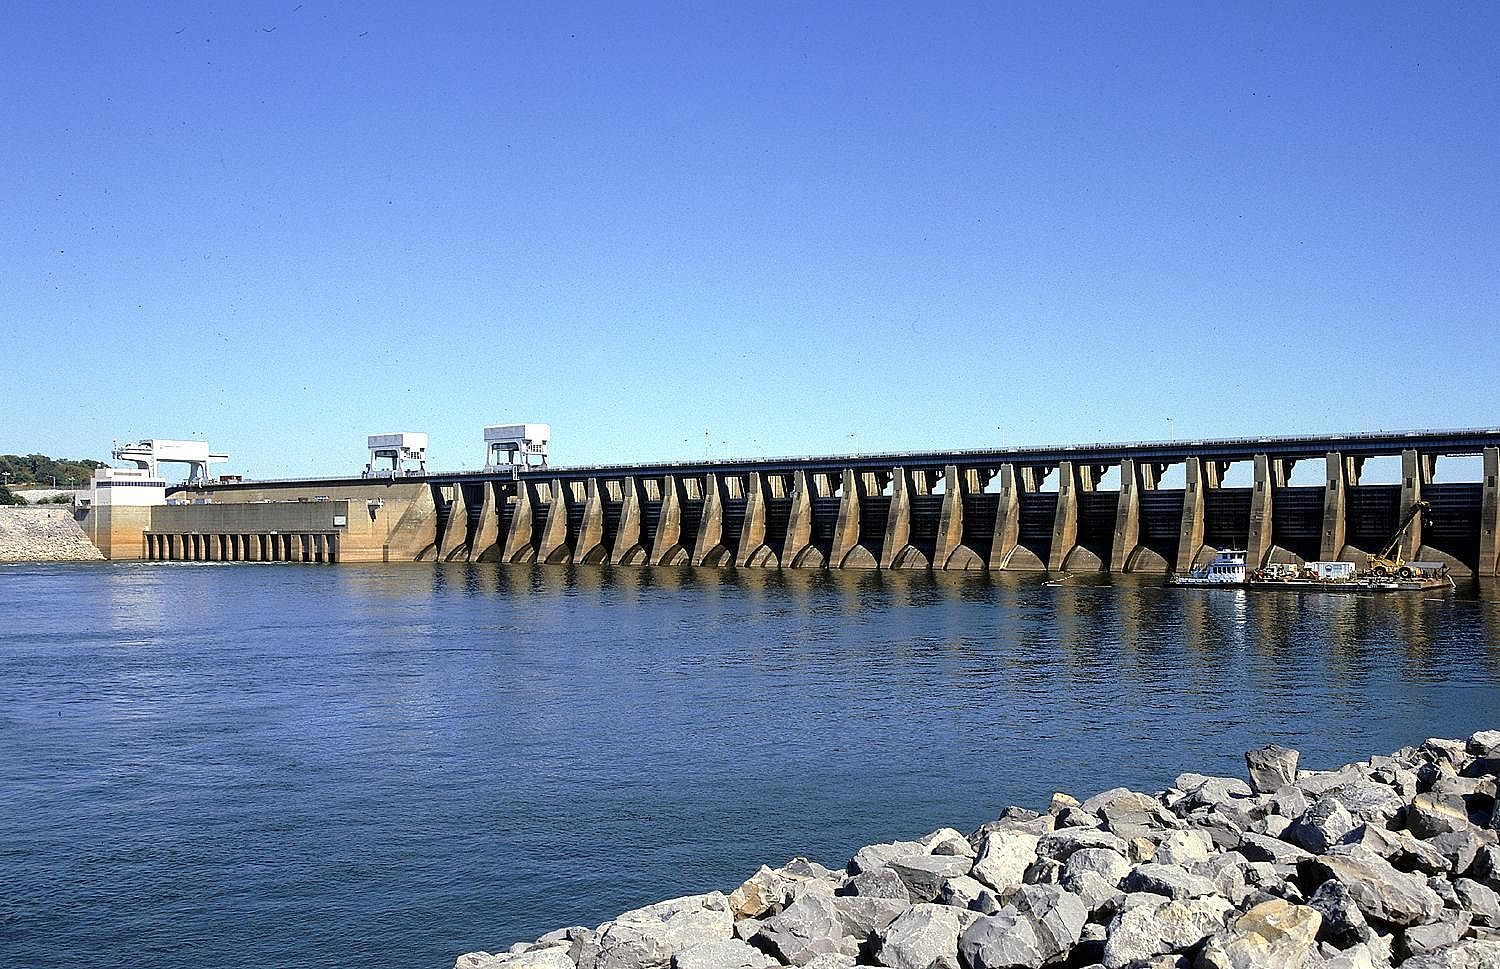
Tennessee Valley Authority // Wikimedia Commons
27 / 50Migrations from Kentucky in 2016: 3,409
Migrations from Kentucky in 2006: 1,456 (#37 among all states)
Change in migrations 2006-2016: up 134.1%

Jsfouche // Wikimedia Commons
28 / 50Migrations from Alabama in 2016: 3,491
Migrations from Alabama in 2006: 2,497 (#28 among all states)
Change in migrations 2006-2016: up 39.8%
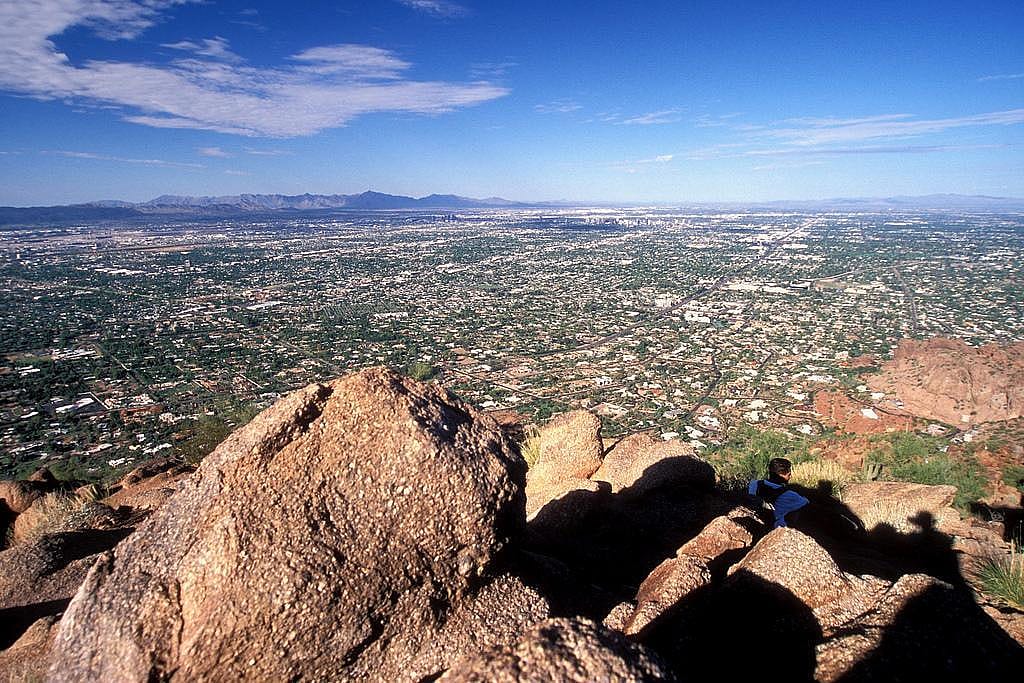
LASZLO ILYES // Flickr
29 / 50Migrations from Arizona in 2016: 3,539
Migrations from Arizona in 2006: 3,920 (#20 among all states)
Change in migrations 2006-2016: down 9.7%
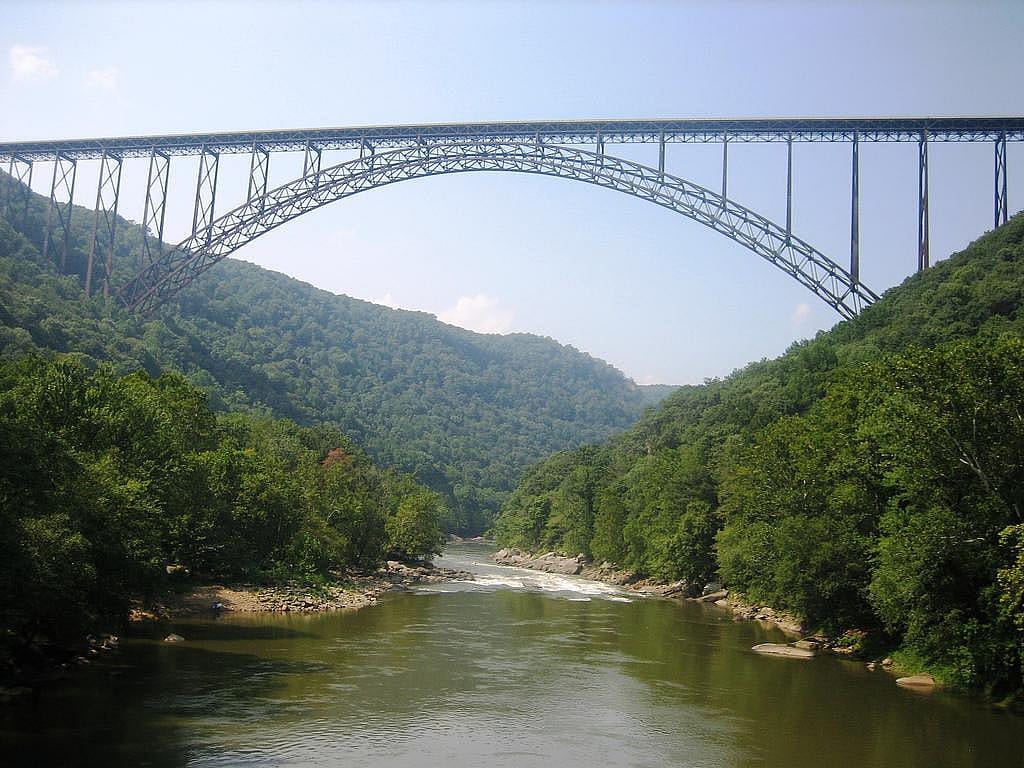
James McCauley // Flickr
30 / 50Migrations from West Virginia in 2016: 3,722
Migrations from West Virginia in 2006: 5,050 (#16 among all states)
Change in migrations 2006-2016: down 26.3%
You may also like: Highest-rated brunch restaurants in Charlotte

James Brosher // Wikimedia Commons
31 / 50Migrations from Indiana in 2016: 4,211
Migrations from Indiana in 2006: 4,367 (#19 among all states)
Change in migrations 2006-2016: down 3.6%

Rhododendrites // Wikimedia Commons
32 / 50Migrations from Colorado in 2016: 4,285
Migrations from Colorado in 2006: 3,074 (#23 among all states)
Change in migrations 2006-2016: up 39.4%

Robert Lawton // Wikimedia Commons
33 / 50Migrations from Missouri in 2016: 4,563
Migrations from Missouri in 2006: 3,002 (#24 among all states)
Change in migrations 2006-2016: up 52.0%
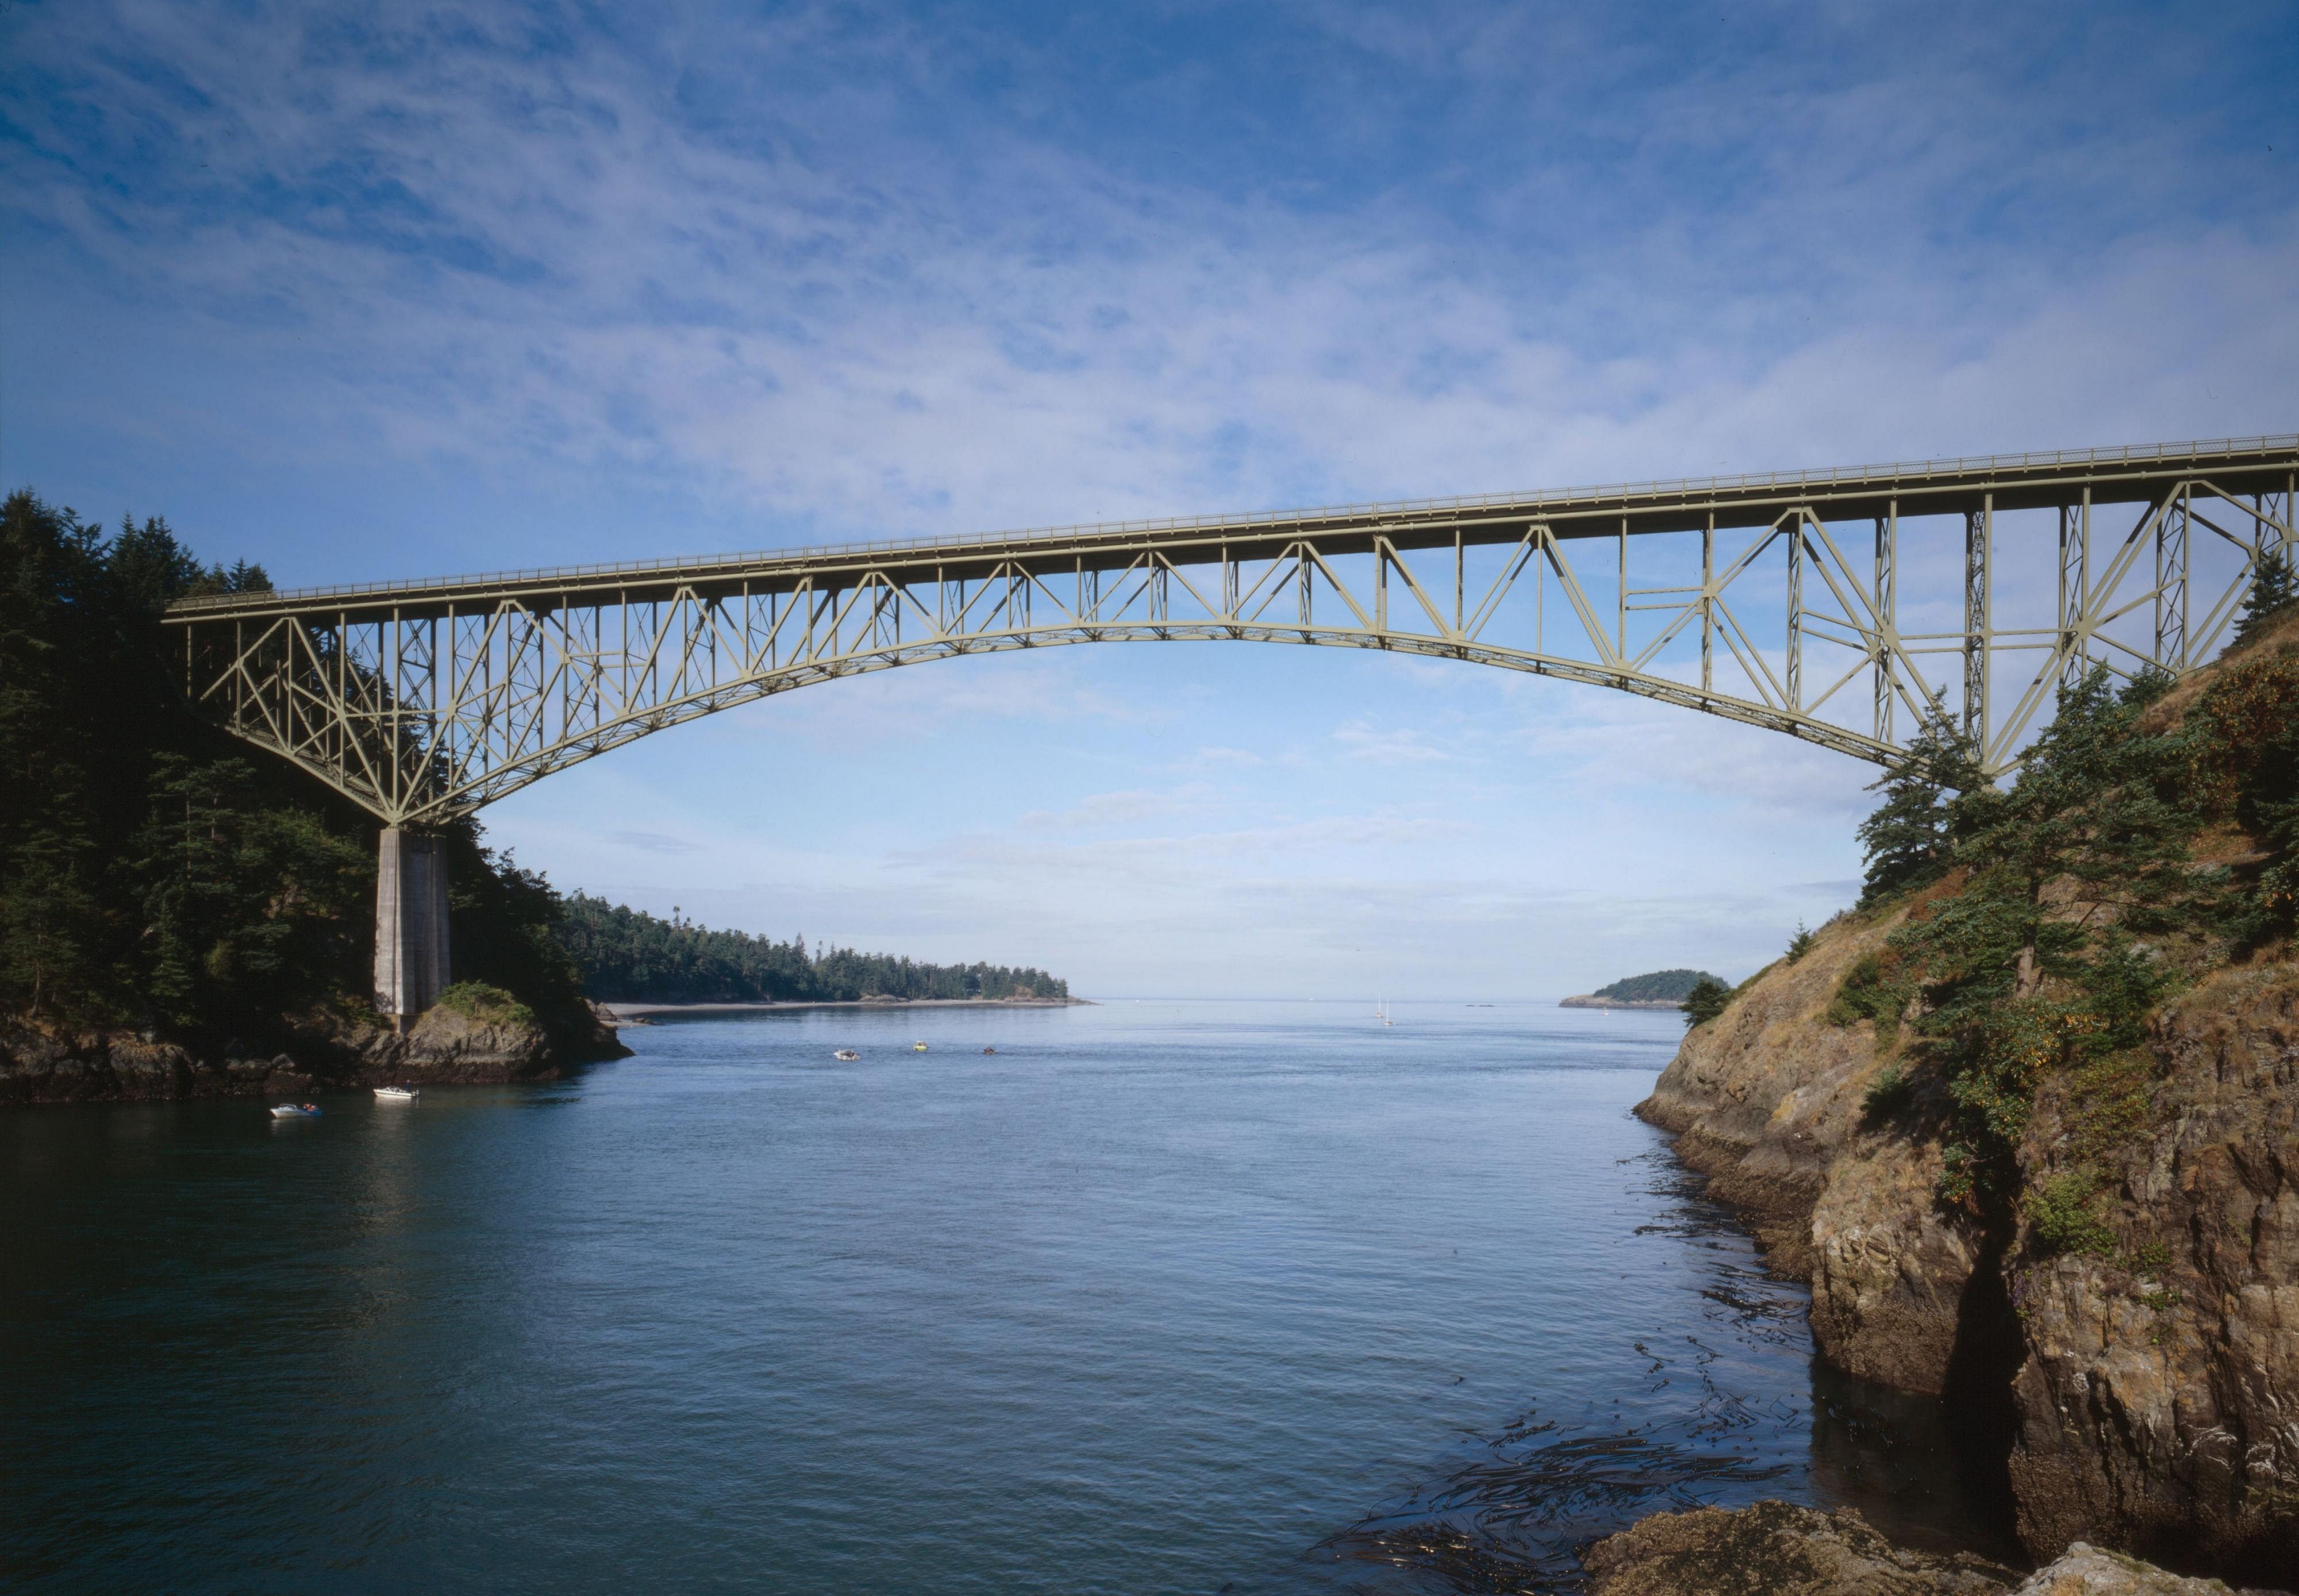
Martin H. // Wikimedia Commons
34 / 50Migrations from Washington in 2016: 4,751
Migrations from Washington in 2006: 2,952 (#25 among all states)
Change in migrations 2006-2016: up 60.9%

BenFrantzDale // Wikimedia Commons
35 / 50Migrations from Massachusetts in 2016: 5,116
Migrations from Massachusetts in 2006: 4,638 (#18 among all states)
Change in migrations 2006-2016: up 10.3%
You may also like: Highest-paying computer and engineering jobs in Charlotte
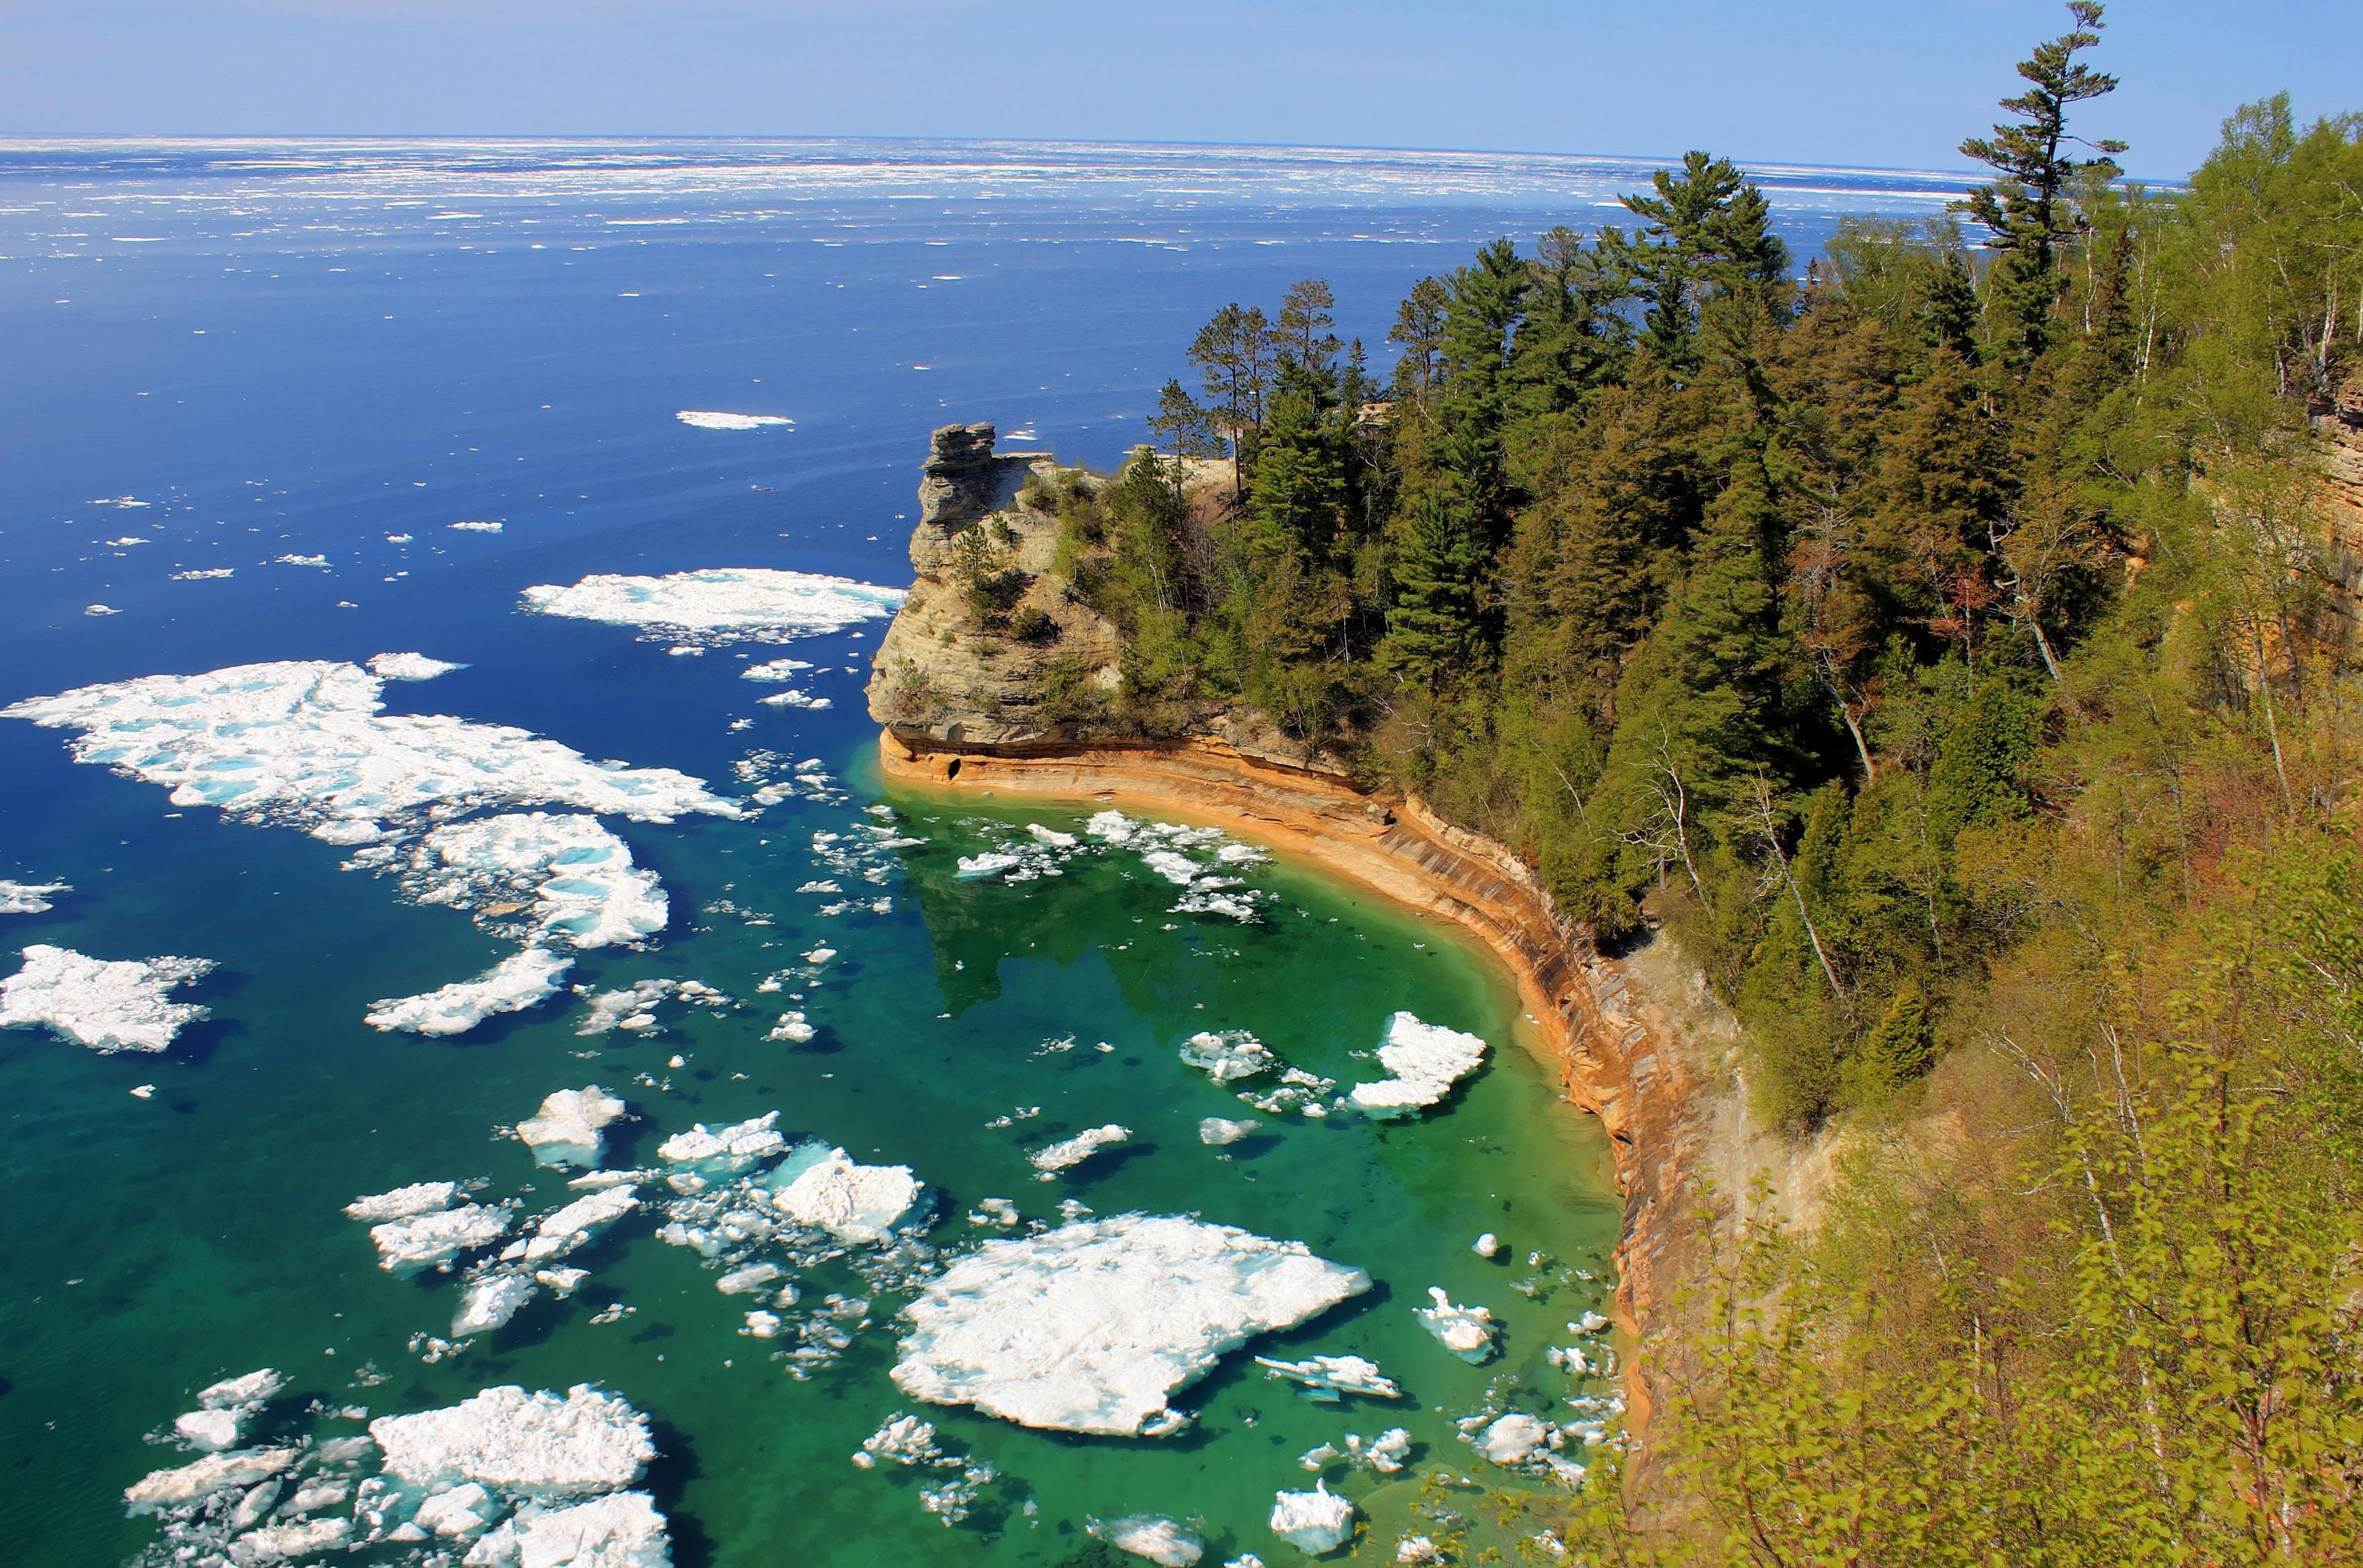
Yinan Chen // Wikimedia Commons
36 / 50Migrations from Michigan in 2016: 6,818
Migrations from Michigan in 2006: 6,529 (#13 among all states)
Change in migrations 2006-2016: up 4.4%
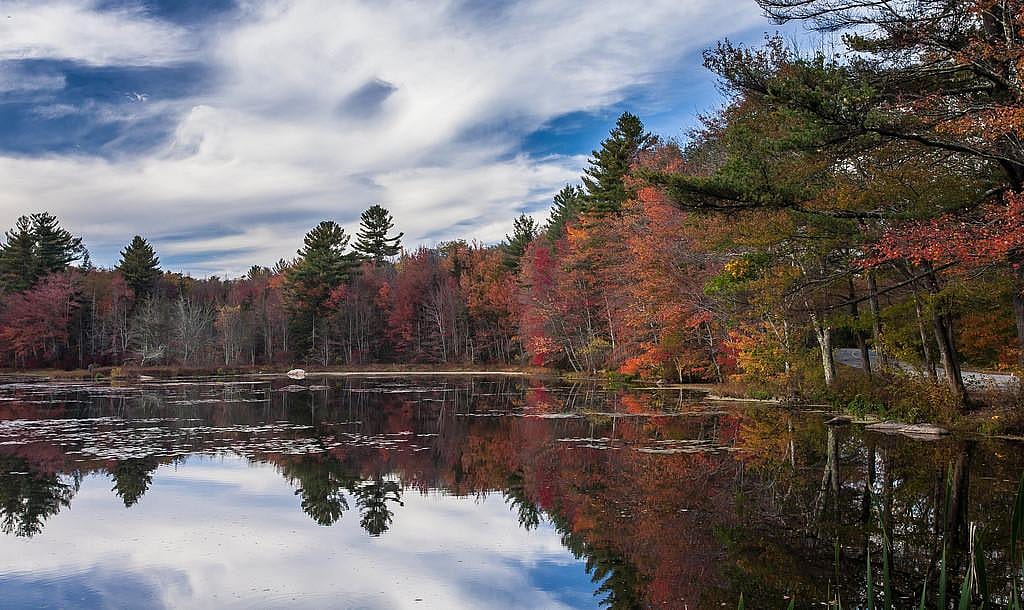
Peter Rintels //Wikimedia Commons
37 / 50Migrations from Connecticut in 2016: 7,425
Migrations from Connecticut in 2006: 5,006 (#17 among all states)
Change in migrations 2006-2016: up 48.3%

Todd Van Hoosear // Flickr
38 / 50Migrations from Tennessee in 2016: 8,233
Migrations from Tennessee in 2006: 6,836 (#12 among all states)
Change in migrations 2006-2016: up 20.4%
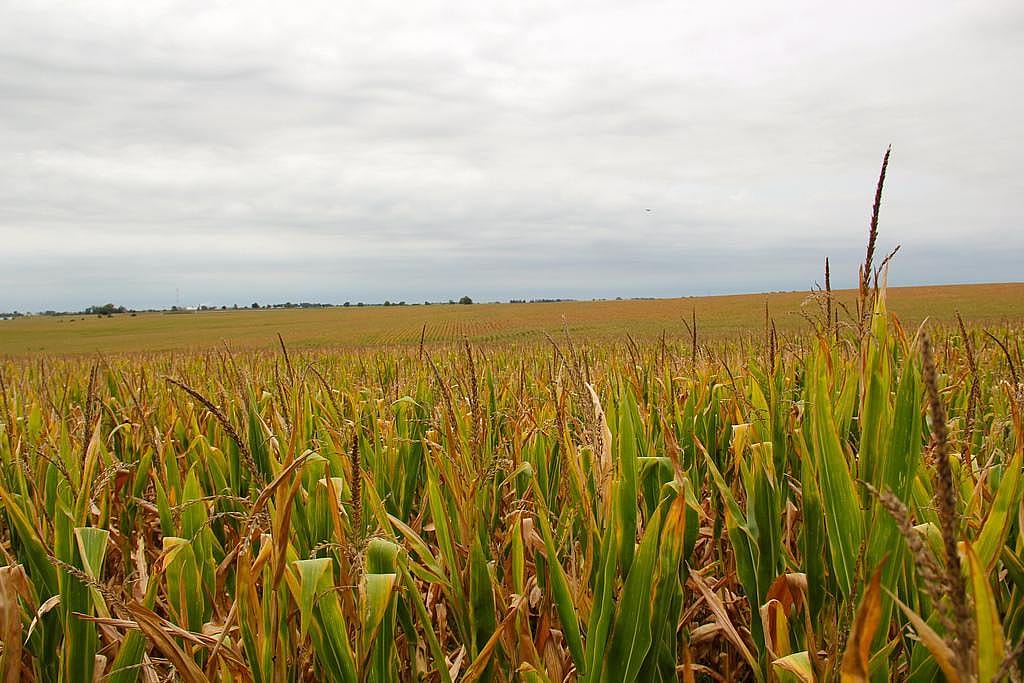
daveynin // Flickr
39 / 50Migrations from Illinois in 2016: 8,568
Migrations from Illinois in 2006: 6,496 (#14 among all states)
Change in migrations 2006-2016: up 31.9%

Jaknouse // Wikimedia Commons
40 / 50Migrations from Ohio in 2016: 9,665
Migrations from Ohio in 2006: 11,878 (#11 among all states)
Change in migrations 2006-2016: down 18.6%
You may also like: Highest-paying management jobs for people in Charlotte

James Cridland // Wikimedia Commons
41 / 50Migrations from Maryland in 2016: 9,671
Migrations from Maryland in 2006: 16,726 (#6 among all states)
Change in migrations 2006-2016: down 42.2%

Smallbones // Wikimedia Commons
42 / 50Migrations from New Jersey in 2016: 11,706
Migrations from New Jersey in 2006: 14,757 (#9 among all states)
Change in migrations 2006-2016: down 20.7%
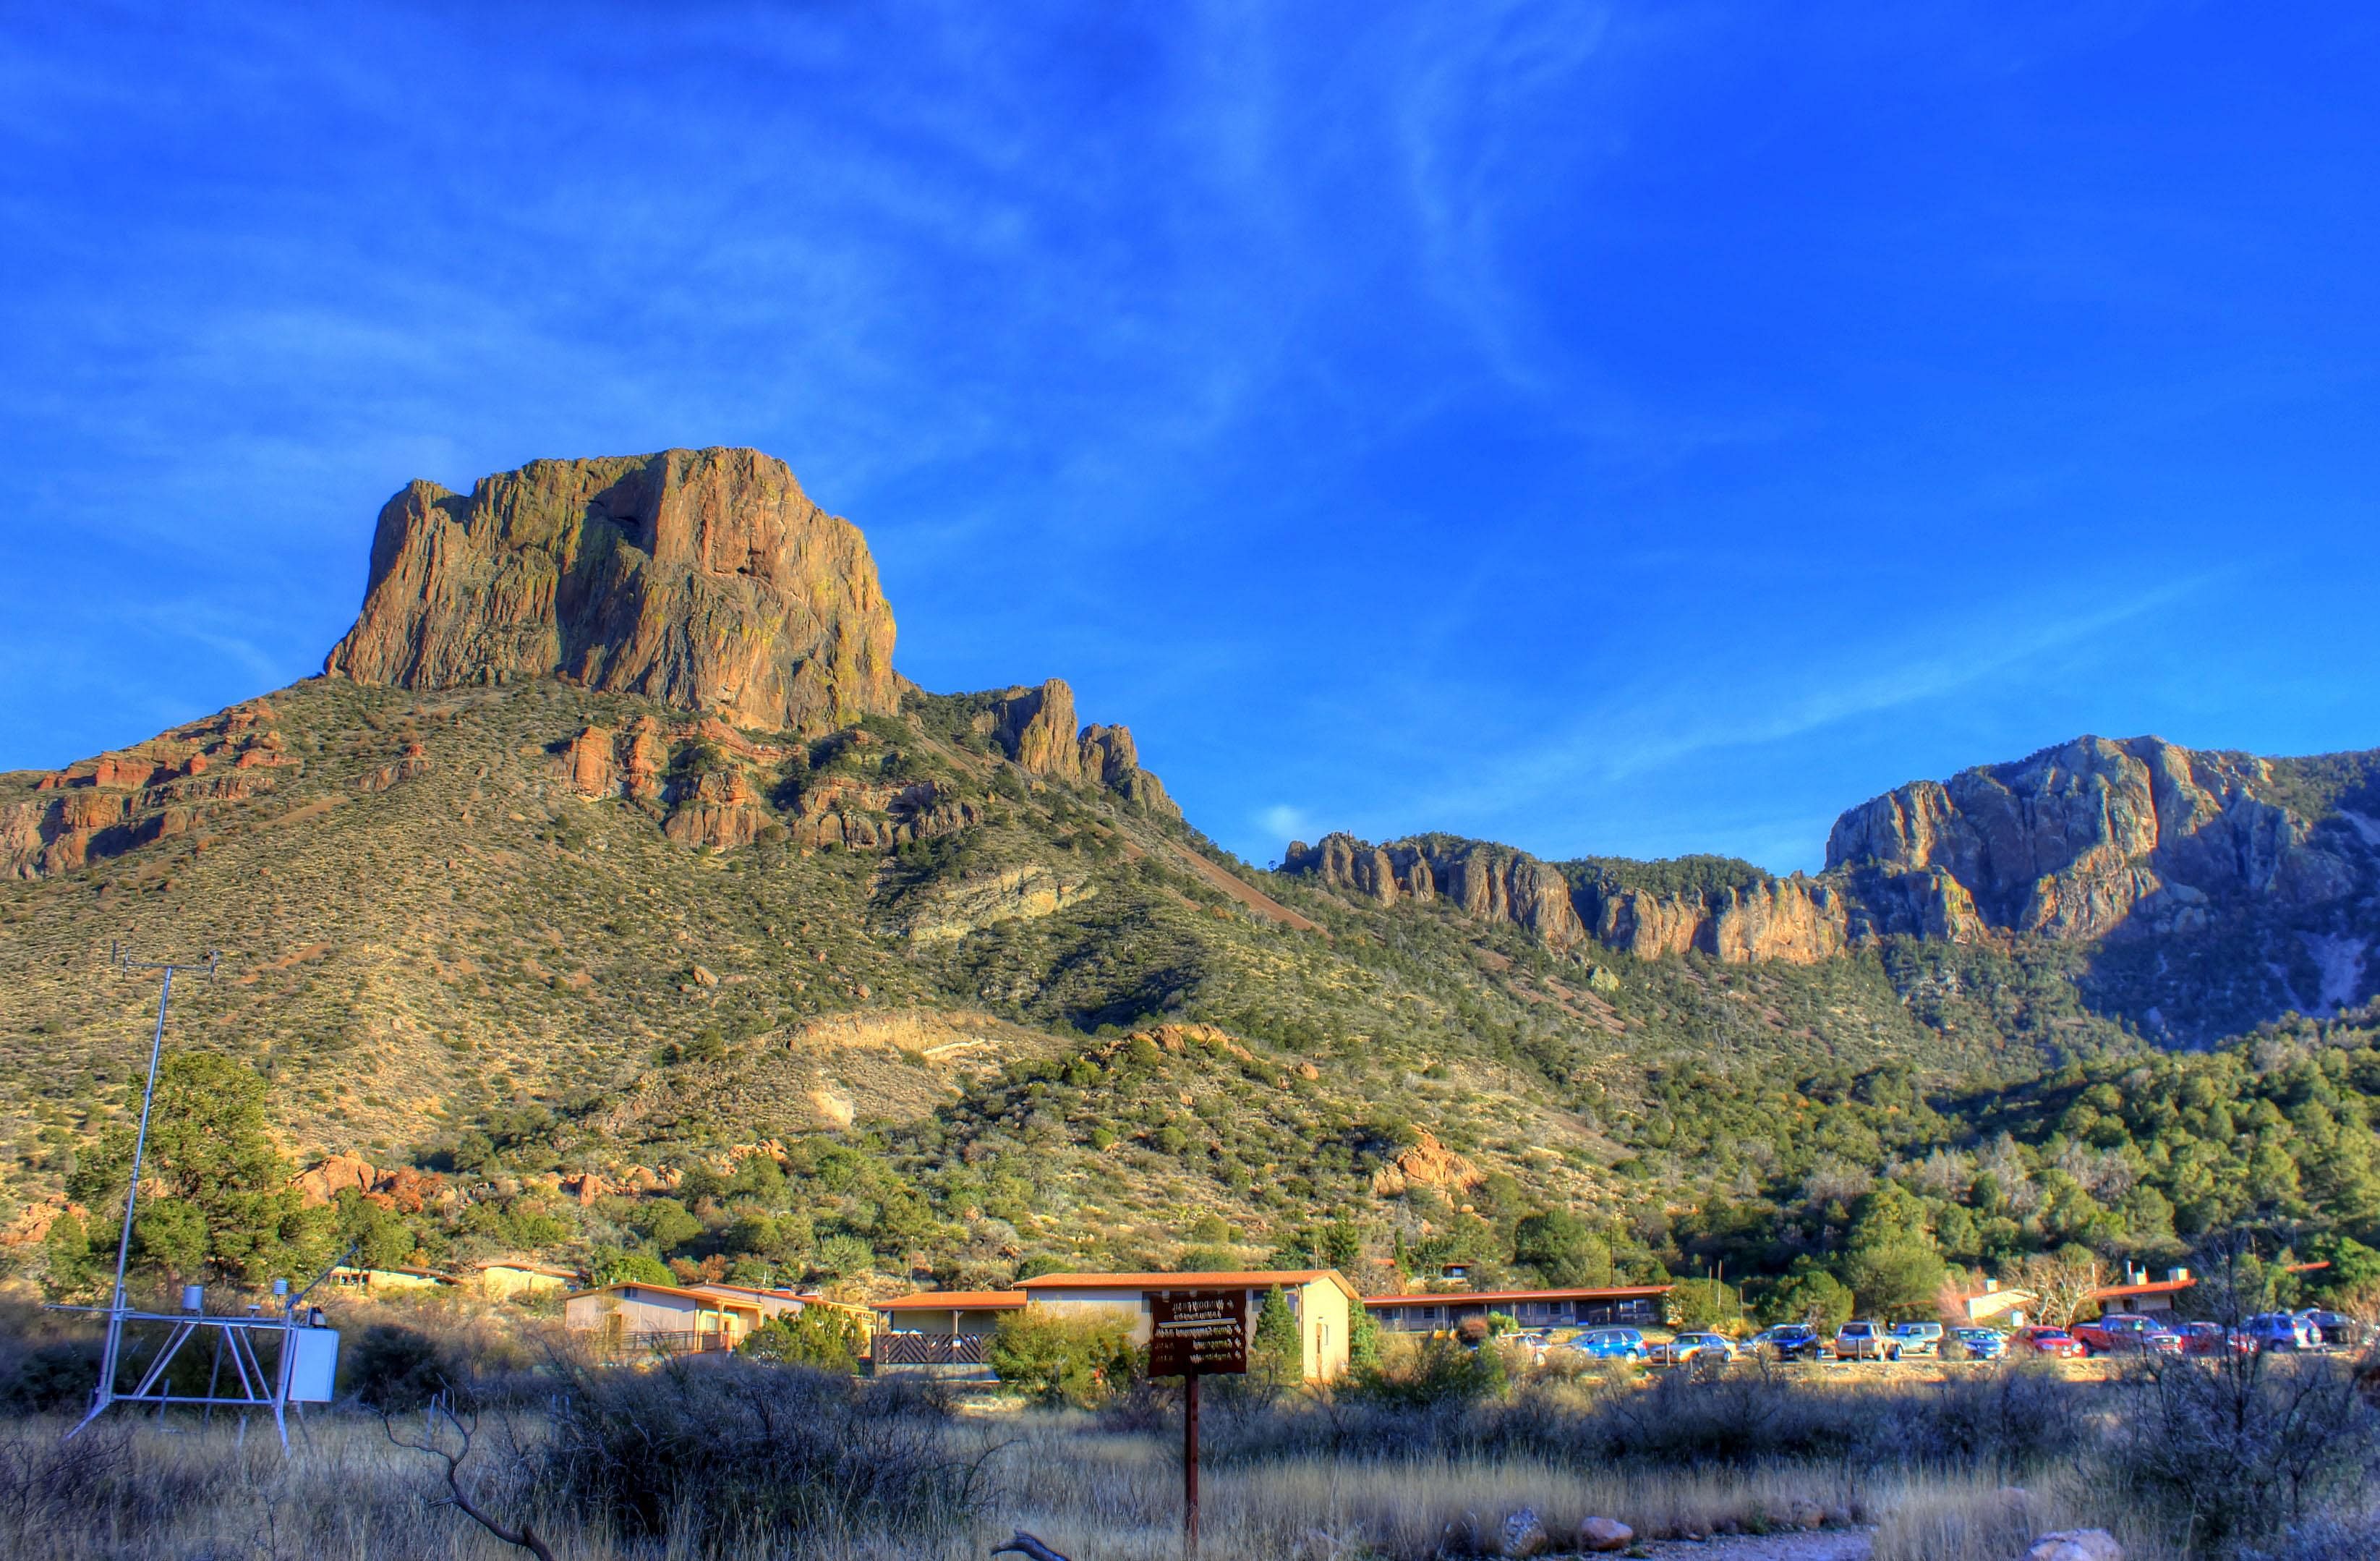
Yinan Chen // Flickr
43 / 50Migrations from Texas in 2016: 11,981
Migrations from Texas in 2006: 14,325 (#10 among all states)
Change in migrations 2006-2016: down 16.4%

Jeremy Thompson // Flickr
44 / 50Migrations from Pennsylvania in 2016: 13,506
Migrations from Pennsylvania in 2006: 15,361 (#8 among all states)
Change in migrations 2006-2016: down 12.1%
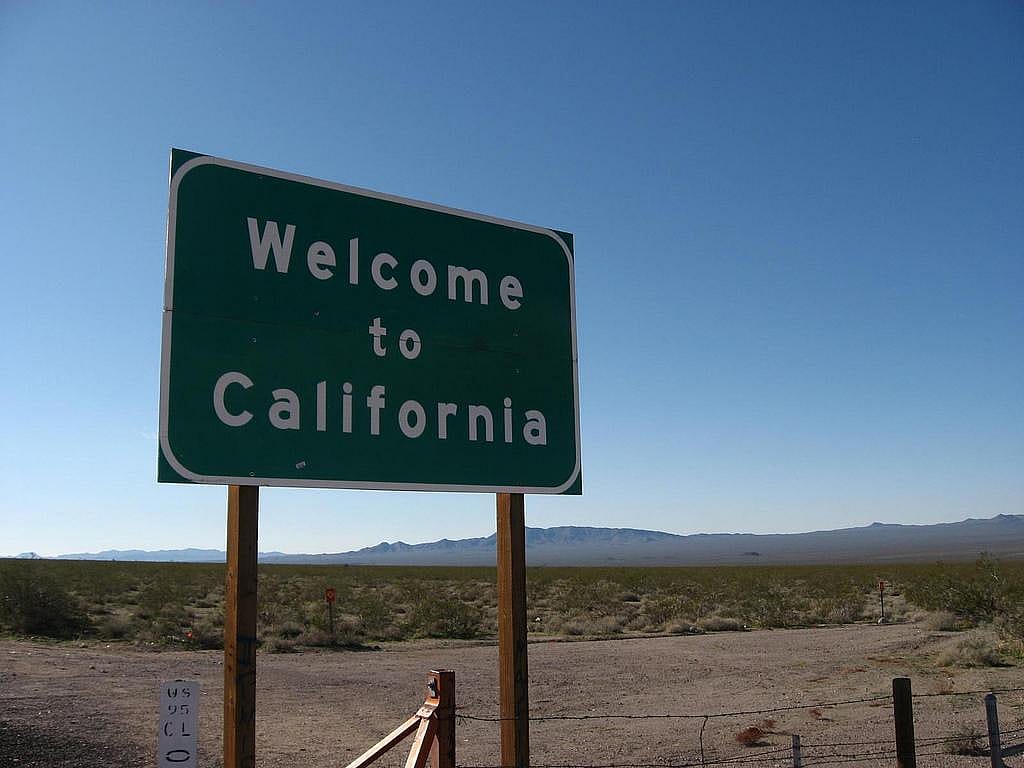
Ken L. // Flickr
45 / 50Migrations from California in 2016: 17,653
Migrations from California in 2006: 17,613 (#5 among all states)
Change in migrations 2006-2016: up 0.2%
You may also like: Movies and TV shows casting in Charlotte

PxHere
46 / 50Migrations from Georgia in 2016: 24,882
Migrations from Georgia in 2006: 16,200 (#7 among all states)
Change in migrations 2006-2016: up 53.6%

Ken L. // Flickr
47 / 50Migrations from New York in 2016: 29,702
Migrations from New York in 2006: 40,690 (#2 among all states)
Change in migrations 2006-2016: down 27.0%
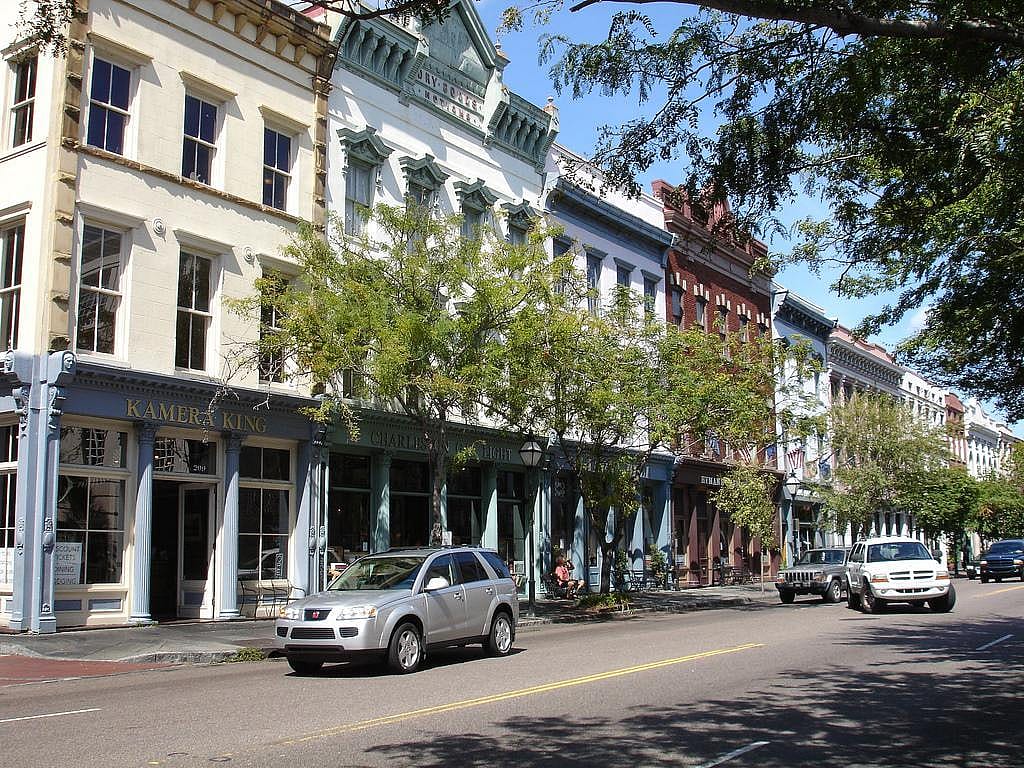
Becky Snyder // Flickr
48 / 50Migrations from South Carolina in 2016: 32,088
Migrations from South Carolina in 2006: 24,793 (#4 among all states)
Change in migrations 2006-2016: up 29.4%
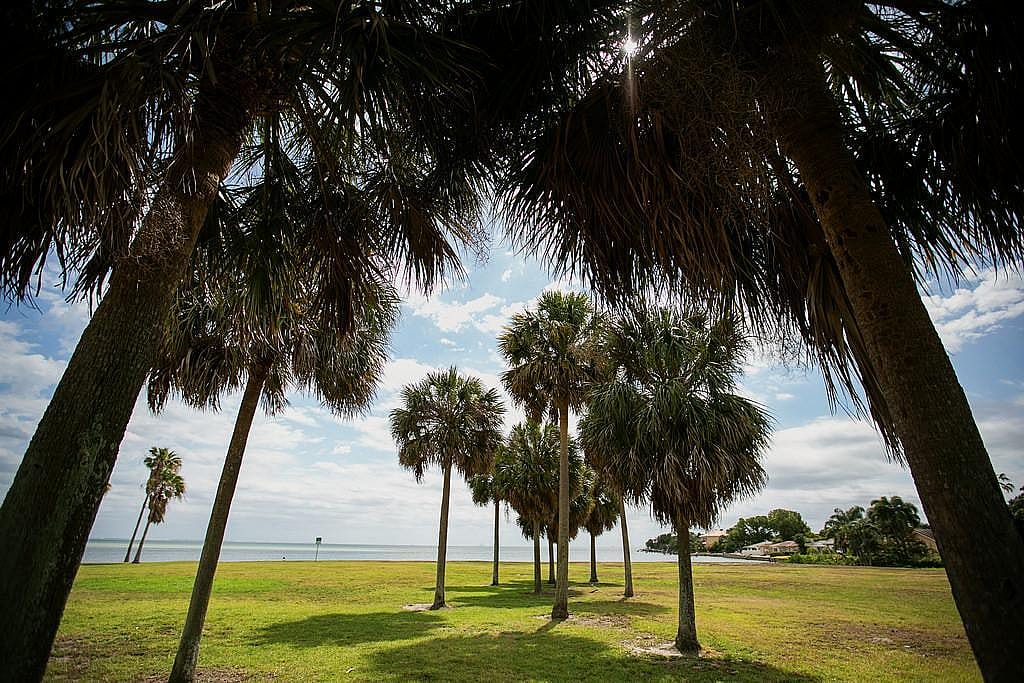
CityofStPete // Flickr
49 / 50Migrations from Florida in 2016: 32,234
Migrations from Florida in 2006: 41,059 (#1 among all states)
Change in migrations 2006-2016: down 21.5%

red, white, and black eyes forever // Flickr
50 / 50Migrations from Virginia in 2016: 35,641
Migrations from Virginia in 2006: 33,832 (#3 among all states)
Change in migrations 2006-2016: up 5.3%
You may also like: Highest-rated campgrounds in the Charlotte area by visitors



