David Garrison // Shutterstock
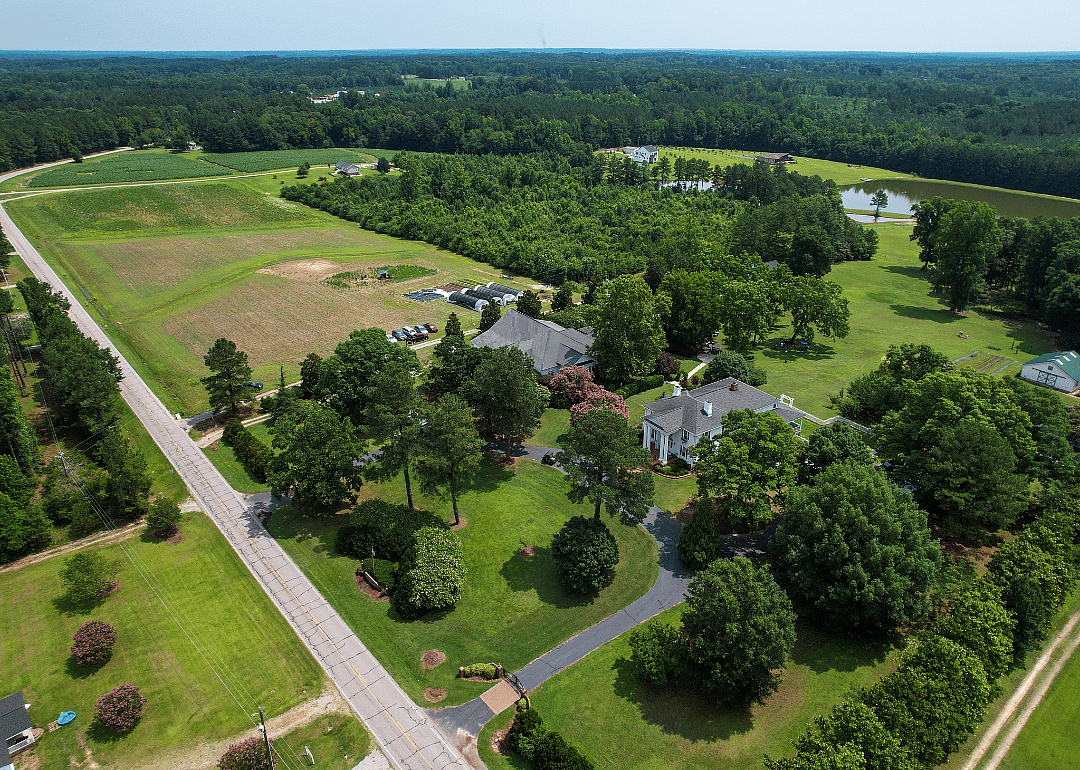
1 / 50#50. Franklin County
- Total high-hazard dams: 11
- Number potentially dangerous: 2 (18.2%)
- Potentially dangerous dams include:
--- 2 in poor condition

Record rainfall pelted parts of Iowa for 12 hours straight in July 2010, sending 10 inches of rainwater draining toward Lake Delhi, Iowa, a popular recreation destination for decades since its construction in the 1920s.
Holding back 9 miles of lake water with more precipitation flowing in by the minute was the 80-year-old Lake Delhi Dam, constructed of hundreds of feet of earth, concrete, and steel. The water punched a 30-foot-wide hole in the dam wall, spewing floodwater into the surrounding region.
Emergency and state officials ordered evacuations in time to prevent any loss of life. For safety professionals, the failure underscored the threat posed to dams by climate change (increasing the risk of flooding events), the importance of regular maintenance and inspection, and the impact of human errors in dam construction on dam integrity.
In North Carolina, there are a total of 1,533 high-hazard dams. Up to 24.3% of them could pose a threat to residents, including those that were assessed to be an immediate threat or in poor condition, those that were not rated, and those which had ratings withheld.
As part of a national analysis, GetMyBoat identified counties in North Carolina with the most dams at risk of failure that pose the greatest potential threat to nearby residents, using data from the Army Corps of Engineers' National Inventory of Dams, pulled in October 2023. The public database allowing Americans to look up the conditions of nearby dams has grown to include more than 90,000 dams.
As more dams get added to the national inventory, analyses of this database reveal a growing number of dams in poor and unsatisfactory condition, some of which have the potential to be life-threatening should they fail—dams the inventory deems "high-hazard."
Counties in this analysis are ranked by the share of high-hazard dams that could pose a danger to human life, including those assessed to be in "poor" or "unsatisfactory" condition, those that haven't received inspections, and those where the state agency that oversees them has not rated its conditions. Ties were broken by the overall number of dams meeting those criteria, and then by their concentration among local populations, though some ties may remain.
A designation of "poor" is given to inspected dams showing deficiencies that threaten the dam's integrity during normal operations. "Unsatisfactory" is given to dams that require "immediate or emergency remedial action," according to the Army Corps of Engineers. About 1 in 10 of the inventory's dam listings have no condition reported by state agencies.
"It is likely most of these dams should be listed at not rated, but we will work with the appropriate agencies to verify the information and update the NID accordingly," Army Corps of Engineers spokesperson Gene Pawlik said in a statement.
The names of dams accompanying each state in the analysis represent the largest dams by height that were in poor or unsatisfactory condition. The total number and concentration of high-hazard dams give a sense of the stakes involved with aging infrastructure in each state, though those figures don't factor into the ranking.
The Lake Delhi Dam was reconstructed and was last inspected in 2020, receiving a "satisfactory" grade. The dam is considered one risk level below high-hazard, "significant hazard." But its failure in 2010 provides an example of the high stakes communities living near large dams face when they fail.
Illinois ranks high on this list, mainly because of what is unknown about the conditions of its dams. The Army Corps of Engineers leaves it up to state agencies to decide what information it provides or withholds from the public database. Illinois only shares info on three of its dams deemed to be high-hazard. One of its engineers has previously said that it doesn't rate dams' conditions because the process is too resource-intensive to justify.
Many state and federal agencies have chosen to keep data about those dams hidden, citing threats to national security. North Dakota and Oregon withhold data about around 40% of the dams in their states, making it difficult for locals to assess just how many are in good condition or need attention.
Other states rank poorly for their share of high-hazard dams that have gone without inspection. In Missouri, about 42% of these dams don't have a recorded date of last inspection. Another 24% were last inspected prior to 2000.
Read on to see how dams in your area fare based on publicly available data.
David Garrison // Shutterstock
1 / 50- Total high-hazard dams: 11
- Number potentially dangerous: 2 (18.2%)
- Potentially dangerous dams include:
--- 2 in poor condition
Nolichuckyjake // Shutterstock
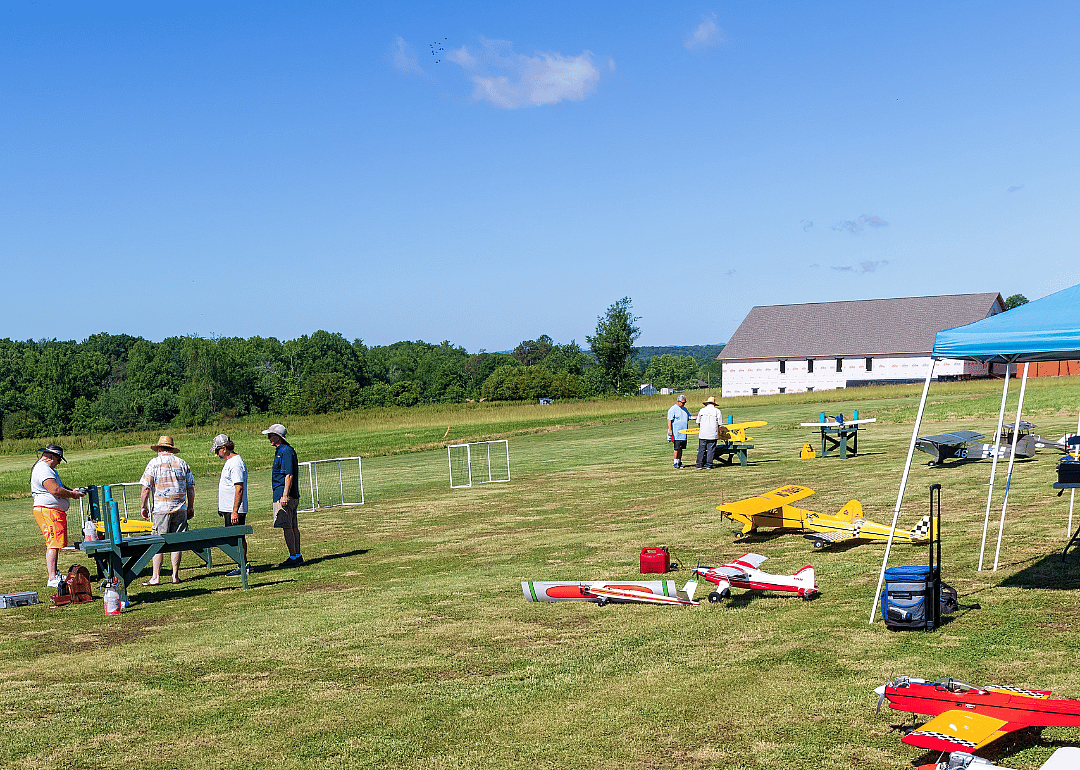
2 / 50- Total high-hazard dams: 11
- Number potentially dangerous: 2 (18.2%)
- Potentially dangerous dams include:
--- 1 in poor condition
--- 1 not rated

Nolichuckyjake // Shutterstock
3 / 50- Total high-hazard dams: 21
- Number potentially dangerous: 4 (19.0%)
- Potentially dangerous dams include:
--- 2 posing immediate threat
--- 1 in poor condition
--- 1 not rated
Canva
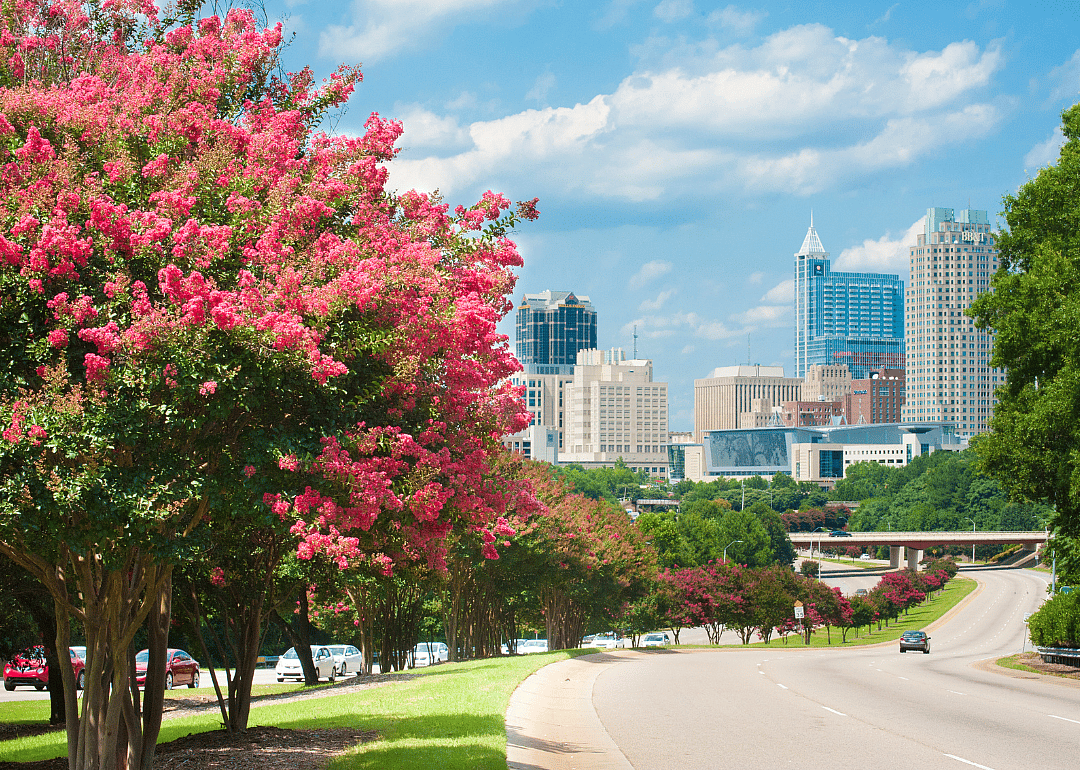
4 / 50- Total high-hazard dams: 186
- Number potentially dangerous: 36 (19.4%)
- Potentially dangerous dams include:
--- 16 in poor condition
--- 19 not rated
--- 1 condition withheld

refrina // Shutterstock
5 / 50- Total high-hazard dams: 5
- Number potentially dangerous: 1 (20.0%)
- Potentially dangerous dams include:
--- 1 not rated
CJ Nunnery // Shutterstock
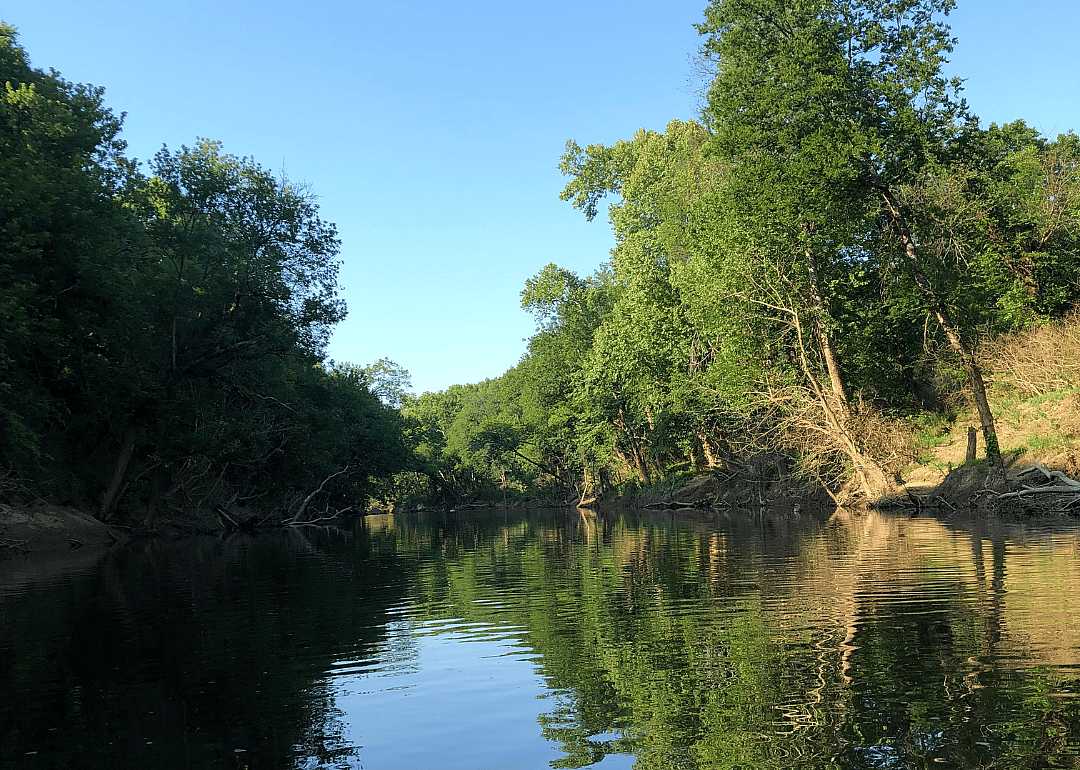
6 / 50- Total high-hazard dams: 10
- Number potentially dangerous: 2 (20.0%)
- Potentially dangerous dams include:
--- 2 in poor condition

Canva
7 / 50- Total high-hazard dams: 80
- Number potentially dangerous: 16 (20.0%)
- Potentially dangerous dams include:
--- 8 in poor condition
--- 7 not rated
--- 1 condition withheld
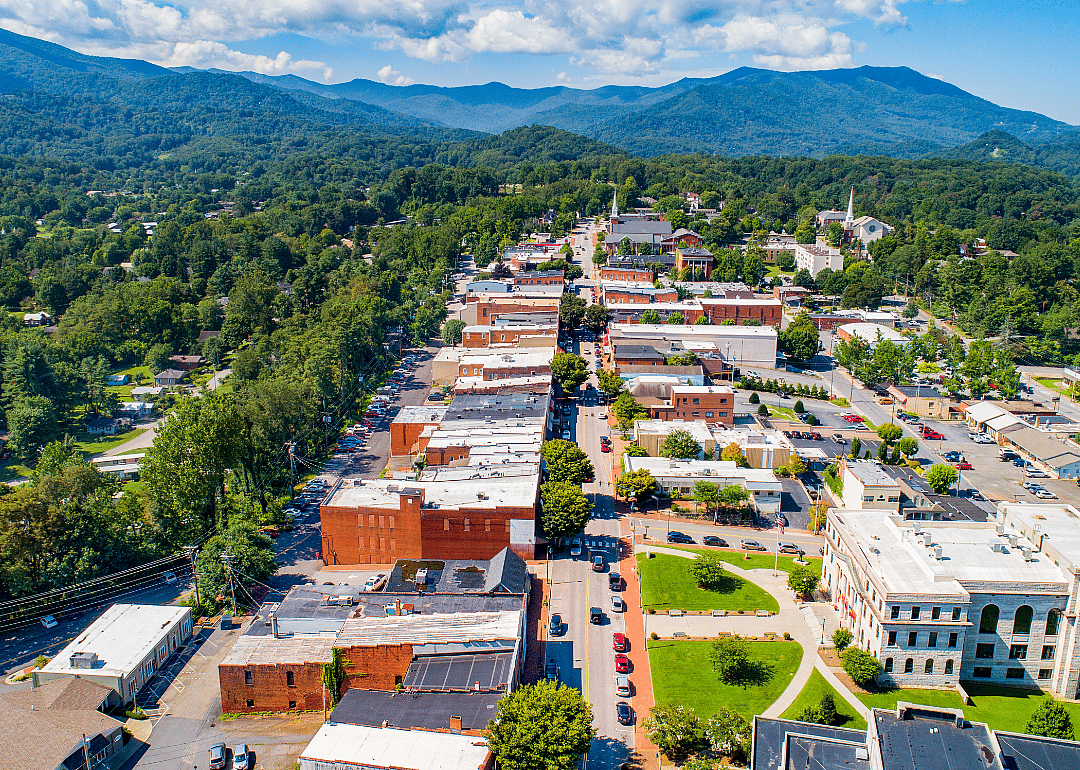
Canva
8 / 50- Total high-hazard dams: 17
- Number potentially dangerous: 4 (23.5%)
- Potentially dangerous dams include:
--- 3 in poor condition
--- 1 not rated
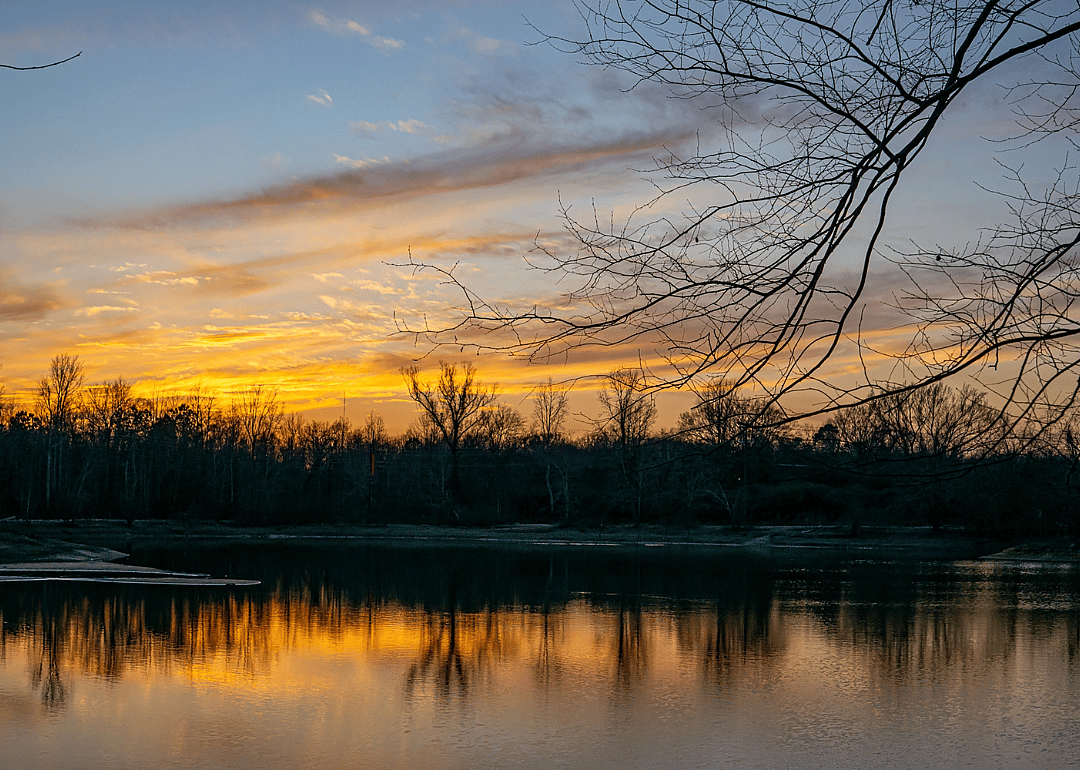
tjewell041810 // Shutterstock
9 / 50- Total high-hazard dams: 4
- Number potentially dangerous: 1 (25.0%)
- Potentially dangerous dams include:
--- 1 not rated
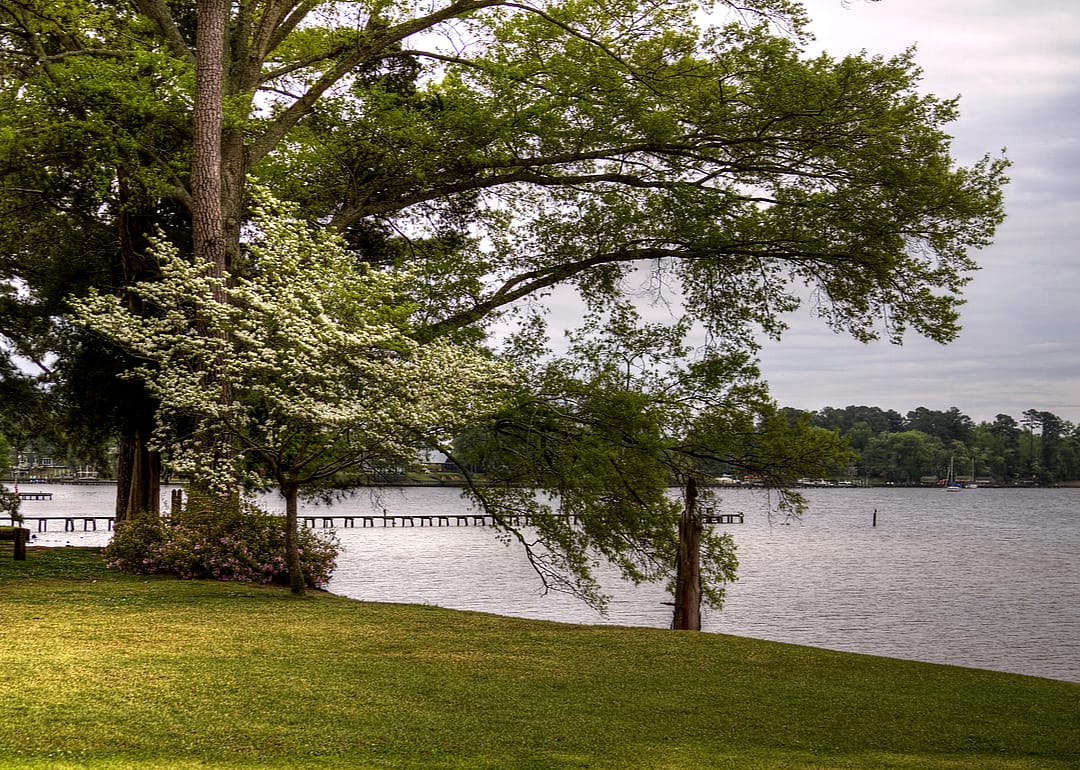
David Byron Keener // Shutterstock
10 / 50- Total high-hazard dams: 4
- Number potentially dangerous: 1 (25.0%)
- Potentially dangerous dams include:
--- 1 not rated
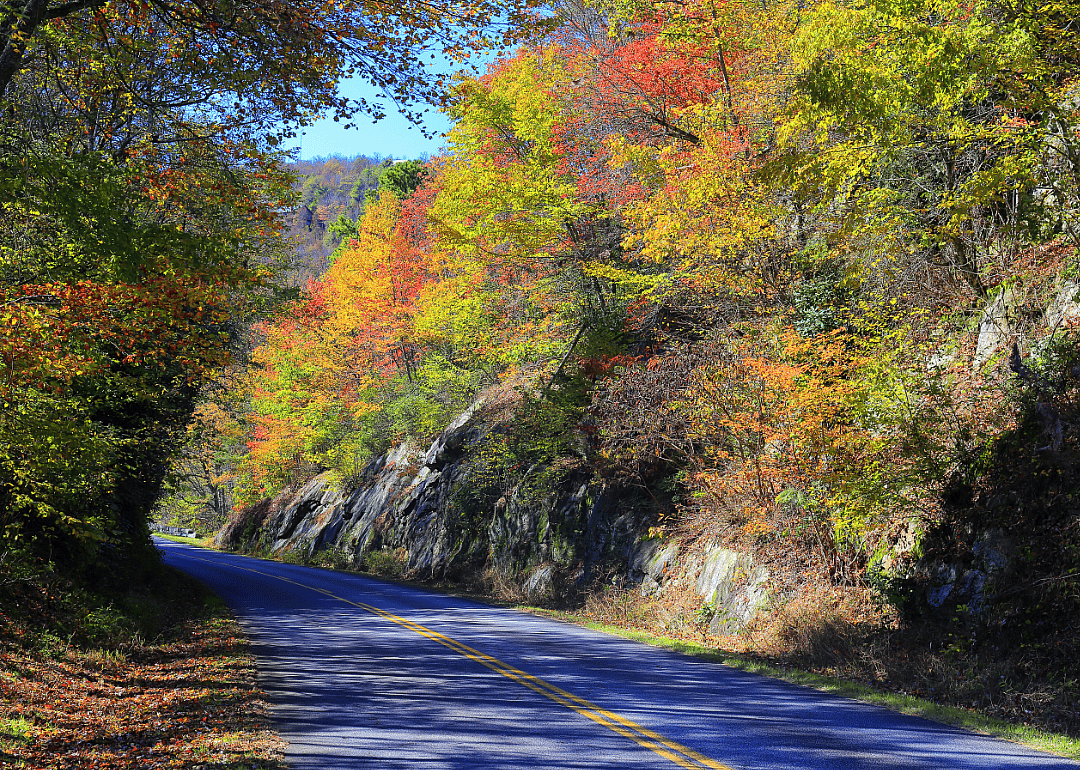
Canva
11 / 50- Total high-hazard dams: 4
- Number potentially dangerous: 1 (25.0%)
- Potentially dangerous dams include:
--- 1 in poor condition

Canva
12 / 50- Total high-hazard dams: 16
- Number potentially dangerous: 4 (25.0%)
- Potentially dangerous dams include:
--- 2 posing immediate threat
--- 2 in poor condition

KAD Photo // Shutterstock
13 / 50- Total high-hazard dams: 23
- Number potentially dangerous: 6 (26.1%)
- Potentially dangerous dams include:
--- 1 in poor condition
--- 5 condition withheld

KAD Photo // Shutterstock
14 / 50- Total high-hazard dams: 55
- Number potentially dangerous: 15 (27.3%)
- Potentially dangerous dams include:
--- 10 in poor condition
--- 5 not rated
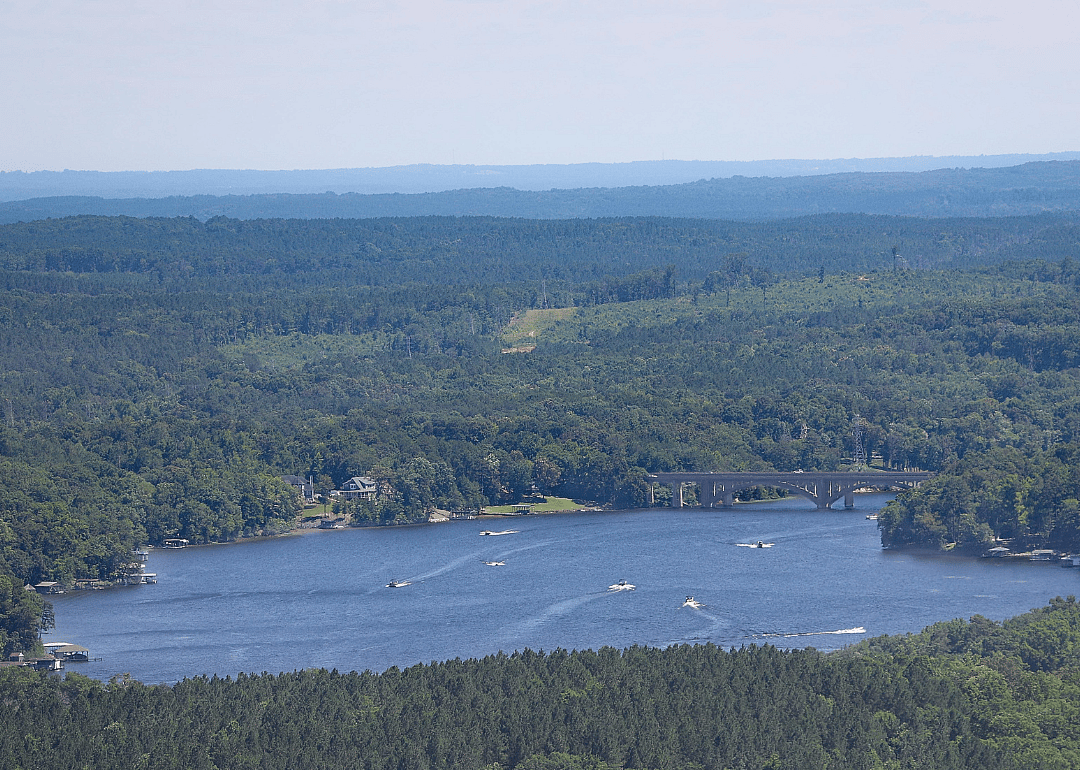
Isaiah N Lilly // Shutterstock
15 / 50- Total high-hazard dams: 18
- Number potentially dangerous: 5 (27.8%)
- Potentially dangerous dams include:
--- 1 posing immediate threat
--- 4 not rated
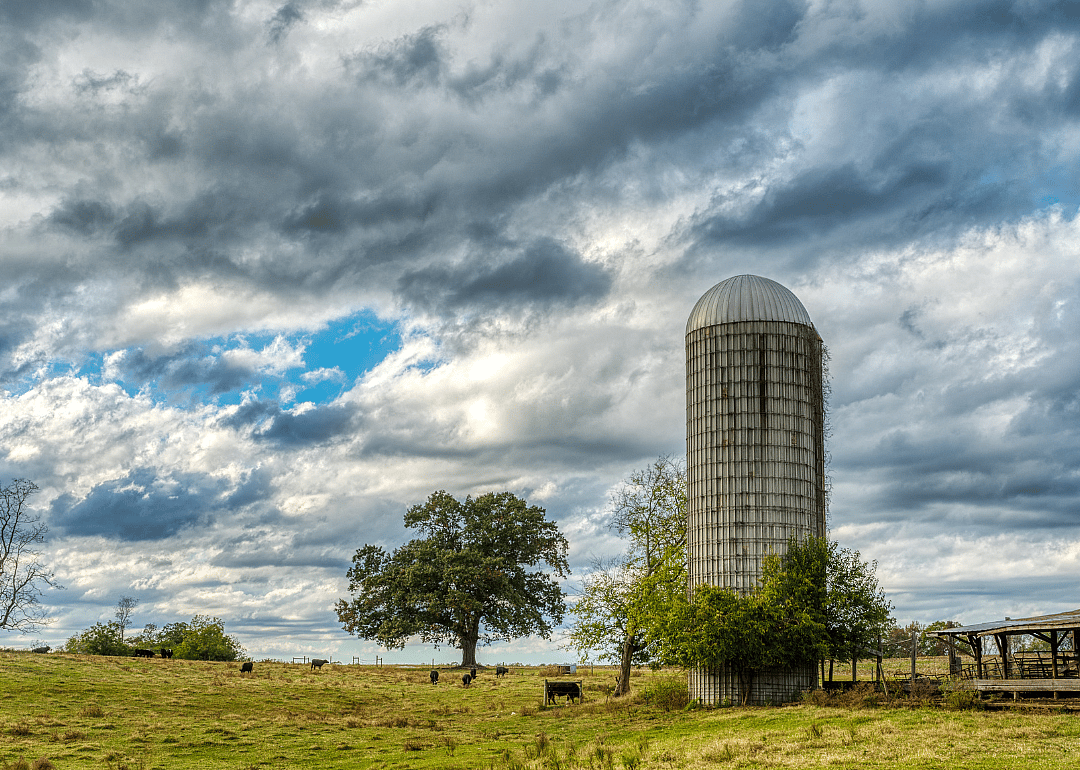
David Louis Econopouly // Shutterstock
16 / 50- Total high-hazard dams: 14
- Number potentially dangerous: 4 (28.6%)
- Potentially dangerous dams include:
--- 4 not rated

Giulia Carletti // Shutterstock
17 / 50- Total high-hazard dams: 17
- Number potentially dangerous: 5 (29.4%)
- Potentially dangerous dams include:
--- 3 in poor condition
--- 2 not rated
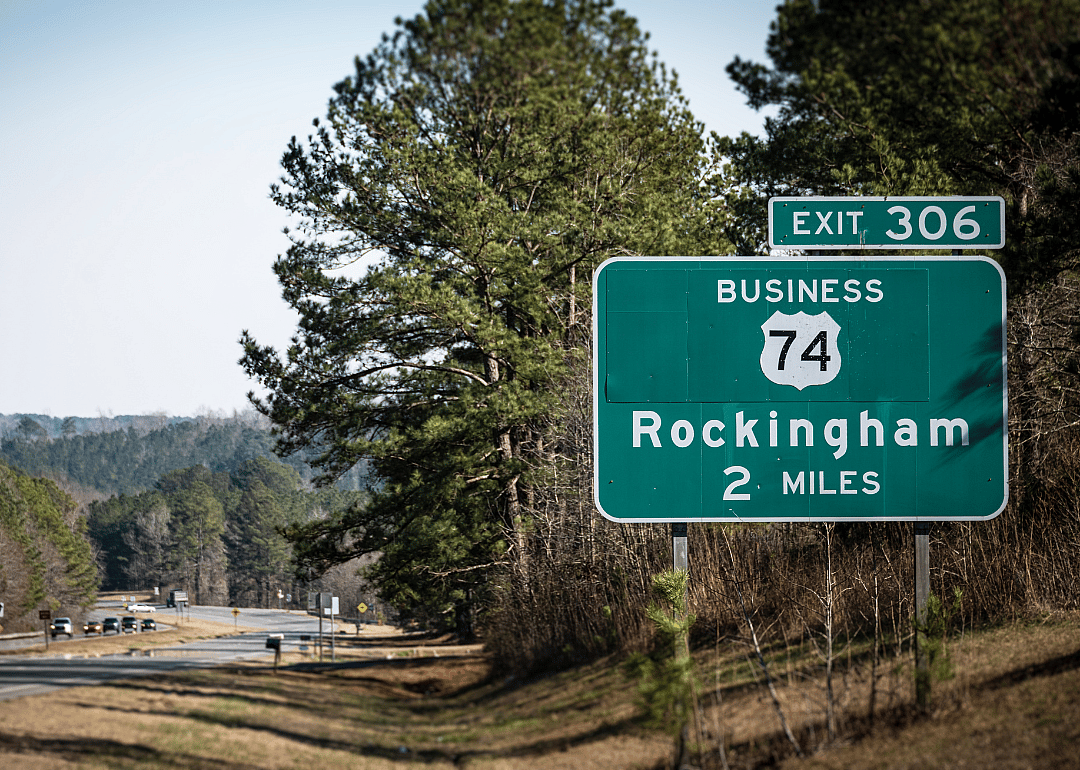
Darwin Brandis // Shutterstock
18 / 50- Total high-hazard dams: 10
- Number potentially dangerous: 3 (30.0%)
- Potentially dangerous dams include:
--- 1 in poor condition
--- 2 not rated

Nolichuckyjake // Shutterstock
19 / 50- Total high-hazard dams: 19
- Number potentially dangerous: 6 (31.6%)
- Potentially dangerous dams include:
--- 1 posing immediate threat
--- 5 in poor condition

Nikola Spasic Photography // Shutterstock
20 / 50- Total high-hazard dams: 3
- Number potentially dangerous: 1 (33.3%)
- Potentially dangerous dams include:
--- 1 posing immediate threat
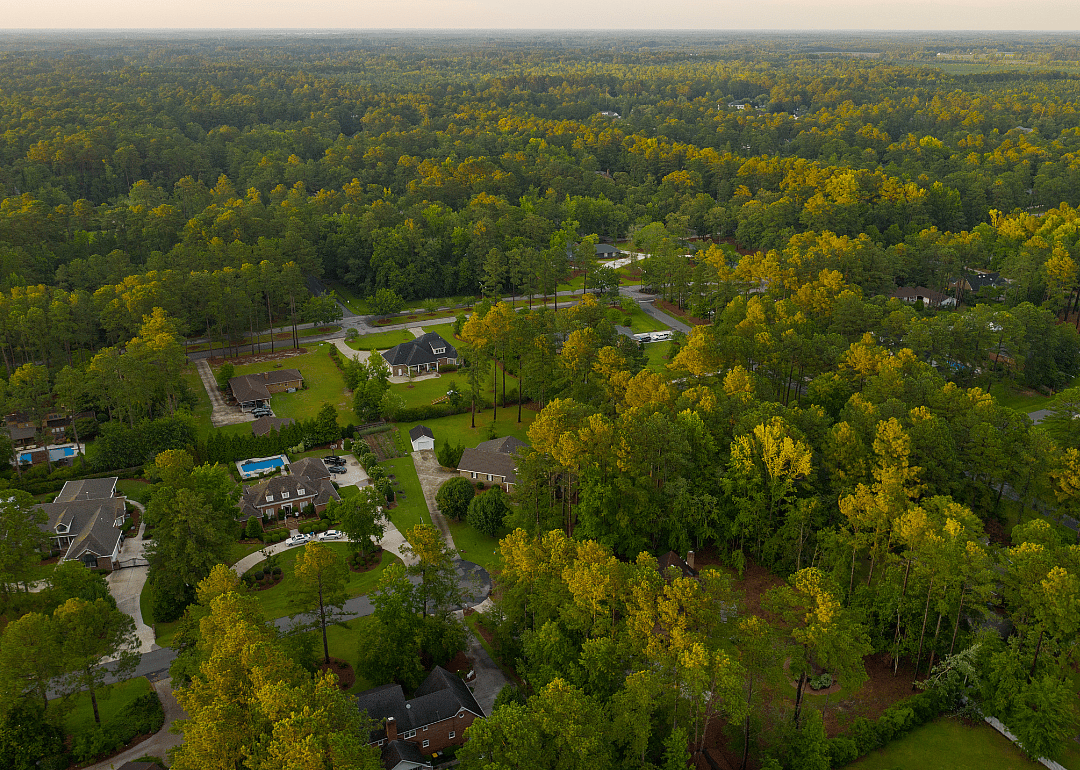
Canva
21 / 50- Total high-hazard dams: 3
- Number potentially dangerous: 1 (33.3%)
- Potentially dangerous dams include:
--- 1 not rated
Mary Terriberry // Shutterstock
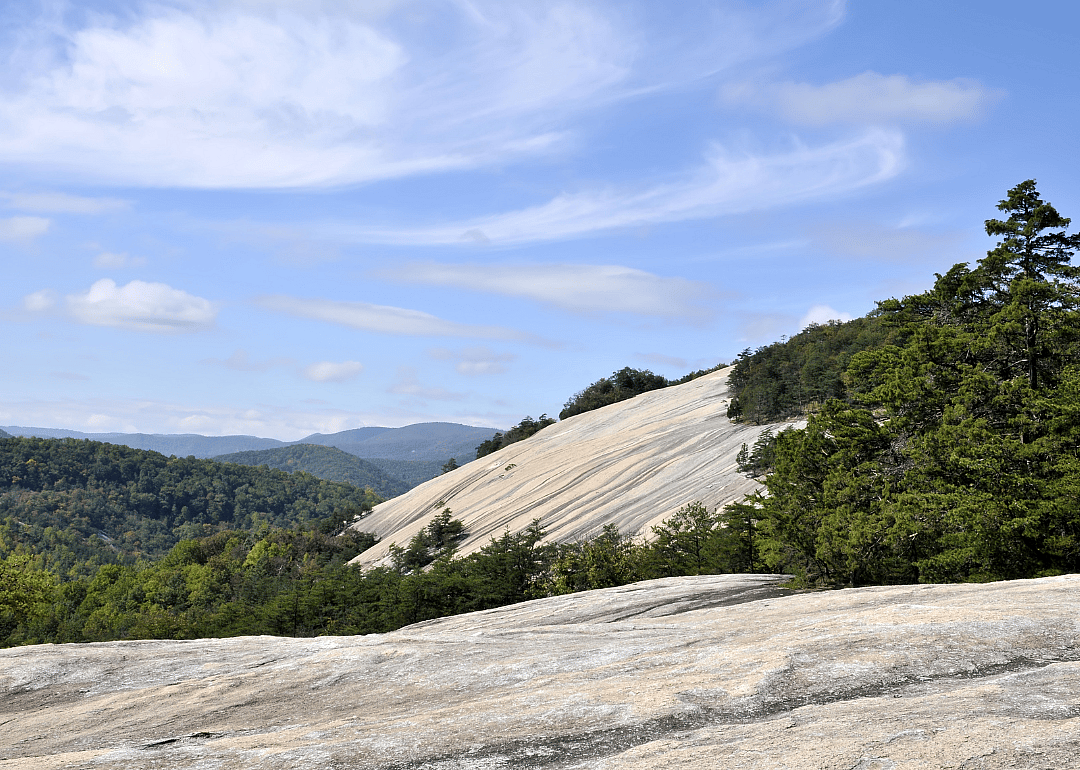
22 / 50- Total high-hazard dams: 6
- Number potentially dangerous: 2 (33.3%)
- Potentially dangerous dams include:
--- 1 in poor condition
--- 1 condition withheld

Nagel Photography // Shutterstock
23 / 50- Total high-hazard dams: 57
- Number potentially dangerous: 19 (33.3%)
- Potentially dangerous dams include:
--- 2 in poor condition
--- 17 not rated
Canva
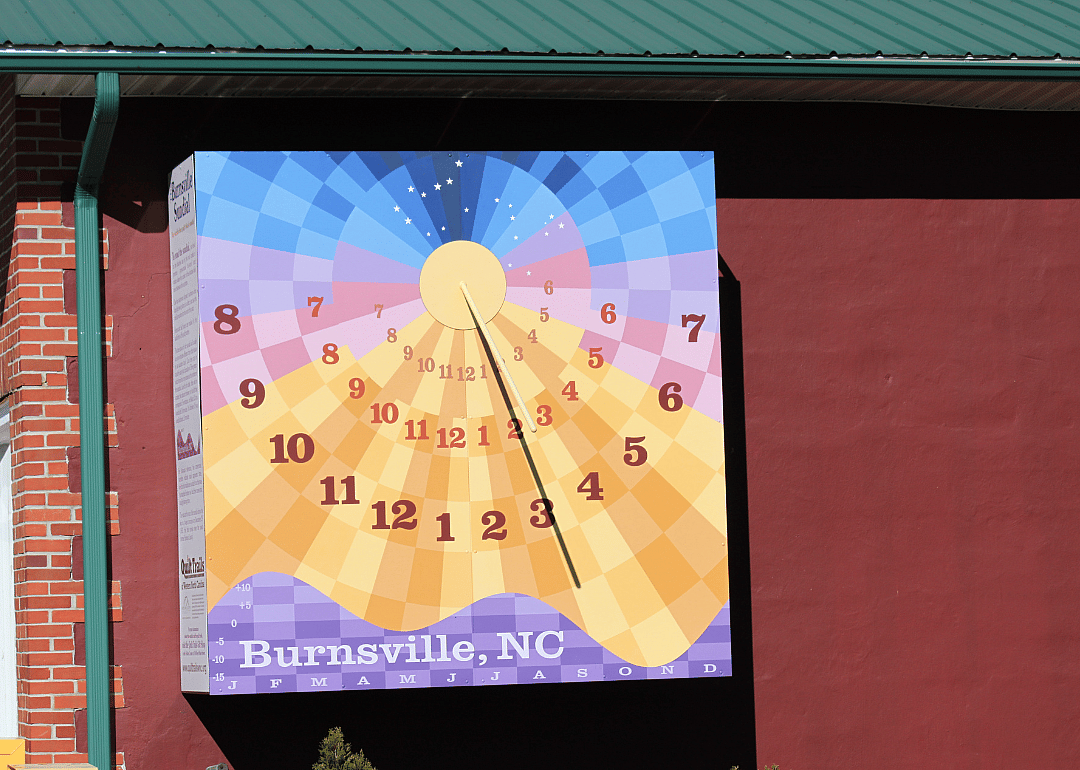
24 / 50- Total high-hazard dams: 11
- Number potentially dangerous: 4 (36.4%)
- Potentially dangerous dams include:
--- 2 posing immediate threat
--- 1 in poor condition
--- 1 condition withheld

JNix // Shutterstock
25 / 50- Total high-hazard dams: 32
- Number potentially dangerous: 12 (37.5%)
- Potentially dangerous dams include:
--- 4 posing immediate threat
--- 4 in poor condition
--- 4 not rated
Canva
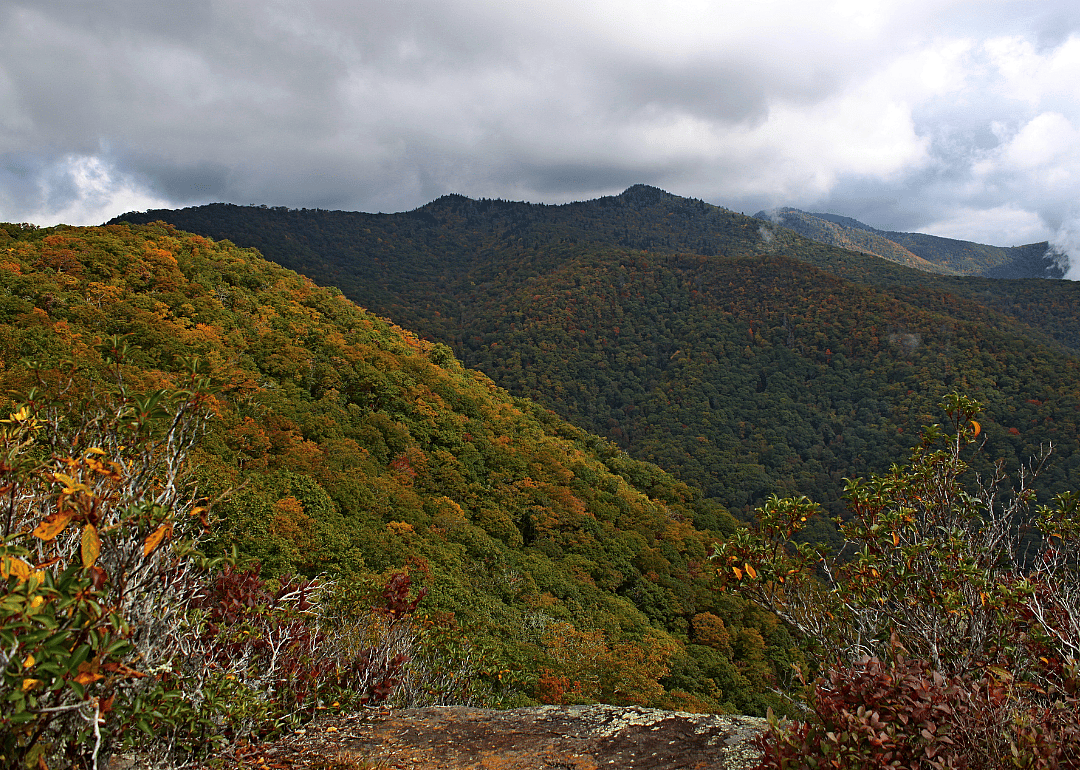
26 / 50- Total high-hazard dams: 37
- Number potentially dangerous: 14 (37.8%)
- Potentially dangerous dams include:
--- 2 posing immediate threat
--- 7 in poor condition
--- 5 not rated
Canva
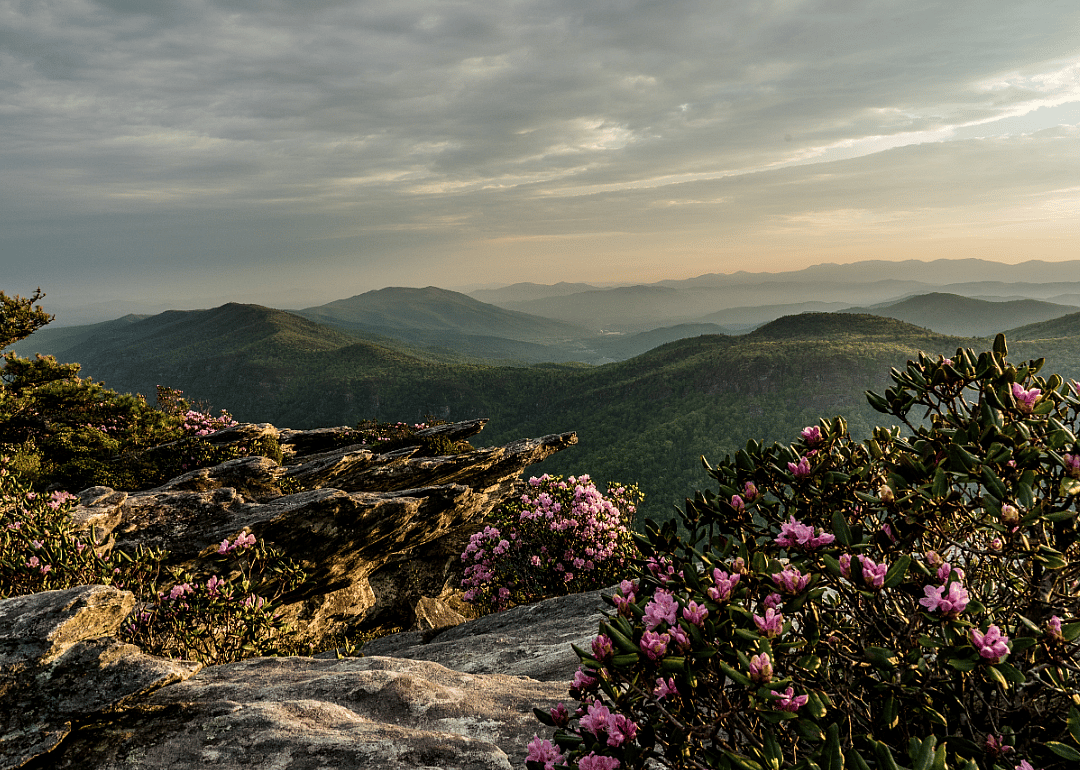
27 / 50- Total high-hazard dams: 21
- Number potentially dangerous: 8 (38.1%)
- Potentially dangerous dams include:
--- 8 not rated

Canva
28 / 50- Total high-hazard dams: 31
- Number potentially dangerous: 12 (38.7%)
- Potentially dangerous dams include:
--- 1 in poor condition
--- 11 not rated
Canva
29 / 50- Total high-hazard dams: 18
- Number potentially dangerous: 7 (38.9%)
- Potentially dangerous dams include:
--- 3 in poor condition
--- 1 not rated
--- 3 condition withheld
Kirkam // Shutterstock
30 / 50- Total high-hazard dams: 5
- Number potentially dangerous: 2 (40.0%)
- Potentially dangerous dams include:
--- 2 in poor condition
Toribio93 // Shutterstock
31 / 50- Total high-hazard dams: 10
- Number potentially dangerous: 4 (40.0%)
- Potentially dangerous dams include:
--- 3 in poor condition
--- 1 not rated
Canva
32 / 50- Total high-hazard dams: 10
- Number potentially dangerous: 4 (40.0%)
- Potentially dangerous dams include:
--- 4 in poor condition
Canva
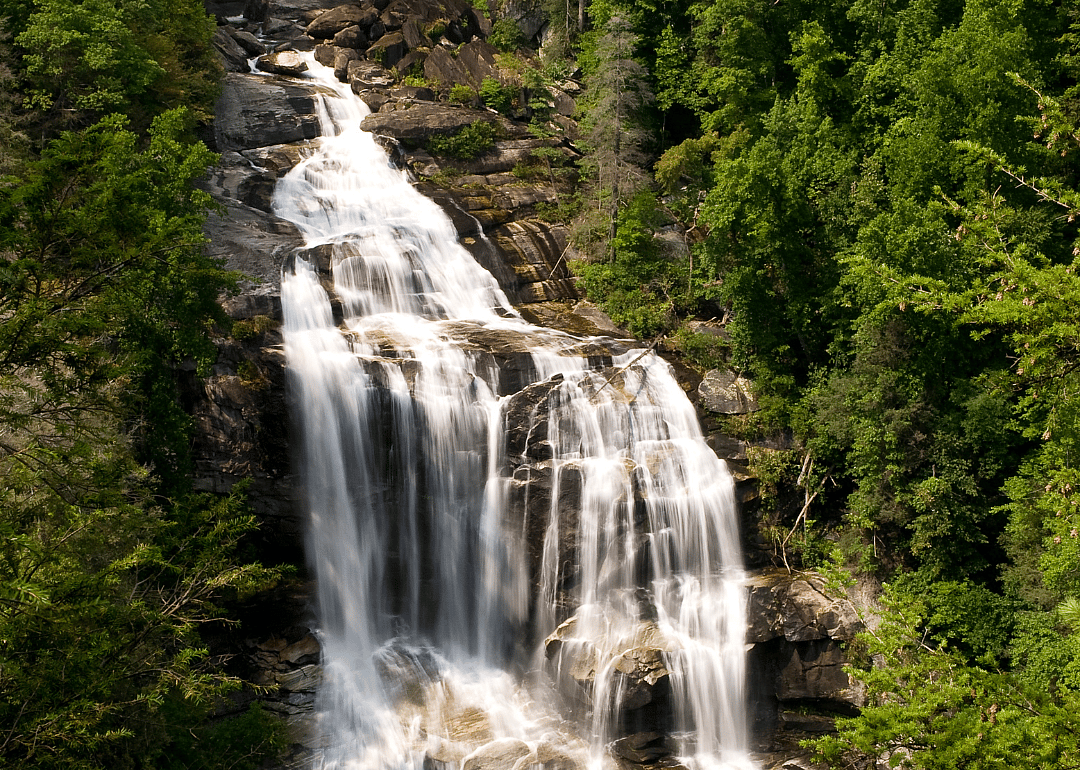
33 / 50- Total high-hazard dams: 46
- Number potentially dangerous: 19 (41.3%)
- Potentially dangerous dams include:
--- 7 posing immediate threat
--- 9 in poor condition
--- 3 not rated
Canva
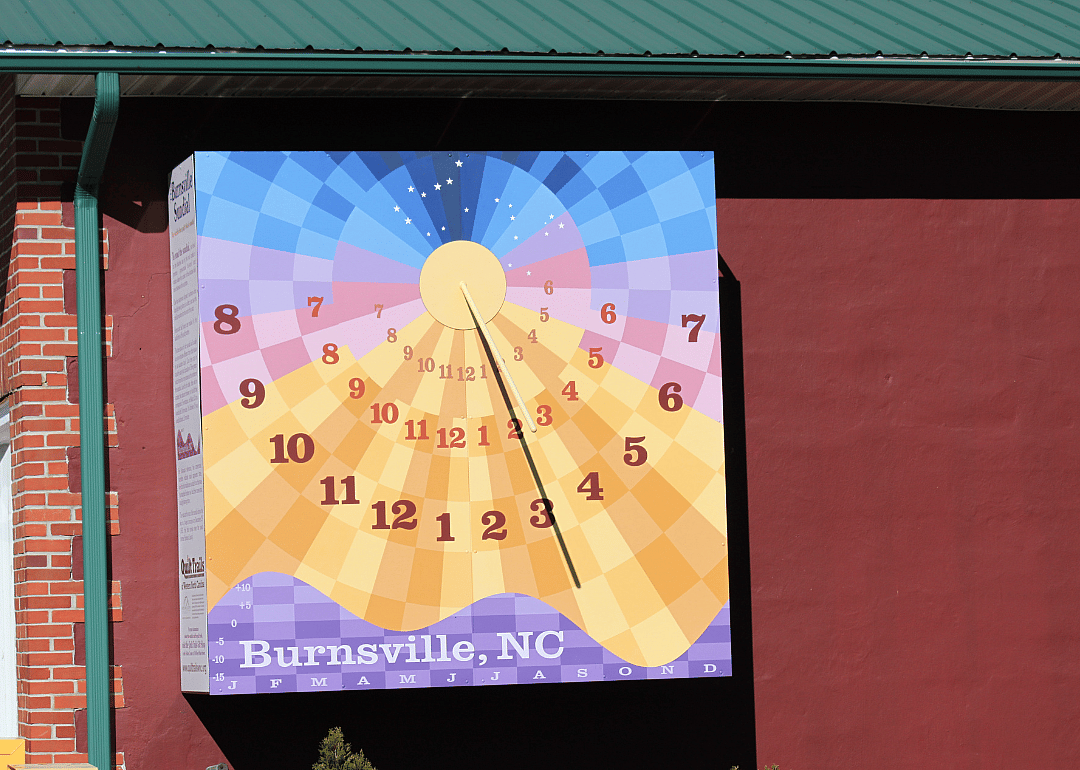
34 / 50- Total high-hazard dams: 7
- Number potentially dangerous: 3 (42.9%)
- Potentially dangerous dams include:
--- 2 in poor condition
--- 1 not rated

Canva
35 / 50- Total high-hazard dams: 46
- Number potentially dangerous: 20 (43.5%)
- Potentially dangerous dams include:
--- 5 posing immediate threat
--- 4 in poor condition
--- 11 not rated

Canva
36 / 50- Total high-hazard dams: 11
- Number potentially dangerous: 5 (45.5%)
- Potentially dangerous dams include:
--- 1 posing immediate threat
--- 3 in poor condition
--- 1 not rated
Wileydoc // Shutterstock
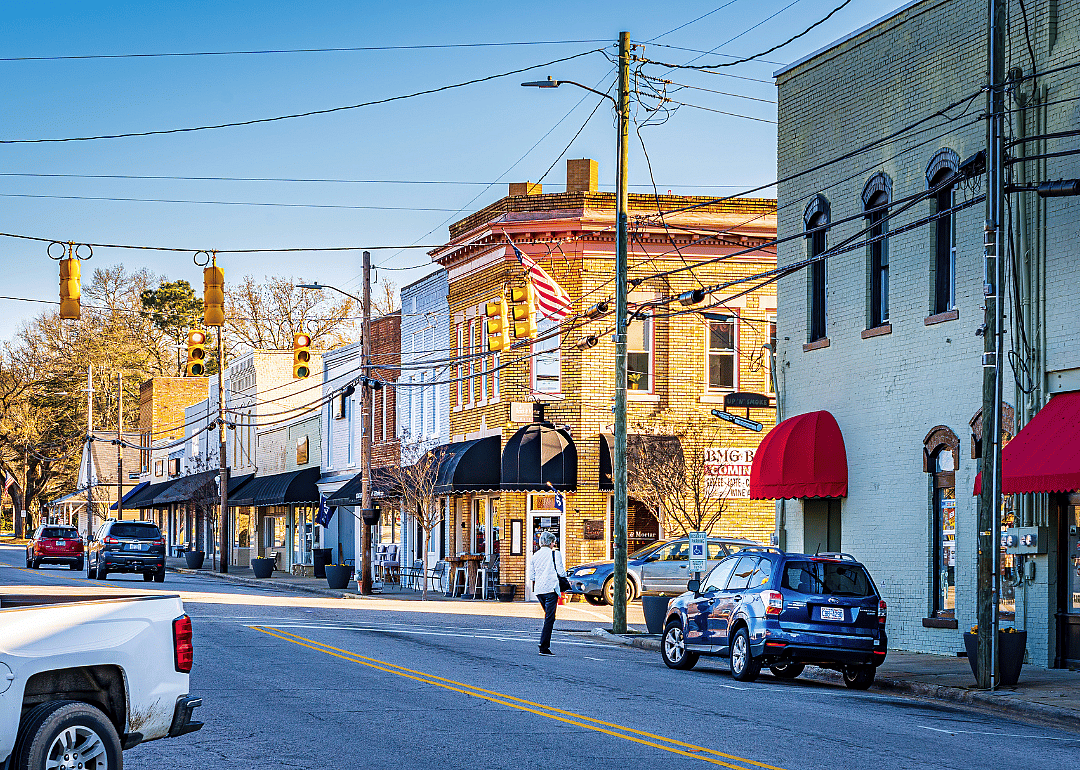
37 / 50- Total high-hazard dams: 28
- Number potentially dangerous: 13 (46.4%)
- Potentially dangerous dams include:
--- 2 posing immediate threat
--- 6 in poor condition
--- 5 not rated
iofoto // Shutterstock
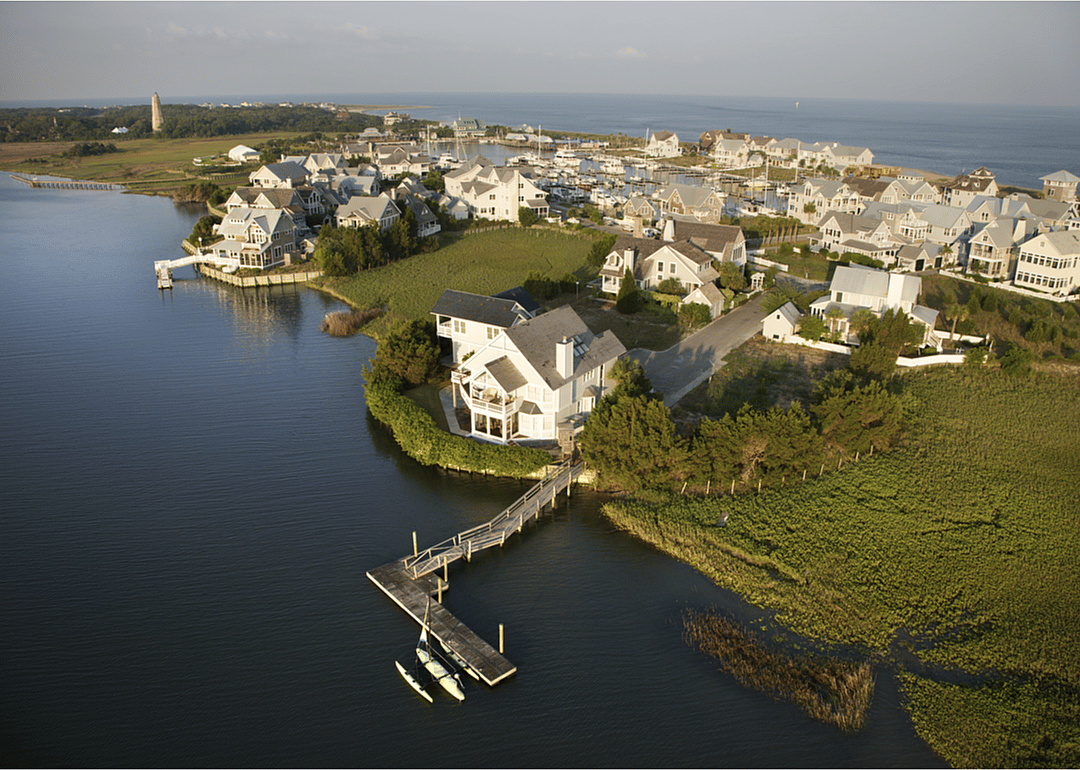
38 / 50- Total high-hazard dams: 4
- Number potentially dangerous: 2 (50.0%)
- Potentially dangerous dams include:
--- 2 not rated
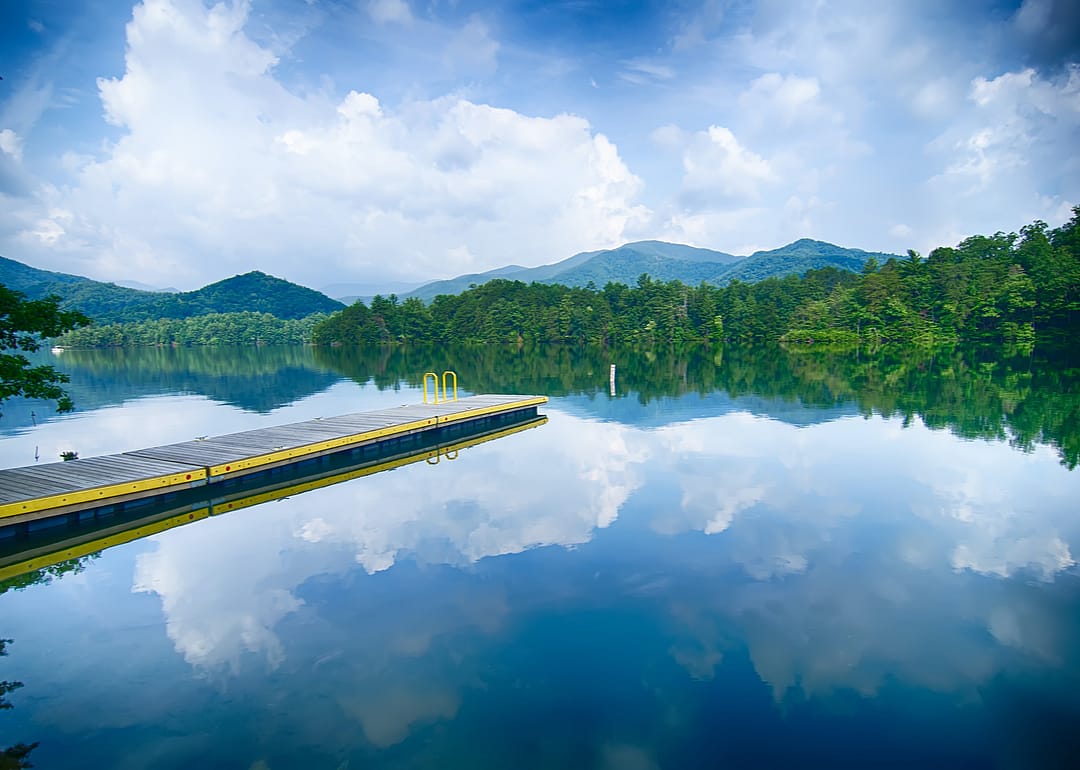
digidreamgrafix // Shutterstock
39 / 50- Total high-hazard dams: 6
- Number potentially dangerous: 3 (50.0%)
- Potentially dangerous dams include:
--- 2 in poor condition
--- 1 condition withheld
Canva
40 / 50- Total high-hazard dams: 9
- Number potentially dangerous: 5 (55.6%)
- Potentially dangerous dams include:
--- 3 in poor condition
--- 2 not rated

Canva
41 / 50- Total high-hazard dams: 9
- Number potentially dangerous: 5 (55.6%)
- Potentially dangerous dams include:
--- 5 in poor condition
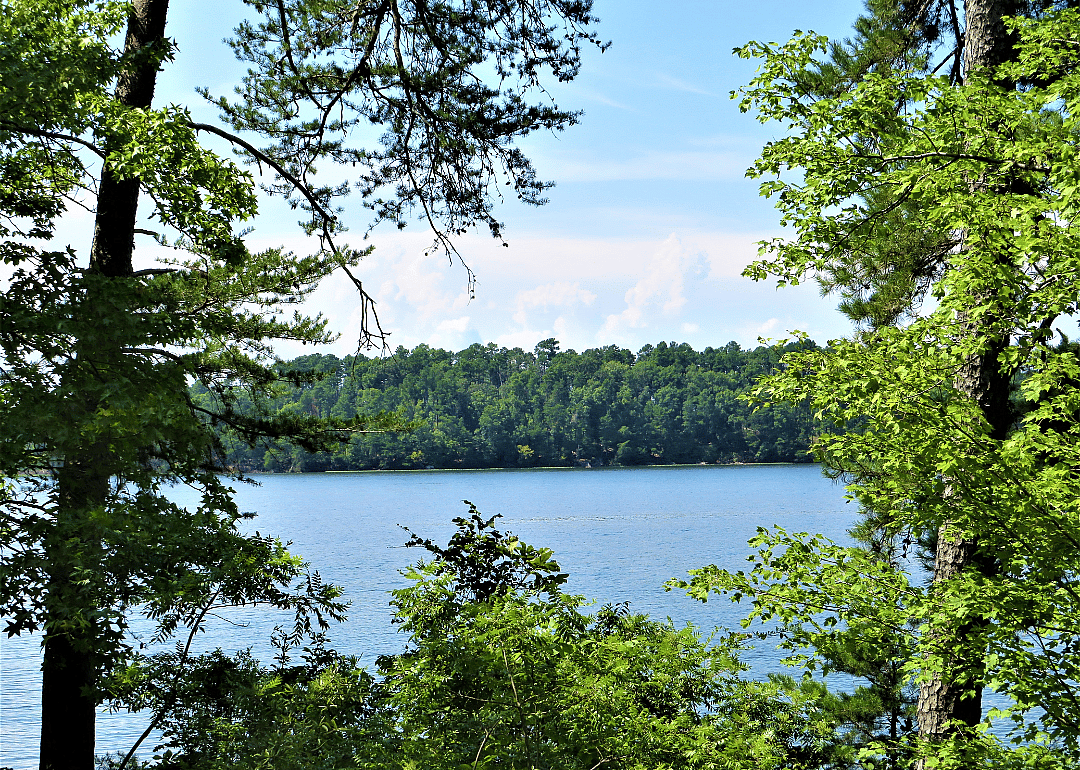
Noemia Poole // Shutterstock
42 / 50- Total high-hazard dams: 3
- Number potentially dangerous: 2 (66.7%)
- Potentially dangerous dams include:
--- 2 in poor condition
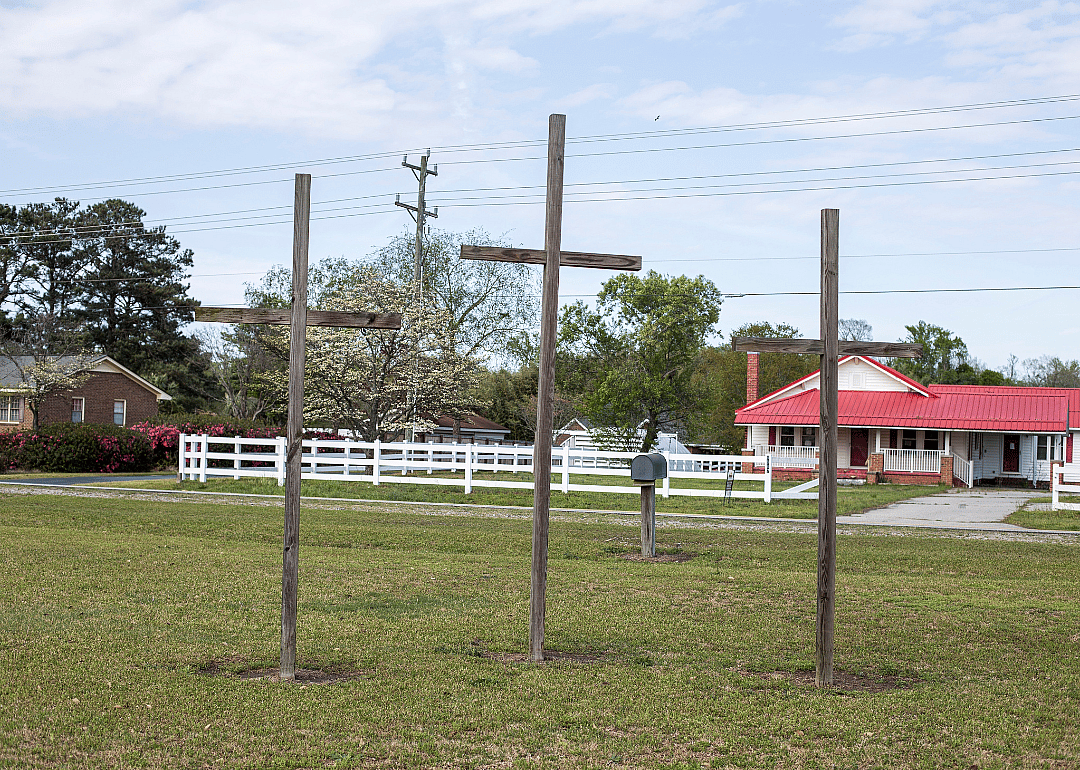
Ruth McNeill Photography // Shutterstock
43 / 50- Total high-hazard dams: 6
- Number potentially dangerous: 4 (66.7%)
- Potentially dangerous dams include:
--- 3 in poor condition
--- 1 not rated
Canva
44 / 50- Total high-hazard dams: 9
- Number potentially dangerous: 6 (66.7%)
- Potentially dangerous dams include:
--- 5 in poor condition
--- 1 not rated

Nolichuckyjake // Shutterstock
45 / 50- Total high-hazard dams: 17
- Number potentially dangerous: 12 (70.6%)
- Potentially dangerous dams include:
--- 4 posing immediate threat
--- 4 in poor condition
--- 4 not rated
Canva
46 / 50- Total high-hazard dams: 7
- Number potentially dangerous: 5 (71.4%)
- Potentially dangerous dams include:
--- 2 posing immediate threat
--- 3 not rated
James R Poston // Shutterstock
47 / 50- Total high-hazard dams: 11
- Number potentially dangerous: 8 (72.7%)
- Potentially dangerous dams include:
--- 1 posing immediate threat
--- 5 in poor condition
--- 2 condition withheld
George Dukin // Shutterstock
48 / 50- Total high-hazard dams: 5
- Number potentially dangerous: 4 (80.0%)
- Potentially dangerous dams include:
--- 4 condition withheld
Canva
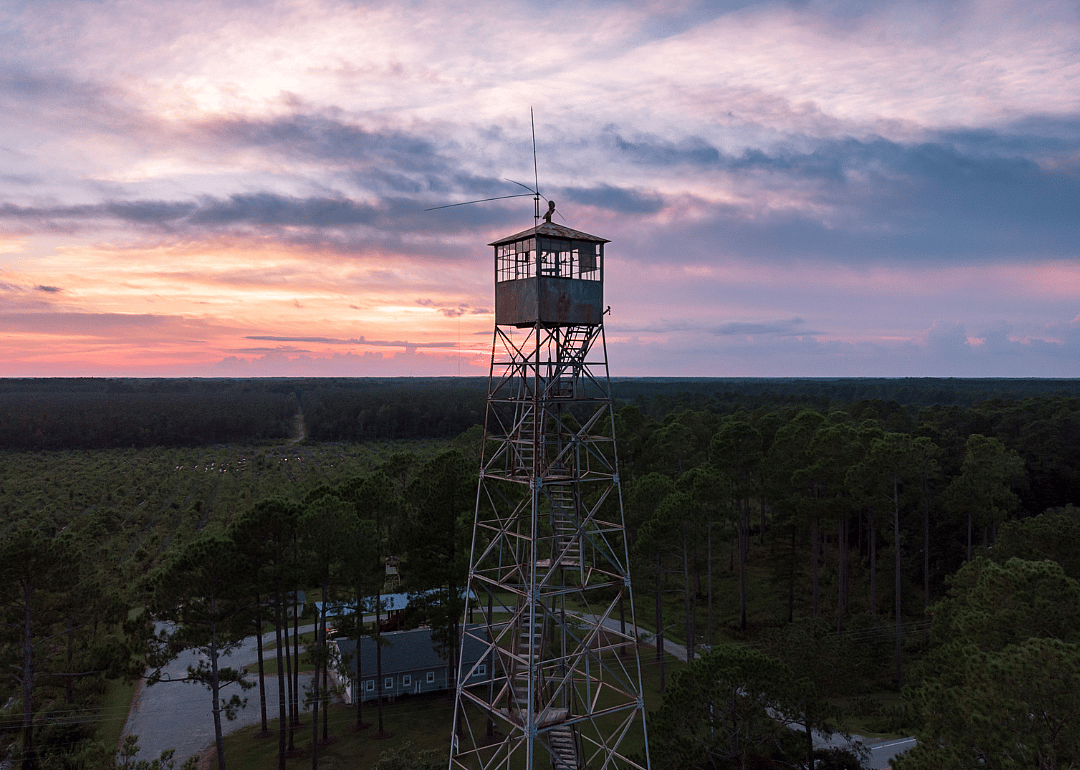
49 / 50- Total high-hazard dams: 1
- Number potentially dangerous: 1 (100.0%)
- Potentially dangerous dams include:
--- 1 posing immediate threat
Chansak Joe // Shutterstock
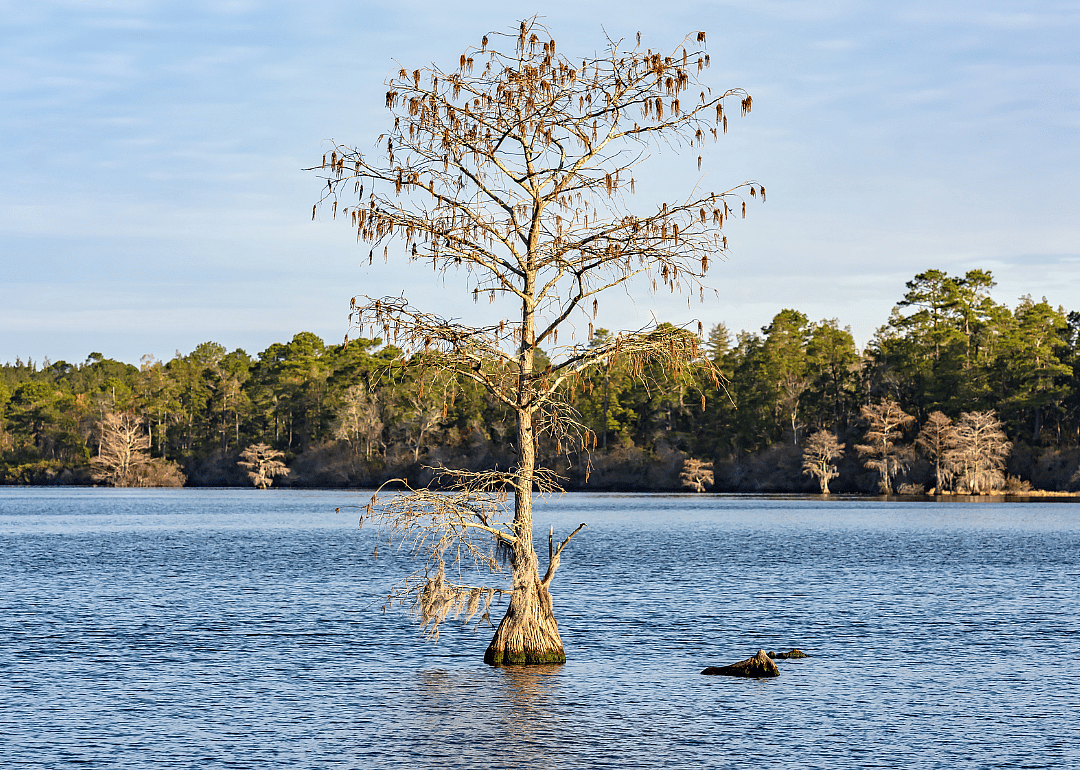
50 / 50- Total high-hazard dams: 2
- Number potentially dangerous: 2 (100.0%)
- Potentially dangerous dams include:
--- 1 in poor condition
--- 1 not rated
This story features data reporting by Paxtyn Merten, writing by Dom DiFurio, and is part of a series utilizing data automation across 50 states.