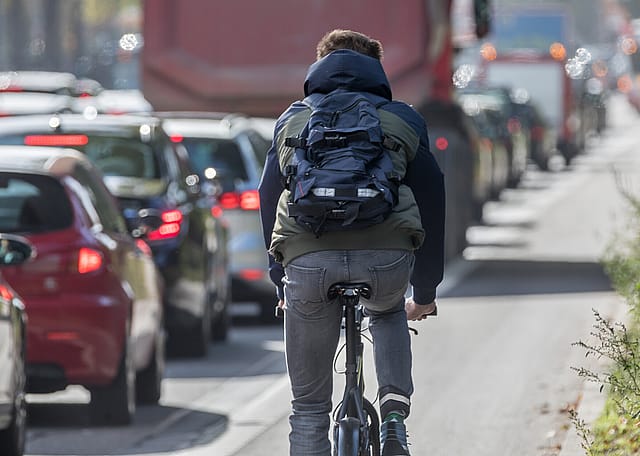
Stacker compiled a list of the counties with the best commutes in North Dakota using data from the U.S. Census Bureau. Counties are ranked by the shortest average travel time to work, with ties broken by lowest percent of residents that commute over 60 minutes, and any further ties broken by lowest percent of residents that work outside the county of residence.
You may also like: Best private colleges in North Dakota
Andrew Filer // Wikimedia Commons
1 / 53#53. Renville County
- Mean travel time to work: 37.9
- Workers with 60+ minute commute: 20.9%
- Worked outside of county of residence: 47.9%
Publichall // Wikimedia Commons
2 / 53#52. McHenry County
- Mean travel time to work: 26.8
- Workers with 60+ minute commute: 9.6%
- Worked outside of county of residence: 44.2%
northlight // Shutterstock
3 / 53#51. Kidder County
- Mean travel time to work: 25.4
- Workers with 60+ minute commute: 6.5%
- Worked outside of county of residence: 33.8%
Andrew Filer // Wikimedia Commons
4 / 53#50. Burke County
- Mean travel time to work: 24.8
- Workers with 60+ minute commute: 9.7%
- Worked outside of county of residence: 33.1%
Andrew Filer // Wikimedia Commons
5 / 53#49. Golden Valley County
Randall Runtsch // Shutterstock
6 / 53#48. Billings County
- Mean travel time to work: 23.9
- Workers with 60+ minute commute: 6.2%
- Worked outside of county of residence: 52.5%
Andrew Filer // Wikimedia Commons
7 / 53#47. Sheridan County
- Mean travel time to work: 23.8
- Workers with 60+ minute commute: 12.7%
- Worked outside of county of residence: 36.0%
Andrew Filer // Wikimedia Commons
8 / 53#46. Dunn County
- Mean travel time to work: 23.6
- Workers with 60+ minute commute: 7.6%
- Worked outside of county of residence: 24.7%
David Becker // Wikimedia Commons
9 / 53#45. Oliver County
- Mean travel time to work: 23.0
- Workers with 60+ minute commute: 6.2%
- Worked outside of county of residence: 45.8%
JERRYE & ROY KLOTZ MD // Wikimedia Commons
10 / 53Andrew Filer // Wikimedia Commons
11 / 53#43. Ransom County
- Mean travel time to work: 21.9
- Workers with 60+ minute commute: 6.4%
- Worked outside of county of residence: 28.3%
Andrew Filer // Wikimedia Commons
12 / 53#42. Grant County
- Mean travel time to work: 19.8
- Workers with 60+ minute commute: 11.6%
- Worked outside of county of residence: 17.5%
USFWS Mountain-Prairie // Wikimedia Common
13 / 53#41. Dickey County
- Mean travel time to work: 19.8
- Workers with 60+ minute commute: 6.5%
- Worked outside of county of residence: 20.2%
Andrew Filer from Seattle (ex-Minneapolis) // Wikimedia Commons
14 / 53#40. Traill County
- Mean travel time to work: 19.8
- Workers with 60+ minute commute: 6.2%
- Worked outside of county of residence: 23.8%
Xerxes2004 // Wikimedia Commons
15 / 53w:User:Malepheasant // Wikimedia Commons
16 / 53#38. Richland County
- Mean travel time to work: 19.7
- Workers with 60+ minute commute: 5.6%
- Worked outside of county of residence: 17.7%
Bjr97543 // Wikimedia Commons
17 / 53#37. Slope County
- Mean travel time to work: 19.4
- Workers with 60+ minute commute: 5.0%
- Worked outside of county of residence: 40.2%
Bob Pool // Shutterstock
18 / 53#36. Morton County
- Mean travel time to work: 19.4
- Workers with 60+ minute commute: 4.3%
- Worked outside of county of residence: 55.0%
Andrew Filer from Seattle (ex-Minneapolis) // Wikimedia Commons
19 / 53#35. Mountrail County
- Mean travel time to work: 19.1
- Workers with 60+ minute commute: 6.8%
- Worked outside of county of residence: 22.2%
Yosoyana // Shutterstock
20 / 53Andrew Filer // Wikimedia Commons
21 / 53#33. LaMoure County
- Mean travel time to work: 18.4
- Workers with 60+ minute commute: 5.1%
- Worked outside of county of residence: 20.9%
USFWS Mountain-Prairie // Wikimedia Common
22 / 53#32. Bottineau County
- Mean travel time to work: 18.3
- Workers with 60+ minute commute: 6.1%
- Worked outside of county of residence: 20.9%
Andrew Filer // Wikimedia Commons
23 / 53#31. Emmons County
- Mean travel time to work: 18.2
- Workers with 60+ minute commute: 7.2%
- Worked outside of county of residence: 13.8%
Andrew Filer // Wikimedia Commons
24 / 53#30. Nelson County
- Mean travel time to work: 18.2
- Workers with 60+ minute commute: 5.3%
- Worked outside of county of residence: 23.7%
DakotaDocMartin // Wikimedia Commons
25 / 53Joseph Sohm // Shutterstock
26 / 53#28. Burleigh County
- Mean travel time to work: 17.8
- Workers with 60+ minute commute: 4.3%
- Worked outside of county of residence: 13.2%
chief_huddleston // Wikimedia Commons
27 / 53#27. Barnes County
- Mean travel time to work: 17.7
- Workers with 60+ minute commute: 5.2%
- Worked outside of county of residence: 19.1%
Andrew Filer // Wikimedia Commons
28 / 53#26. Mercer County
- Mean travel time to work: 17.6
- Workers with 60+ minute commute: 5.7%
- Worked outside of county of residence: 13.6%
Andrew Filer // Wikimedia Commons
29 / 53#25. Walsh County
- Mean travel time to work: 17.4
- Workers with 60+ minute commute: 4.4%
- Worked outside of county of residence: 14.8%
Guy William // Shutterstock
30 / 53{{{1}}} // Wikimedia Commons
31 / 53#23. Wells County
- Mean travel time to work: 17.1
- Workers with 60+ minute commute: 3.8%
- Worked outside of county of residence: 12.3%
Andrew Filer // Wikimedia Commons
32 / 53#22. Towner County
- Mean travel time to work: 17.0
- Workers with 60+ minute commute: 4.4%
- Worked outside of county of residence: 18.3%
Andrew Filer // Wikimedia Commons
33 / 53#21. Hettinger County
- Mean travel time to work: 17.0
- Workers with 60+ minute commute: 3.8%
- Worked outside of county of residence: 23.9%
Andrew Filer // Wikimedia Commons
34 / 53#20. Eddy County
- Mean travel time to work: 16.8
- Workers with 60+ minute commute: 5.7%
- Worked outside of county of residence: 29.8%
JERRYE & ROY KLOTZ MD // Wikimedia Commons
35 / 53Cavan-Images // Shutterstock
36 / 53#18. Stark County
- Mean travel time to work: 16.6
- Workers with 60+ minute commute: 4.7%
- Worked outside of county of residence: 8.0%
Andrew Filer // Wikimedia Commons
37 / 53#17. Divide County
- Mean travel time to work: 16.5
- Workers with 60+ minute commute: 9.1%
- Worked outside of county of residence: 9.2%
JERRYE & ROY KLOTZ MD // Wikimedia Commons
38 / 53#16. Williams County
- Mean travel time to work: 16.3
- Workers with 60+ minute commute: 3.7%
- Worked outside of county of residence: 3.3%
Andrew Filer // Wikimedia Commons
39 / 53#15. Sioux County
- Mean travel time to work: 16.2
- Workers with 60+ minute commute: 3.7%
- Worked outside of county of residence: 3.5%
Andrew Filer // Wikimedia Commons
40 / 53Andrew Filer // Wikimedia Commons
41 / 53#13. Adams County
- Mean travel time to work: 15.7
- Workers with 60+ minute commute: 5.6%
- Worked outside of county of residence: 11.4%
Andrew Filer // Wikimedia Commons
42 / 53#12. Griggs County
- Mean travel time to work: 15.7
- Workers with 60+ minute commute: 3.3%
- Worked outside of county of residence: 16.4%
Andrew Filer // Wikimedia Commons
43 / 53#11. Rolette County
- Mean travel time to work: 15.7
- Workers with 60+ minute commute: 2.0%
- Worked outside of county of residence: 9.0%
Andrew Filer // Wikimedia Commons
44 / 53#10. Benson County
- Mean travel time to work: 15.6
- Workers with 60+ minute commute: 1.0%
- Worked outside of county of residence: 25.7%
Andrew Filer // Wikimedia Commons
45 / 53#9. Bowman County
- Mean travel time to work: 15.3
- Workers with 60+ minute commute: 5.5%
- Worked outside of county of residence: 7.6%
You may also like: Best colleges in North Dakota
Jacob Boomsma // Shutterstock
46 / 53#8. Grand Forks County
- Mean travel time to work: 15.1
- Workers with 60+ minute commute: 2.8%
- Worked outside of county of residence: 2.9%
Calvin Beale // Wikimedia Commons
47 / 53#7. Steele County
- Mean travel time to work: 15.0
- Workers with 60+ minute commute: 3.9%
- Worked outside of county of residence: 34.3%
Andrew Filer // Wikimedia Commons
48 / 53#6. Cavalier County
- Mean travel time to work: 15.0
- Workers with 60+ minute commute: 3.6%
- Worked outside of county of residence: 10.7%
Acroterion // Wikimedia Commons
49 / 53#5. Stutsman County
- Mean travel time to work: 14.8
- Workers with 60+ minute commute: 3.5%
- Worked outside of county of residence: 6.4%
Andrew Filer // Wikimedia Commons
50 / 53Jerry Huddleston // Wikimedia Commons
51 / 53#3. Logan County
- Mean travel time to work: 13.5
- Workers with 60+ minute commute: 2.3%
- Worked outside of county of residence: 16.8%
Matt // Wikimedia Commons
52 / 53#2. Foster County
- Mean travel time to work: 12.3
- Workers with 60+ minute commute: 2.8%
- Worked outside of county of residence: 16.0%
Andrew Filer // Wikimedia Commons
53 / 53#1. McIntosh County
- Mean travel time to work: 11.1
- Workers with 60+ minute commute: 0.7%
- Worked outside of county of residence: 5.9%