Several factors contribute to cancer rates, from personal habits and genetics to air pollution or groundwater quality in a given area. People experiencing social, economic, or environmental disadvantages are disproportionately affected by high cancer rates in certain regions—including access or barriers to early screening and care.
Cancer rates also fluctuate by jobs: Higher rates of cancer can be found among meat industry and rubber manufacturing workers, and farmers.
Stacker compiled the counties with the highest cancer rates in Ohio using data from the CDC. Keep reading to see where in your state cancer cases are the most common.
You may also like: The most popular grocery items for Christmas in Ohio, according to Instacart
#50. Scioto County
- Cancer rate per 100,000, 2016-2020: 622.2
- Age-adjusted rate per 100,000, 2016-2020: 474.4
BLAZE Pro // Shutterstock
2 / 50#49. Tuscarawas County
- Cancer rate per 100,000, 2016-2020: 623.4
- Age-adjusted rate per 100,000, 2016-2020: 456.2
JNix // Shutterstock
3 / 50#48. Perry County
- Cancer rate per 100,000, 2016-2020: 623.7
- Age-adjusted rate per 100,000, 2016-2020: 484.5
#47. Mahoning County
- Cancer rate per 100,000, 2016-2020: 625.1
- Age-adjusted rate per 100,000, 2016-2020: 427.2
BLAZE Pro // Shutterstock
5 / 50Roberto Galan // Shutterstock
6 / 50#45. Defiance County
- Cancer rate per 100,000, 2016-2020: 628.0
- Age-adjusted rate per 100,000, 2016-2020: 467.5
#44. Fayette County
- Cancer rate per 100,000, 2016-2020: 630.6
- Age-adjusted rate per 100,000, 2016-2020: 488.8
#43. Montgomery County
- Cancer rate per 100,000, 2016-2020: 631.5
- Age-adjusted rate per 100,000, 2016-2020: 486.8
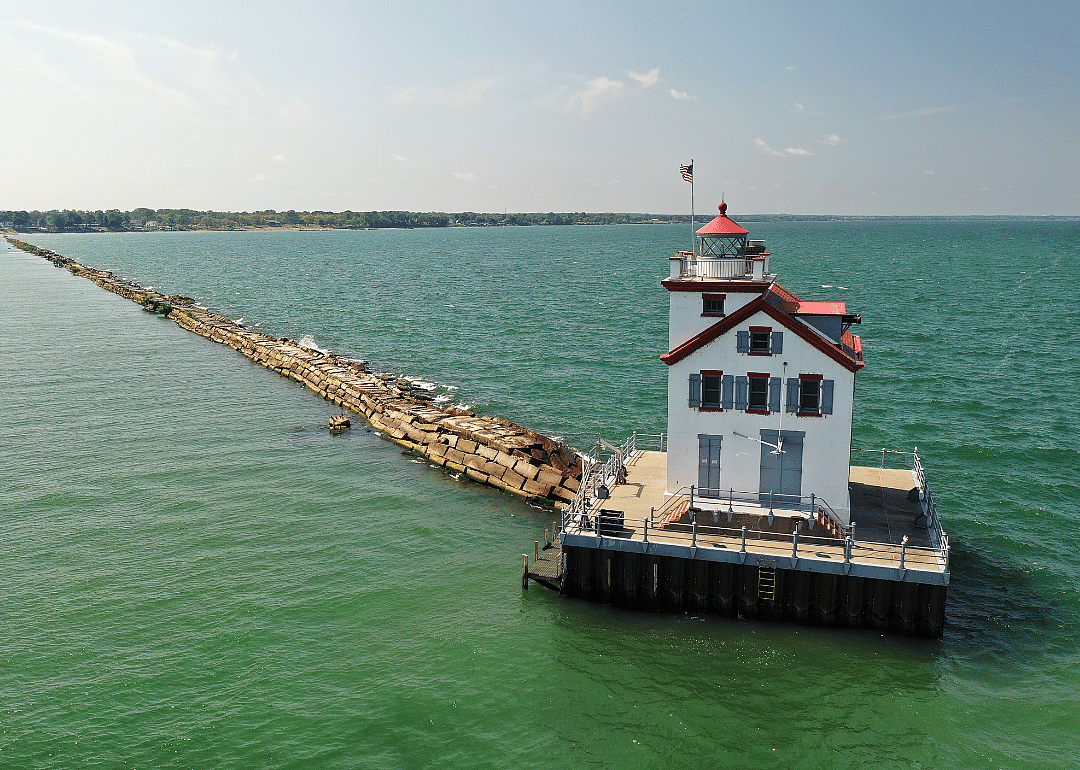
Lake Front Drones // Shutterstock
9 / 50#42. Lorain County
- Cancer rate per 100,000, 2016-2020: 635.1
- Age-adjusted rate per 100,000, 2016-2020: 477.9
#40. Trumbull County
- Cancer rate per 100,000, 2016-2020: 635.5
- Age-adjusted rate per 100,000, 2016-2020: 430.7
#39. Cuyahoga County
- Cancer rate per 100,000, 2016-2020: 635.8
- Age-adjusted rate per 100,000, 2016-2020: 477.6
#38. Seneca County
- Cancer rate per 100,000, 2016-2020: 638.2
- Age-adjusted rate per 100,000, 2016-2020: 481.9
Keith J Finks // Shutterstock
14 / 50#37. Huron County
- Cancer rate per 100,000, 2016-2020: 641.5
- Age-adjusted rate per 100,000, 2016-2020: 502.0
Kenneth Sponsler // Shutterstock
15 / 50Kenneth Keifer // Shutterstock
16 / 50#35. Knox County
- Cancer rate per 100,000, 2016-2020: 644.9
- Age-adjusted rate per 100,000, 2016-2020: 493.2
Madison Muskopf // Shutterstock
17 / 50#34. Coshocton County
- Cancer rate per 100,000, 2016-2020: 645.5
- Age-adjusted rate per 100,000, 2016-2020: 471.2
redtbird02 // Shutterstock
18 / 50#33. Ashtabula County
- Cancer rate per 100,000, 2016-2020: 649.4
- Age-adjusted rate per 100,000, 2016-2020: 464.9
Henryk Sadura // Shutterstock
19 / 50#32. Sandusky County
- Cancer rate per 100,000, 2016-2020: 650.3
- Age-adjusted rate per 100,000, 2016-2020: 474.5
James W. Thompson // Shutterstock
21 / 50#30. Marion County
- Cancer rate per 100,000, 2016-2020: 653.0
- Age-adjusted rate per 100,000, 2016-2020: 493.0
Susie Prentice // Shutterstock
22 / 50#29. Geauga County
- Cancer rate per 100,000, 2016-2020: 655.2
- Age-adjusted rate per 100,000, 2016-2020: 455.5
Donna Wickerham // Shutterstock
23 / 50#28. Richland County
- Cancer rate per 100,000, 2016-2020: 655.5
- Age-adjusted rate per 100,000, 2016-2020: 475.7
#27. Highland County
- Cancer rate per 100,000, 2016-2020: 656.0
- Age-adjusted rate per 100,000, 2016-2020: 498.4
arthurgphotography // Shutterstock
25 / 50ADC Bradley // Shutterstock
26 / 50#25. Brown County
- Cancer rate per 100,000, 2016-2020: 657.2
- Age-adjusted rate per 100,000, 2016-2020: 486.9
#24. Ross County
- Cancer rate per 100,000, 2016-2020: 659.8
- Age-adjusted rate per 100,000, 2016-2020: 507.1
James Marciniak // Shutterstock
28 / 50#23. Jackson County
- Cancer rate per 100,000, 2016-2020: 660.3
- Age-adjusted rate per 100,000, 2016-2020: 514.1
#22. Muskingum County
- Cancer rate per 100,000, 2016-2020: 662.3
- Age-adjusted rate per 100,000, 2016-2020: 507.4
JNix // Shutterstock
31 / 50#20. Columbiana County
- Cancer rate per 100,000, 2016-2020: 671.1
- Age-adjusted rate per 100,000, 2016-2020: 466.4
#19. Crawford County
- Cancer rate per 100,000, 2016-2020: 671.6
- Age-adjusted rate per 100,000, 2016-2020: 466.8
#18. Pike County
- Cancer rate per 100,000, 2016-2020: 672.8
- Age-adjusted rate per 100,000, 2016-2020: 509.9
Aiwilliams // Shutterstock
34 / 50#17. Carroll County
- Cancer rate per 100,000, 2016-2020: 672.9
- Age-adjusted rate per 100,000, 2016-2020: 449.2
James Marciniak // Shutterstock
35 / 50#15. Meigs County
- Cancer rate per 100,000, 2016-2020: 679.9
- Age-adjusted rate per 100,000, 2016-2020: 478.6
The American Explorer // Shutterstock
37 / 50#14. Vinton County
- Cancer rate per 100,000, 2016-2020: 682.2
- Age-adjusted rate per 100,000, 2016-2020: 502.0
JNix // Shutterstock
38 / 50#13. Belmont County
- Cancer rate per 100,000, 2016-2020: 684.3
- Age-adjusted rate per 100,000, 2016-2020: 471.8
Mikhalis Makarov // Shutterstock
39 / 50#12. Lake County
- Cancer rate per 100,000, 2016-2020: 684.7
- Age-adjusted rate per 100,000, 2016-2020: 479.5
JNix // Shutterstock
40 / 50#11. Gallia County
- Cancer rate per 100,000, 2016-2020: 689.4
- Age-adjusted rate per 100,000, 2016-2020: 511.6
You may also like: Best public colleges in Ohio
#10. Guernsey County
- Cancer rate per 100,000, 2016-2020: 690.8
- Age-adjusted rate per 100,000, 2016-2020: 498.5
#9. Morgan County
- Cancer rate per 100,000, 2016-2020: 691.1
- Age-adjusted rate per 100,000, 2016-2020: 457.6
JNix // Shutterstock
43 / 50#8. Harrison County
- Cancer rate per 100,000, 2016-2020: 691.3
- Age-adjusted rate per 100,000, 2016-2020: 465.7
#7. Adams County
- Cancer rate per 100,000, 2016-2020: 697.9
- Age-adjusted rate per 100,000, 2016-2020: 524.8
Big Joe // Shutterstock
45 / 50The American Explorer // Shutterstock
46 / 50#5. Lawrence County
- Cancer rate per 100,000, 2016-2020: 749.6
- Age-adjusted rate per 100,000, 2016-2020: 553.5
#4. Jefferson County
- Cancer rate per 100,000, 2016-2020: 759.4
- Age-adjusted rate per 100,000, 2016-2020: 514.4
#3. Monroe County
- Cancer rate per 100,000, 2016-2020: 762.3
- Age-adjusted rate per 100,000, 2016-2020: 494.4
#2. Washington County
- Cancer rate per 100,000, 2016-2020: 787.5
- Age-adjusted rate per 100,000, 2016-2020: 532.7