Canva
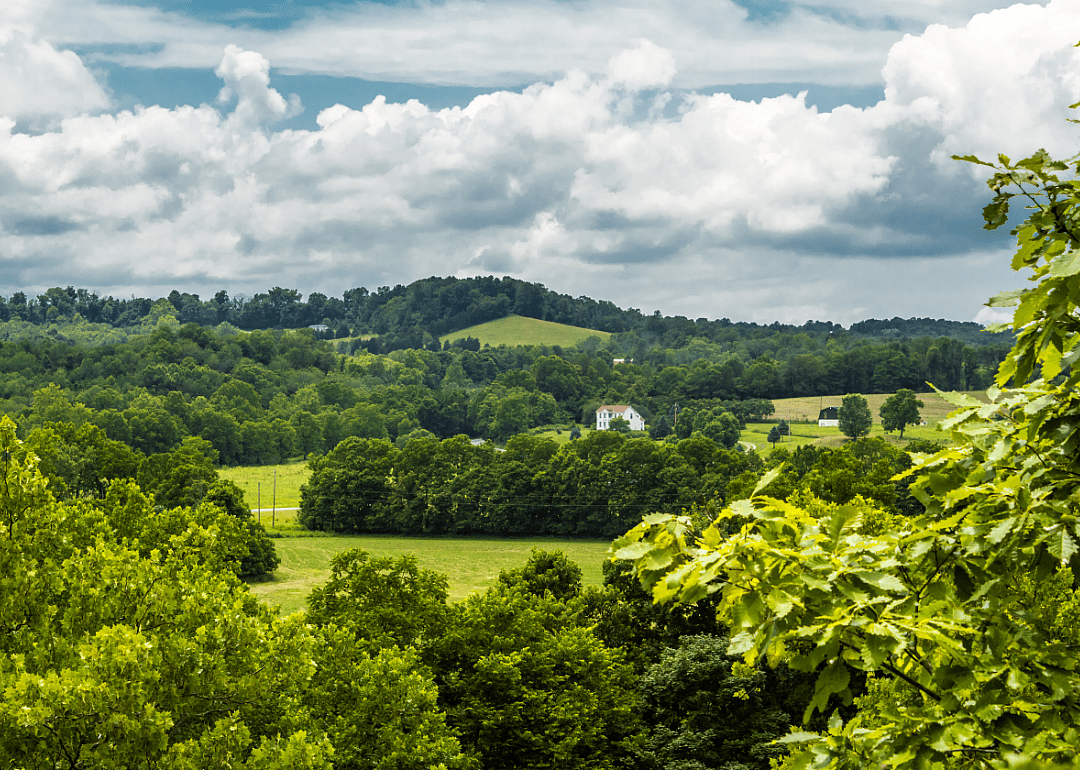
1 / 20#20. Adams County
- Bridges in poor condition: 7.9% (15 of 190 bridges)
- Square meters of bridges in poor condition: 4.6% (2,064 of 44,715 square meters of bridges)

One in three U.S. bridges is in need of repair or replacement, according to data from the American Road & Transportation Builders Association, including 29% of interstate bridges. The cost to make these repairs is estimated to be in excess of $54 billion.
Stacker investigated which counties in Ohio have the most bridges in dire need of repair using data from the Federal Highway Administration. The data is accurate as of June 15, 2022. Counties are ranked by percent of bridges in "poor" condition and ties are broken by percent square meters of bridges in poor condition. Counties that have no bridges or have no bridges in poor condition are excluded from the list.
You may also like: Countries to which Ohio exports the most goods
Canva
1 / 20- Bridges in poor condition: 7.9% (15 of 190 bridges)
- Square meters of bridges in poor condition: 4.6% (2,064 of 44,715 square meters of bridges)
Canva
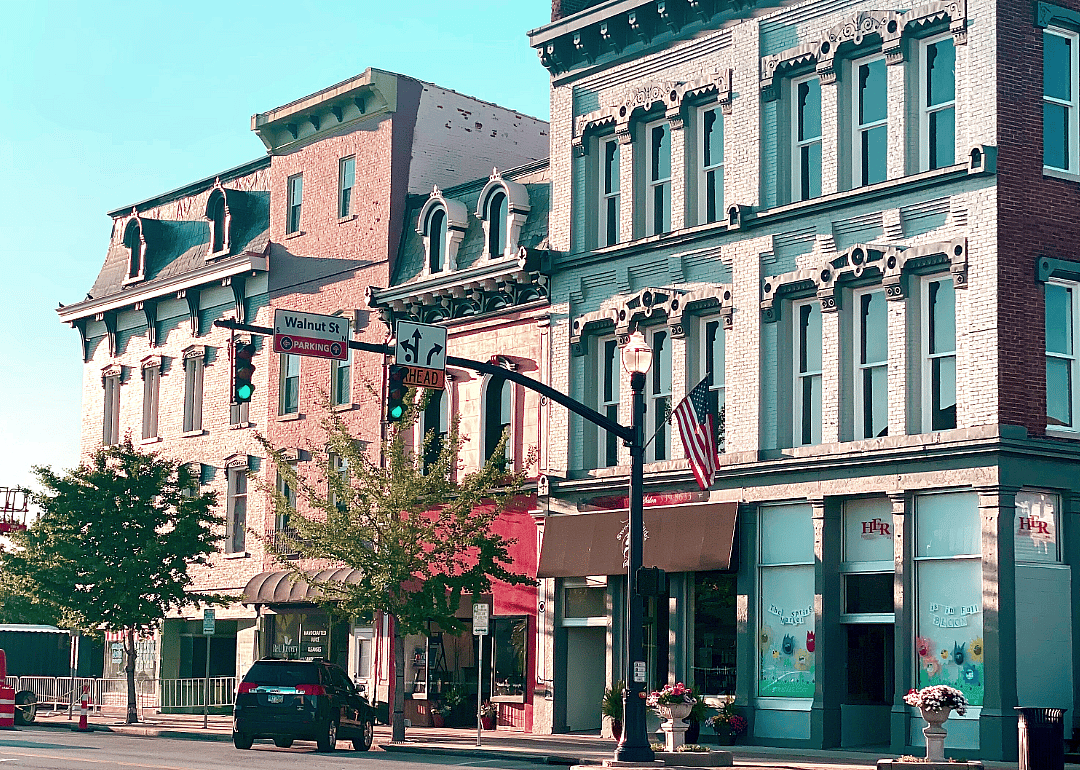
2 / 20- Bridges in poor condition: 8.1% (26 of 322 bridges)
- Square meters of bridges in poor condition: 3.1% (4,335 of 139,113 square meters of bridges)
Canva
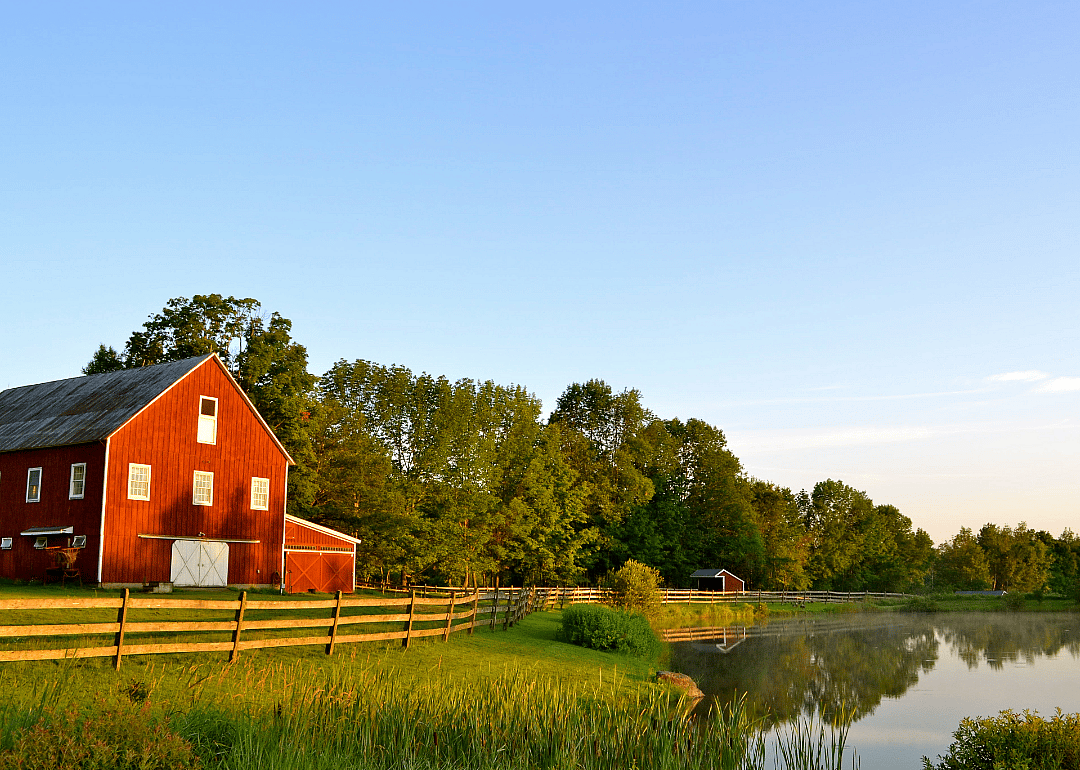
3 / 20- Bridges in poor condition: 8.1% (26 of 320 bridges)
- Square meters of bridges in poor condition: 3.4% (3,948 of 117,381 square meters of bridges)
Canva
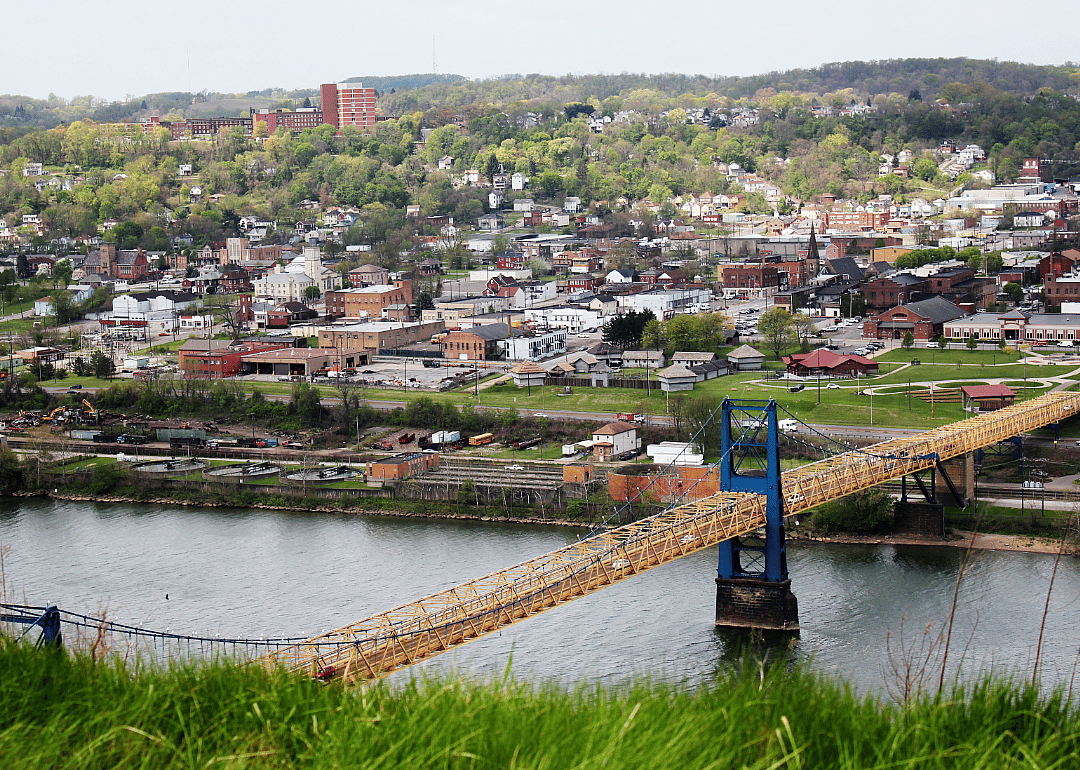
4 / 20- Bridges in poor condition: 8.2% (19 of 232 bridges)
- Square meters of bridges in poor condition: 5.5% (7,953 of 145,062 square meters of bridges)
Canva
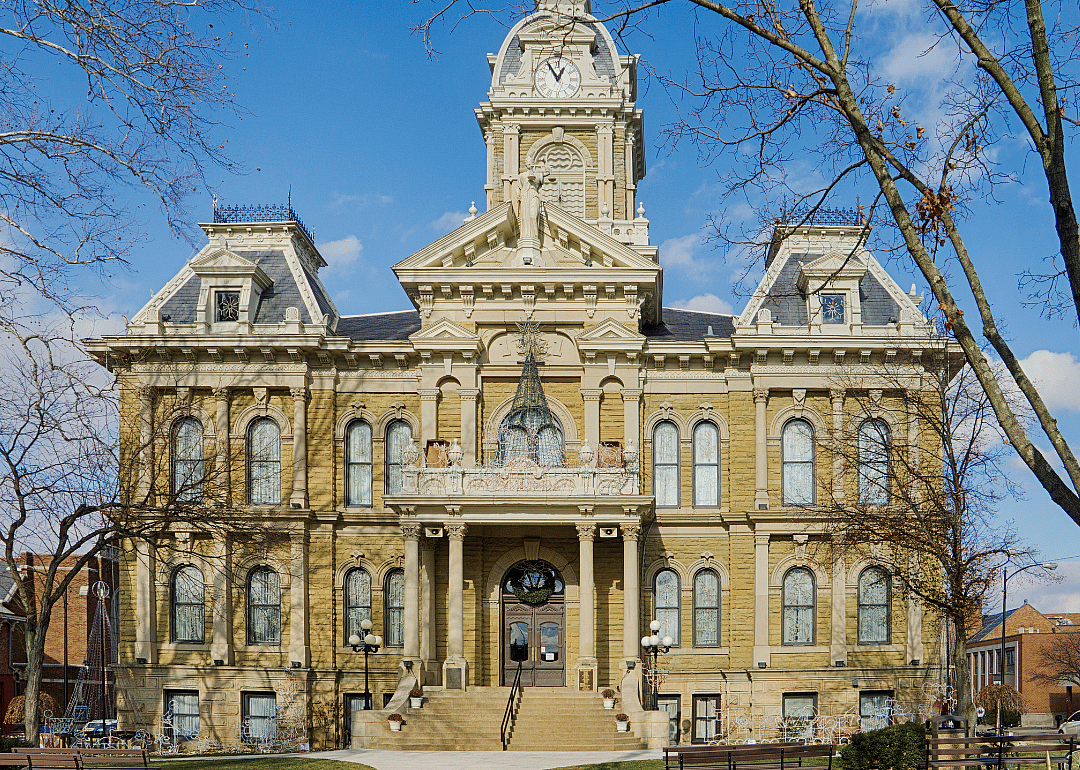
5 / 20- Bridges in poor condition: 8.3% (29 of 351 bridges)
- Square meters of bridges in poor condition: 7.0% (6,963 of 99,504 square meters of bridges)
You may also like: More electric vehicles means less gas tax revenue: How this impacts Ohio's budget
Canva
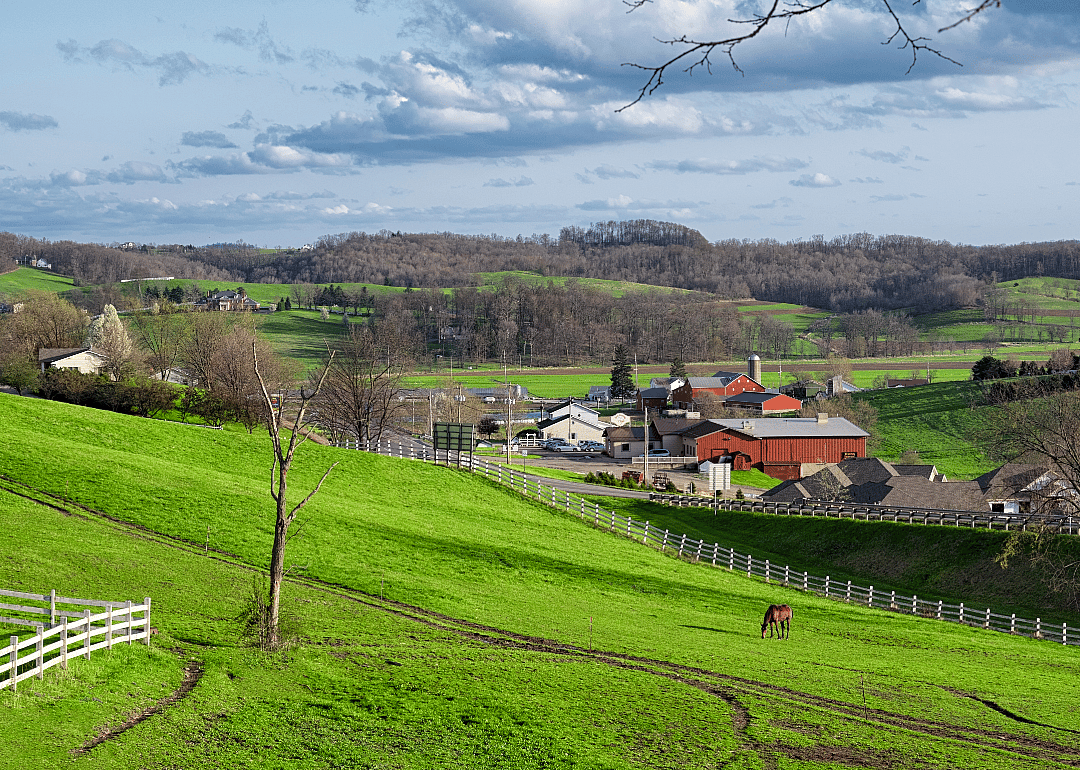
6 / 20- Bridges in poor condition: 8.7% (34 of 393 bridges)
- Square meters of bridges in poor condition: 3.9% (4,628 of 119,483 square meters of bridges)
Keith J Finks // Shutterstock
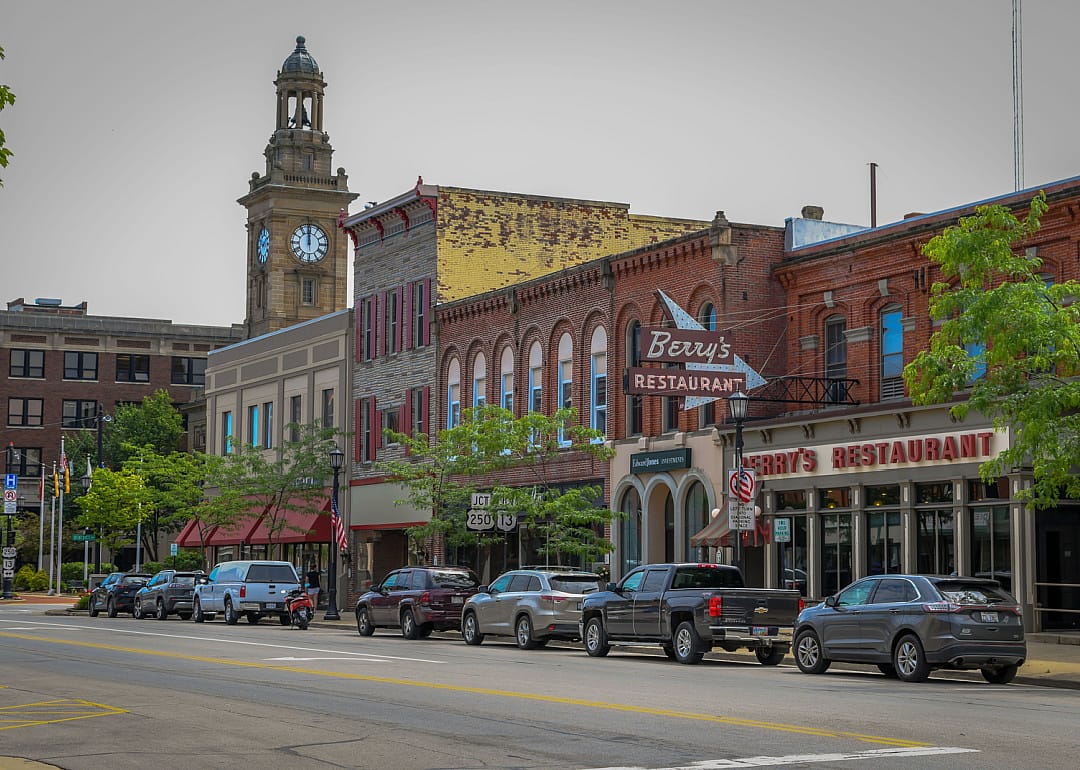
7 / 20- Bridges in poor condition: 8.9% (28 of 313 bridges)
- Square meters of bridges in poor condition: 4.5% (3,282 of 72,879 square meters of bridges)
Canva
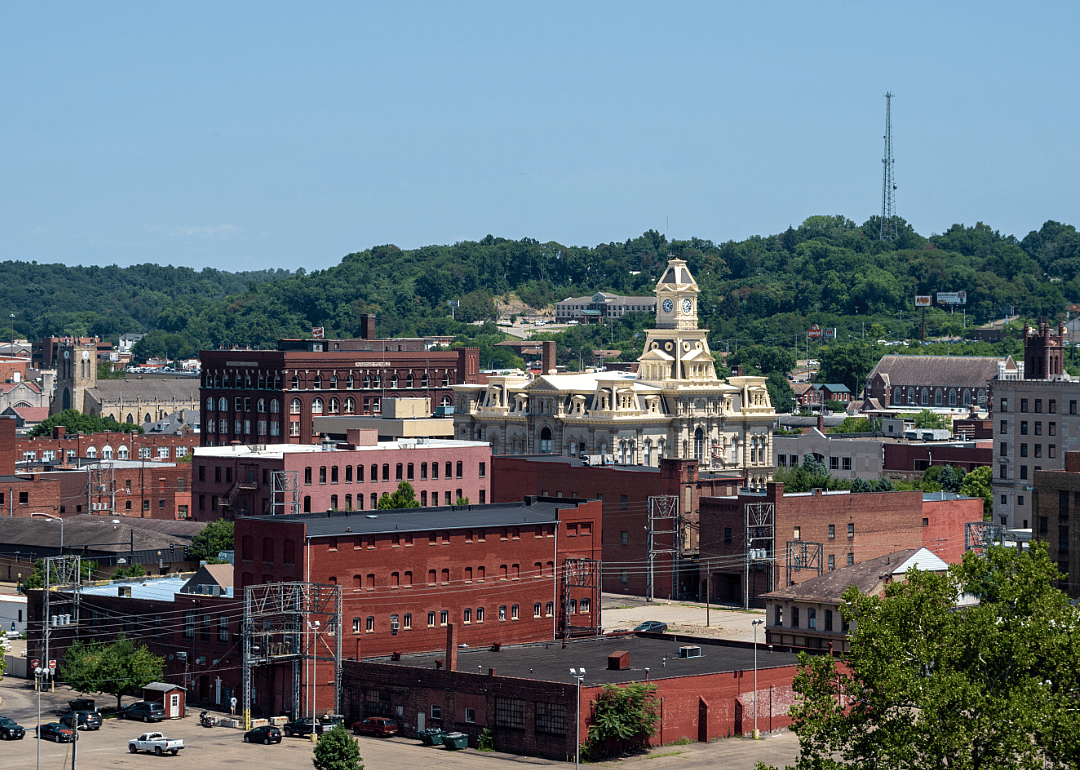
8 / 20- Bridges in poor condition: 9.0% (33 of 365 bridges)
- Square meters of bridges in poor condition: 2.1% (3,114 of 148,913 square meters of bridges)

Canva
9 / 20- Bridges in poor condition: 9.2% (20 of 218 bridges)
- Square meters of bridges in poor condition: 3.9% (4,546 of 116,657 square meters of bridges)
Canva
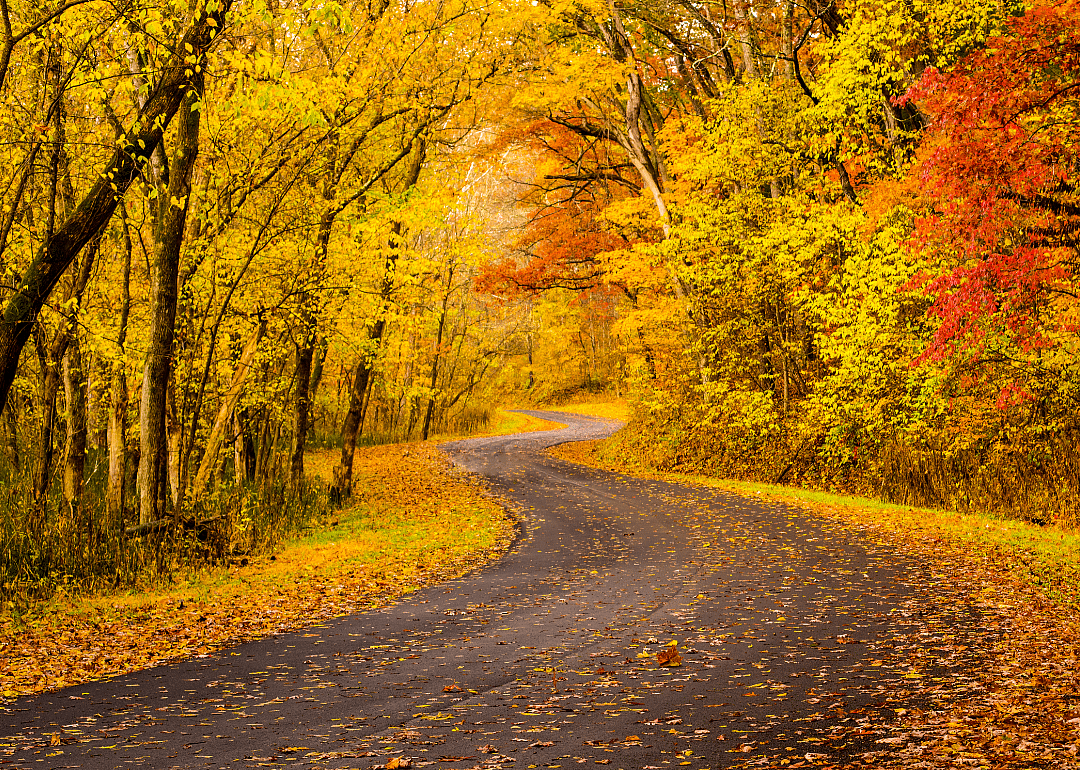
10 / 20- Bridges in poor condition: 9.3% (37 of 396 bridges)
- Square meters of bridges in poor condition: 3.2% (7,128 of 225,532 square meters of bridges)
You may also like: How gas prices have changed in Ohio in the last week
The American Explorer // Shutterstock
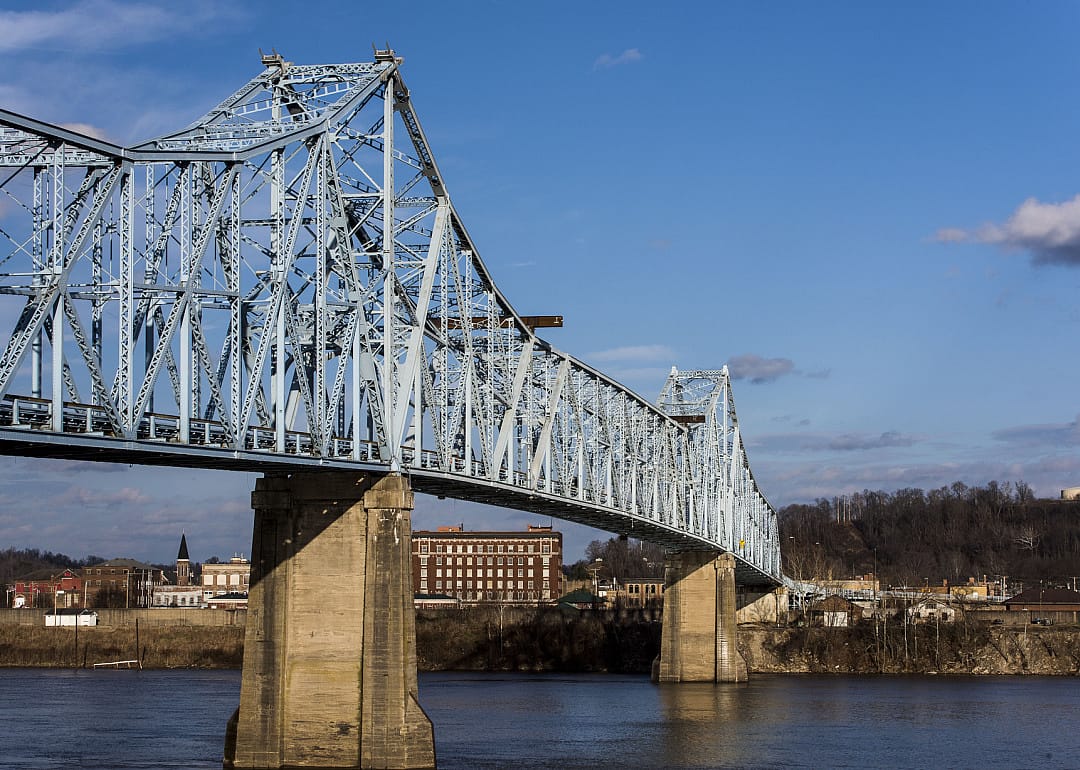
11 / 20- Bridges in poor condition: 9.4% (24 of 255 bridges)
- Square meters of bridges in poor condition: 1.3% (1,743 of 132,742 square meters of bridges)
James Marciniak // Shutterstock
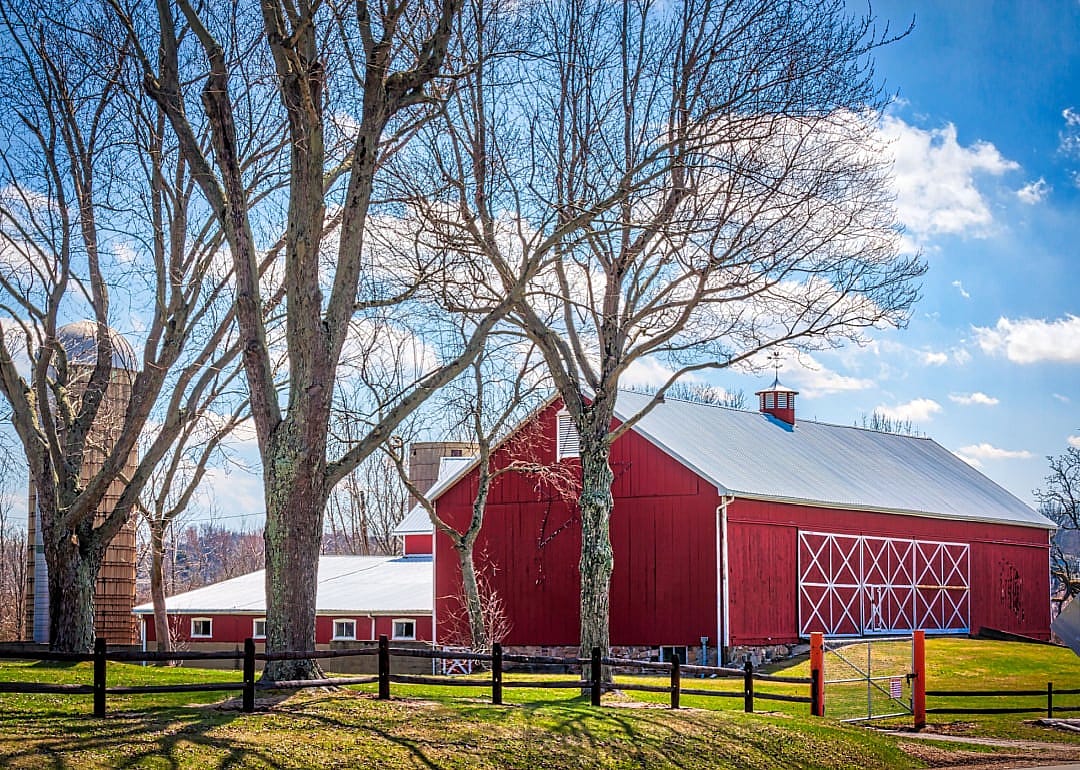
12 / 20- Bridges in poor condition: 9.4% (24 of 255 bridges)
- Square meters of bridges in poor condition: 3.7% (2,061 of 55,442 square meters of bridges)
Canva
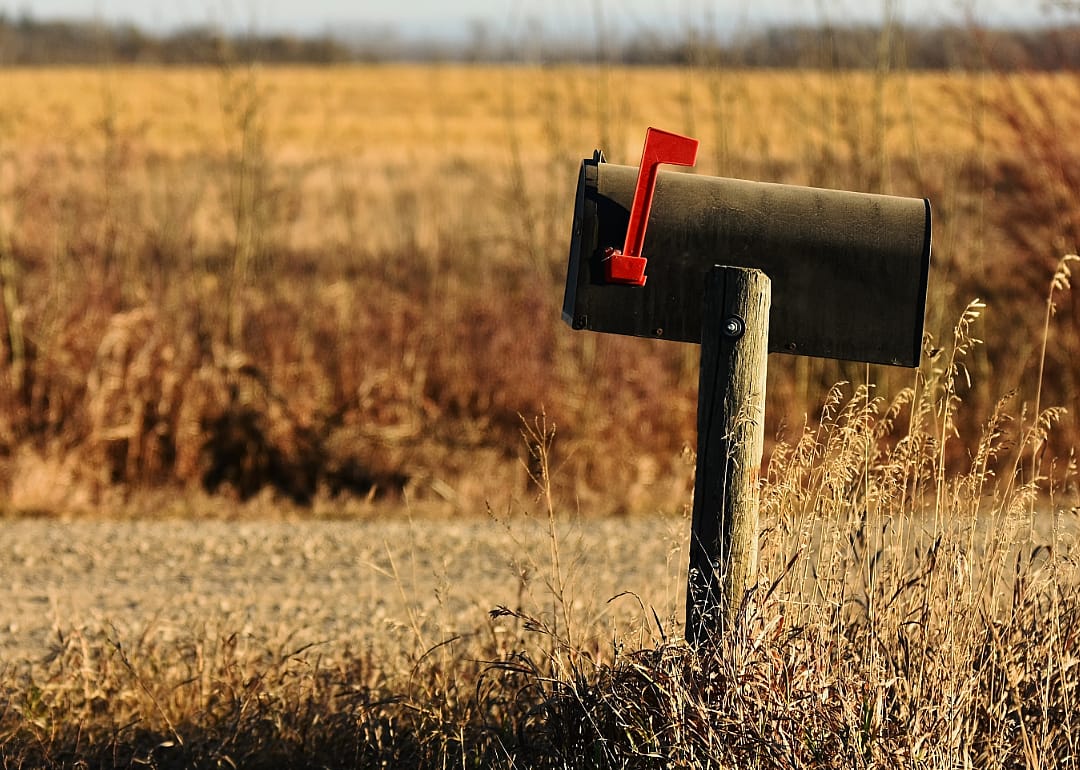
13 / 20- Bridges in poor condition: 9.6% (26 of 271 bridges)
- Square meters of bridges in poor condition: 7.2% (2,605 of 36,382 square meters of bridges)
Mikhalis Makarov // Shutterstock
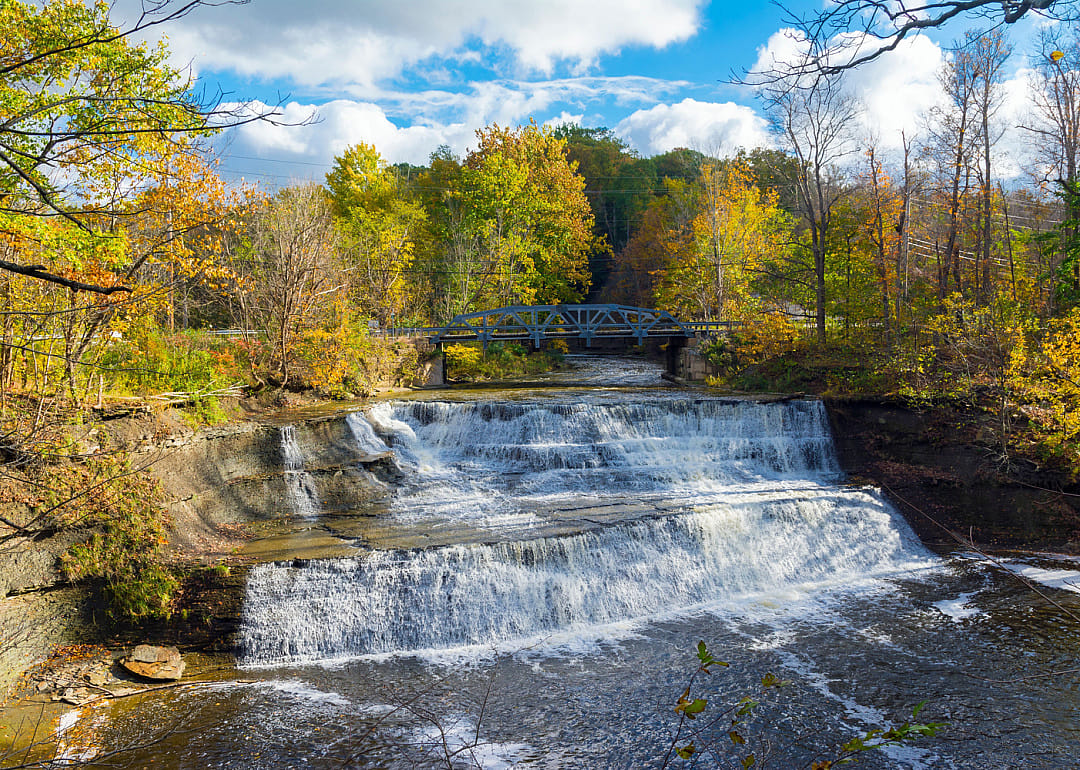
14 / 20- Bridges in poor condition: 9.8% (21 of 215 bridges)
- Square meters of bridges in poor condition: 11.6% (22,897 of 196,828 square meters of bridges)
Kenneth Sponsler // Shutterstock
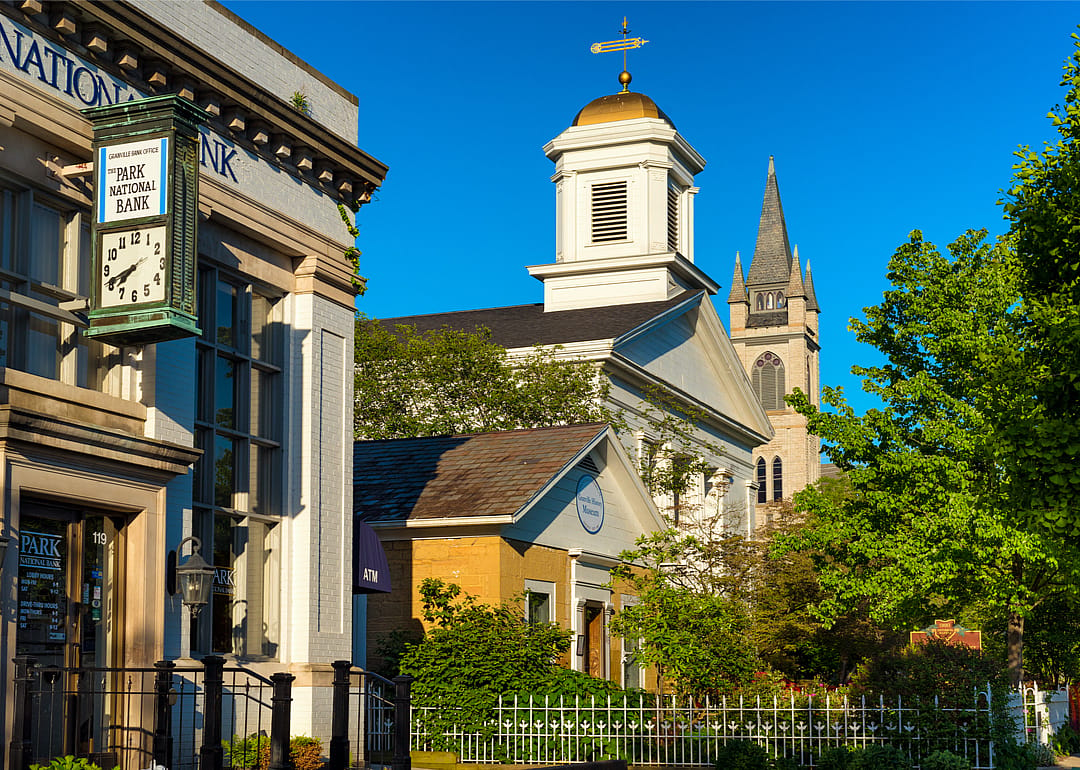
15 / 20- Bridges in poor condition: 9.9% (44 of 444 bridges)
- Square meters of bridges in poor condition: 6.2% (10,825 of 174,684 square meters of bridges)
You may also like: Highest-rated museums in Ohio by visitors
Kenneth Keifer // Shutterstock
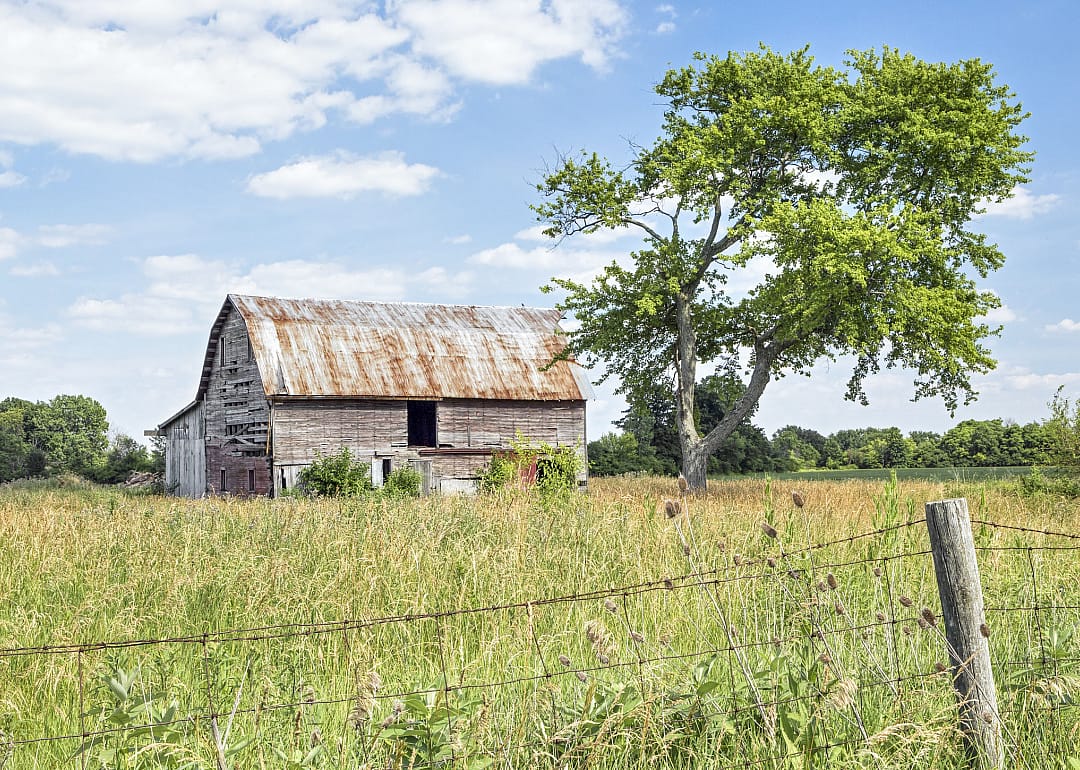
16 / 20- Bridges in poor condition: 10.2% (20 of 197 bridges)
- Square meters of bridges in poor condition: 8.8% (6,502 of 73,981 square meters of bridges)
Canva
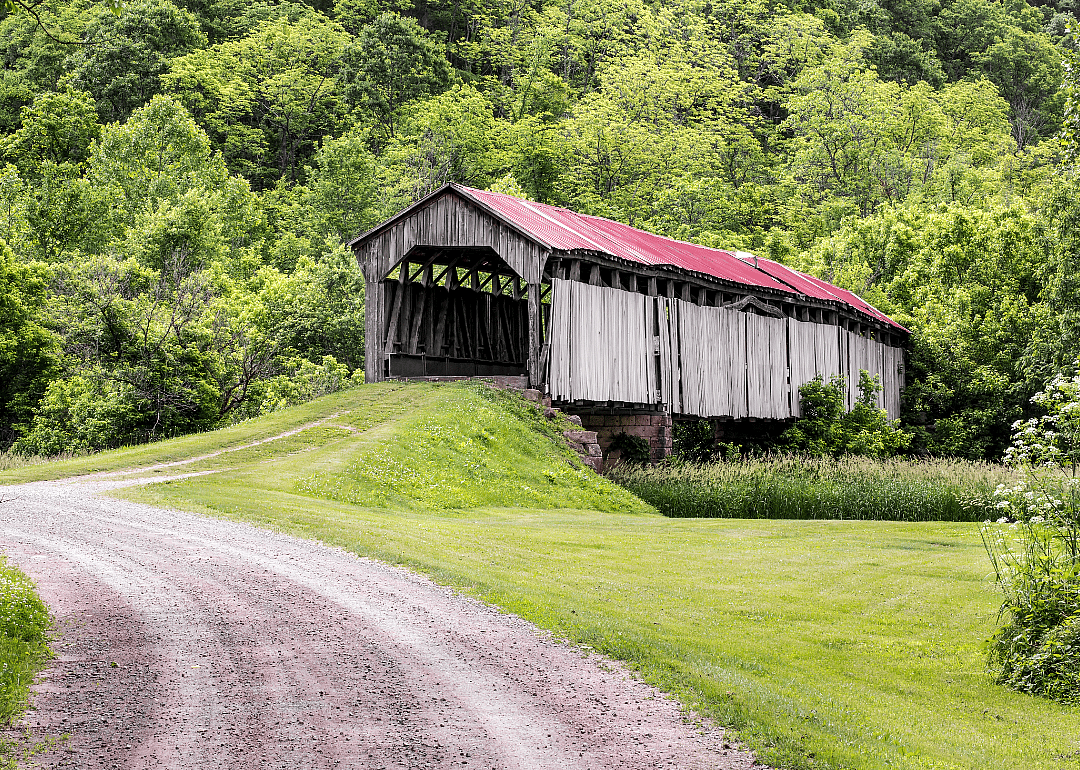
17 / 20- Bridges in poor condition: 11.0% (18 of 164 bridges)
- Square meters of bridges in poor condition: 5.3% (1,653 of 31,465 square meters of bridges)
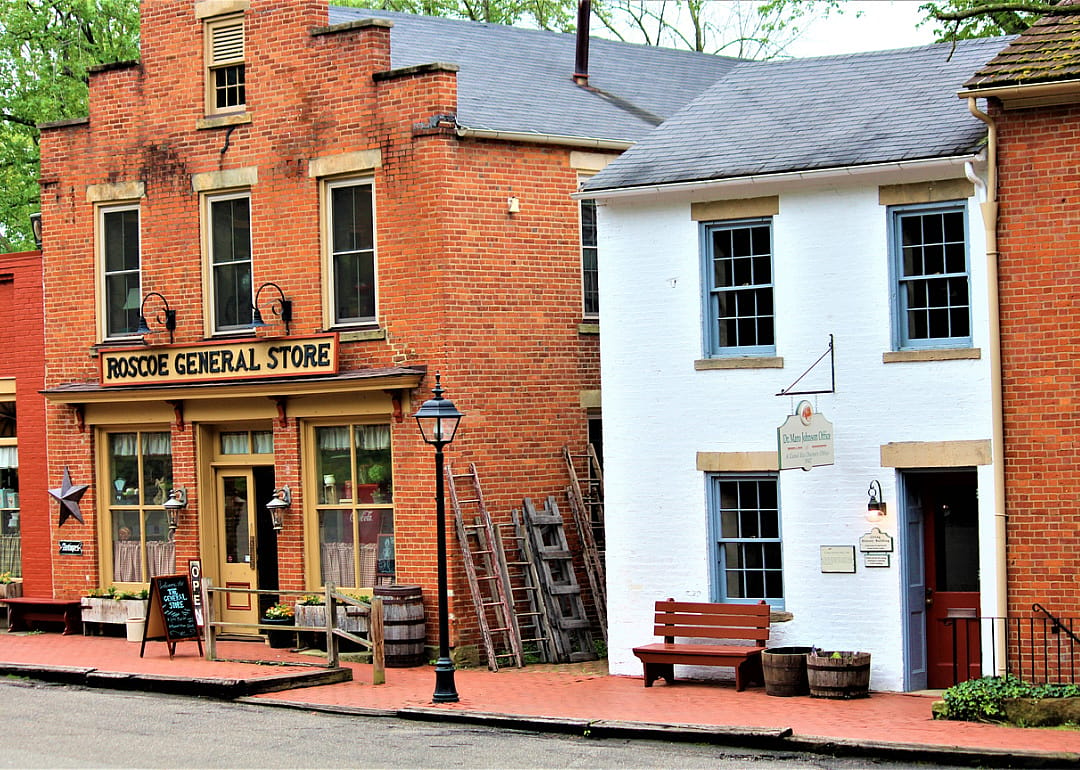
Madison Muskopf // Shutterstock
18 / 20- Bridges in poor condition: 11.2% (21 of 188 bridges)
- Square meters of bridges in poor condition: 3.1% (1,764 of 56,222 square meters of bridges)
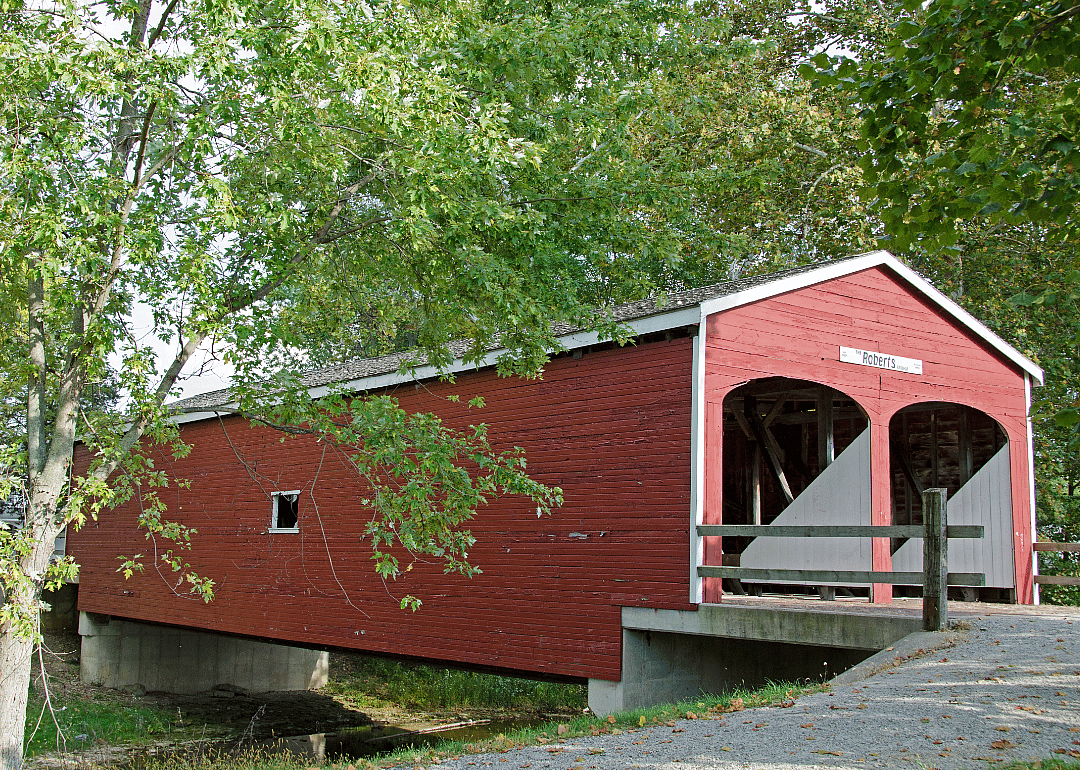
Canva
19 / 20- Bridges in poor condition: 12.3% (44 of 359 bridges)
- Square meters of bridges in poor condition: 7.8% (6,183 of 79,544 square meters of bridges)
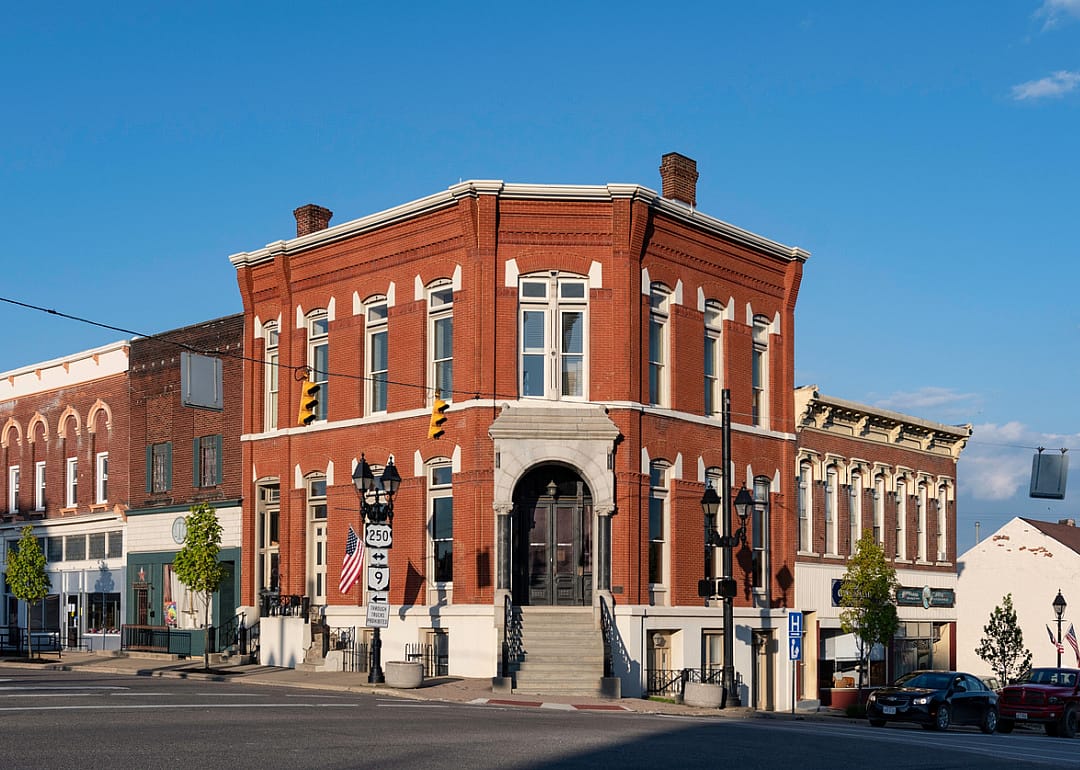
JNix // Shutterstock
20 / 20- Bridges in poor condition: 15.4% (22 of 143 bridges)
- Square meters of bridges in poor condition: 9.8% (3,434 of 34,966 square meters of bridges)
You may also like: Best counties to retire to in Ohio



