Stacker
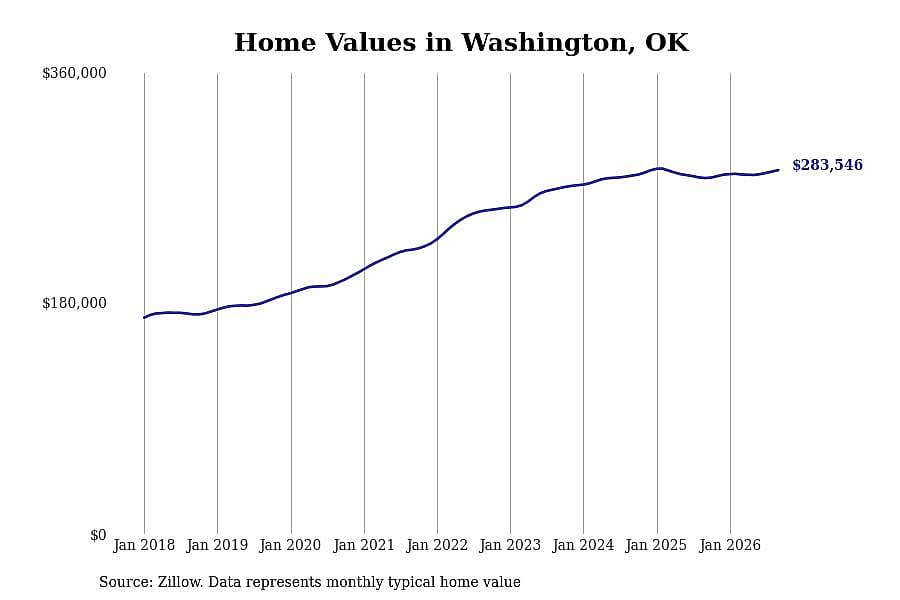
1 / 30#30. Washington
- Typical home value: $283,546
- 1-year price change: +2.2%
- 5-year price change: +28.0%
- Metro area: Oklahoma City, OK

Purchasing a home is one of the most important investments there is. More than a place to live, homeownership is an asset with the potential to tremendously rise in value. But with home prices reaching record heights, affordability plays a huge role for buyers.
The typical home value in the United States was $366,913 in September, 1.0% higher than the year before.
High mortgage rates are also making monthly payments more expensive; as of October 15, the 30-year fixed mortgage rate sits at 7.4%.
Although home prices have inflated all across the U.S., there are some cities that command a higher price tag than others. Location, size, age, and condition are all contributing factors to home value.
Stacker compiled a list of cities with the most expensive homes in Oklahoma using data from Zillow. Cities are ranked by the Zillow Home Values Index for all homes as of September 2026. The charts in this story were created automatically using Matplotlib.
Metros with the most cities in the top 30 in Oklahoma
#1. Oklahoma City, OK: 14
#2. Tulsa, OK: 8
#3. Lawton, OK: 2
#4. Durant, OK: 1
#4. Ardmore, OK: 1
#4. Miami, OK: 1
#4. Tahlequah, OK: 1
You may also like: Most dominant seasons in Oklahoma City Thunder history
Stacker
1 / 30- Typical home value: $283,546
- 1-year price change: +2.2%
- 5-year price change: +28.0%
- Metro area: Oklahoma City, OK
Stacker
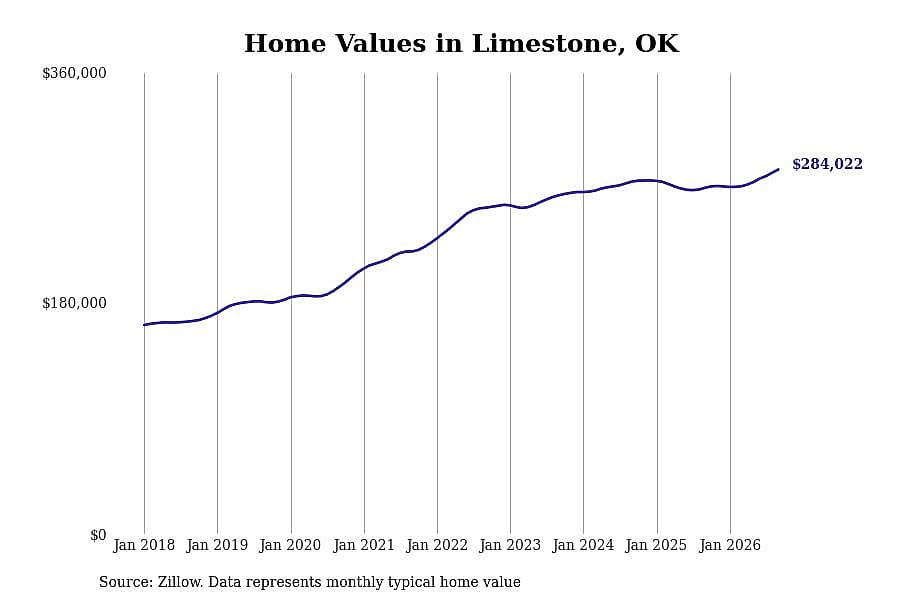
2 / 30- Typical home value: $284,022
- 1-year price change: +5.3%
- 5-year price change: +29.0%
- Metro area: Tulsa, OK
Stacker
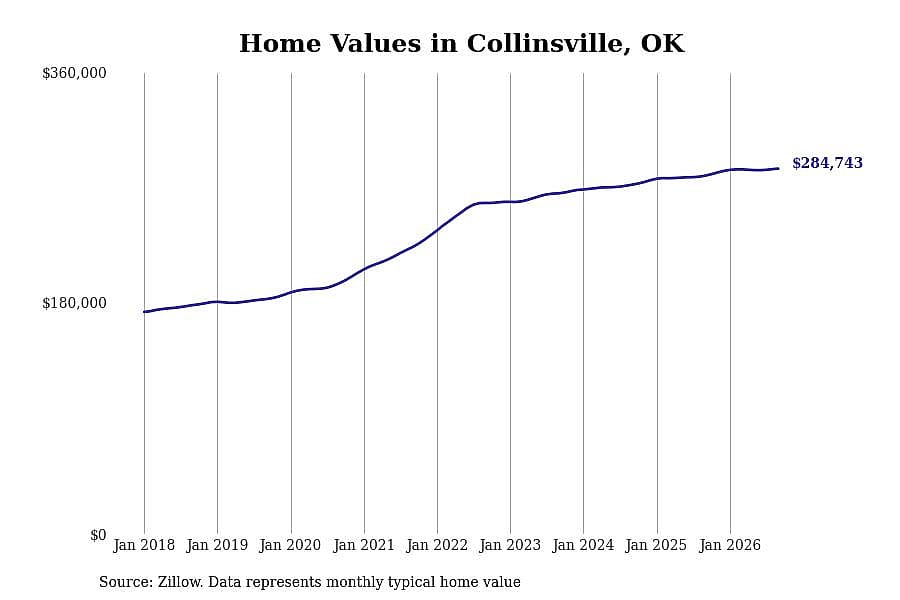
3 / 30- Typical home value: $284,743
- 1-year price change: +2.0%
- 5-year price change: +27.4%
- Metro area: Tulsa, OK
Stacker
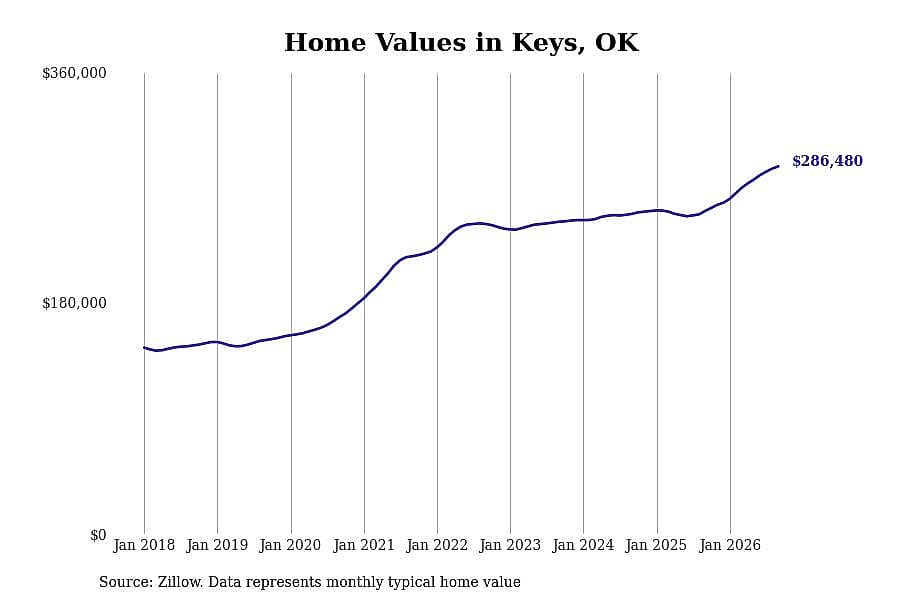
4 / 30- Typical home value: $286,480
- 1-year price change: +13.8%
- 5-year price change: +32.4%
- Metro area: Tahlequah, OK
Stacker
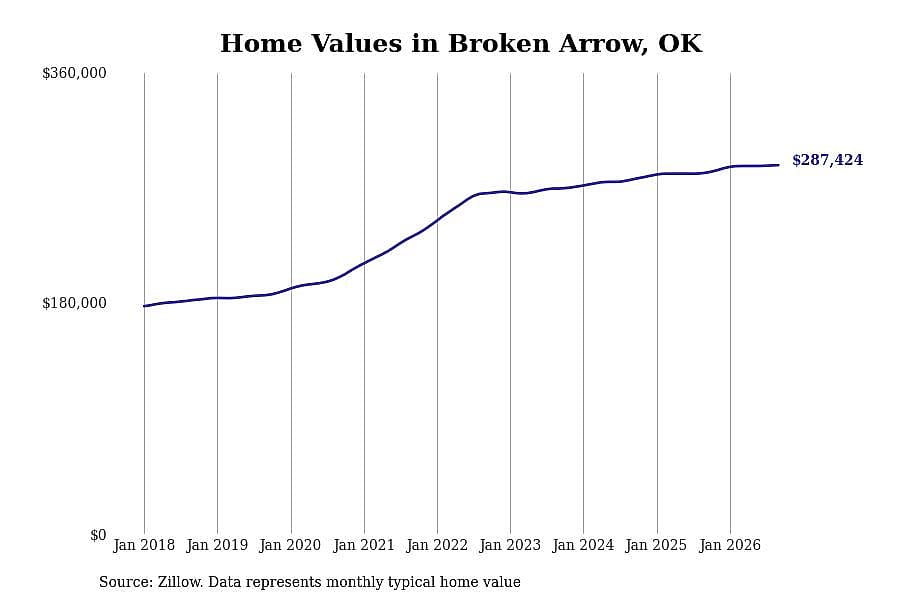
5 / 30- Typical home value: $287,424
- 1-year price change: +2.1%
- 5-year price change: +23.9%
- Metro area: Tulsa, OK
You may also like: Coldest Augusts in Oklahoma since 1895
Stacker
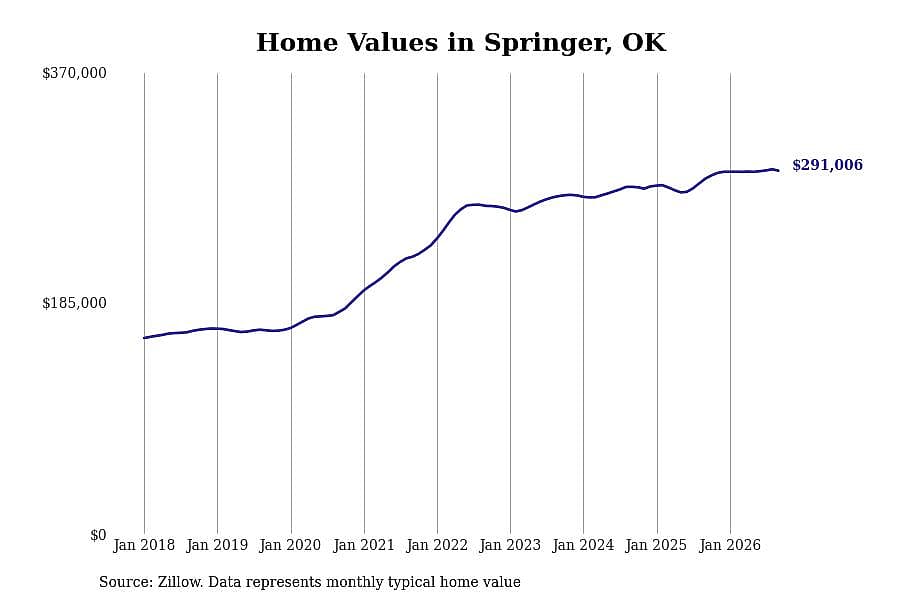
6 / 30- Typical home value: $291,006
- 1-year price change: +2.3%
- 5-year price change: +31.1%
- Metro area: Ardmore, OK
Stacker
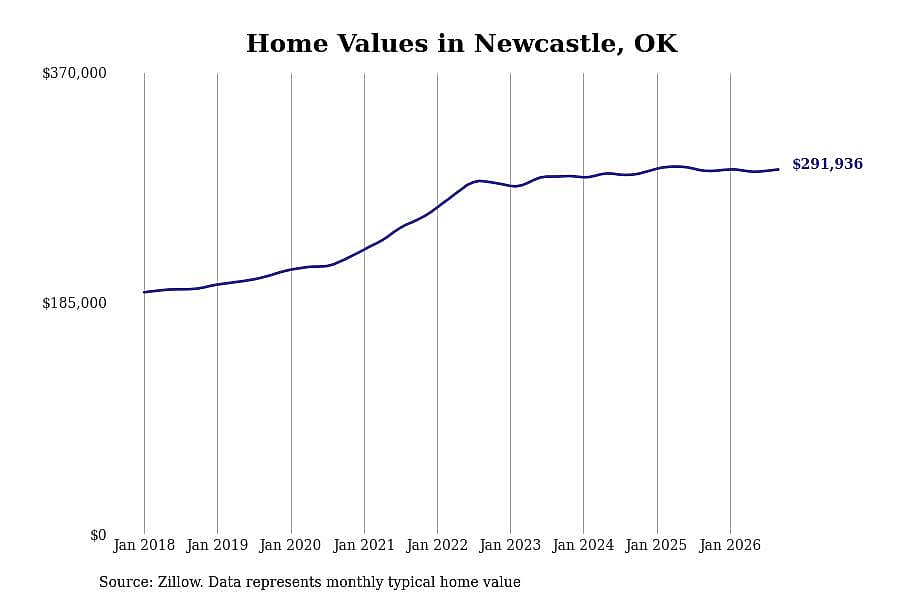
7 / 30- Typical home value: $291,936
- 1-year price change: +0.4%
- 5-year price change: +16.9%
- Metro area: Oklahoma City, OK
Stacker
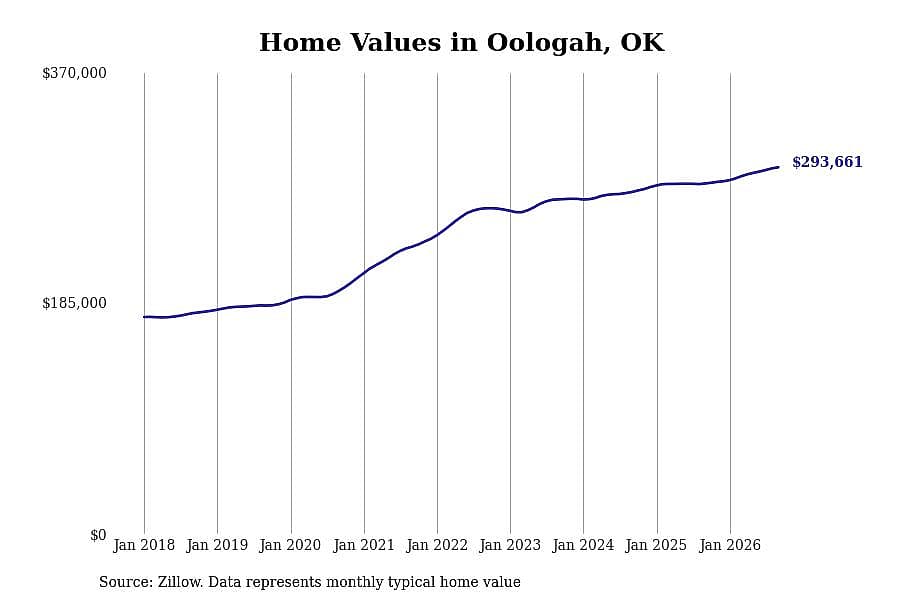
8 / 30- Typical home value: $293,661
- 1-year price change: +4.6%
- 5-year price change: +27.6%
- Metro area: Tulsa, OK
Stacker
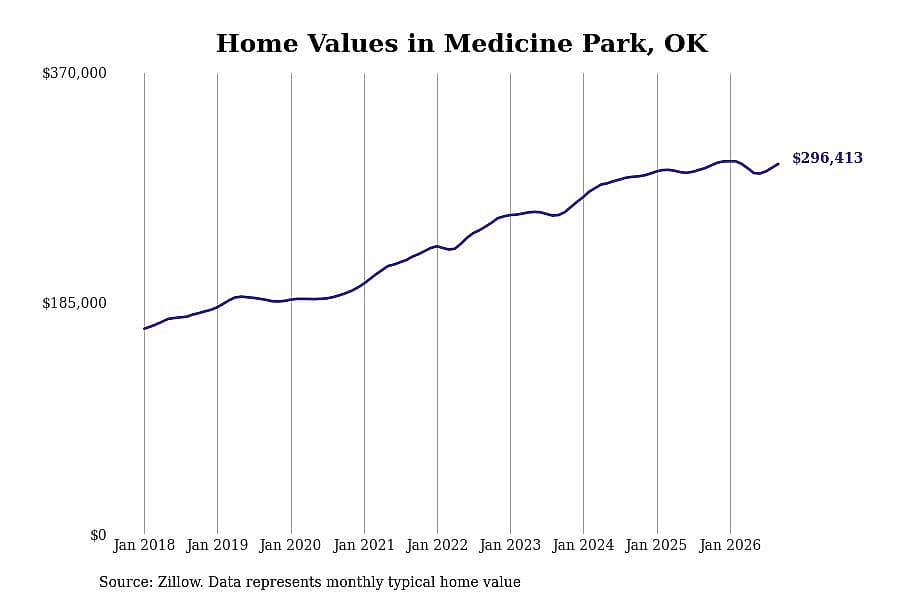
9 / 30- Typical home value: $296,413
- 1-year price change: +1.1%
- 5-year price change: +33.5%
- Metro area: Lawton, OK
Stacker
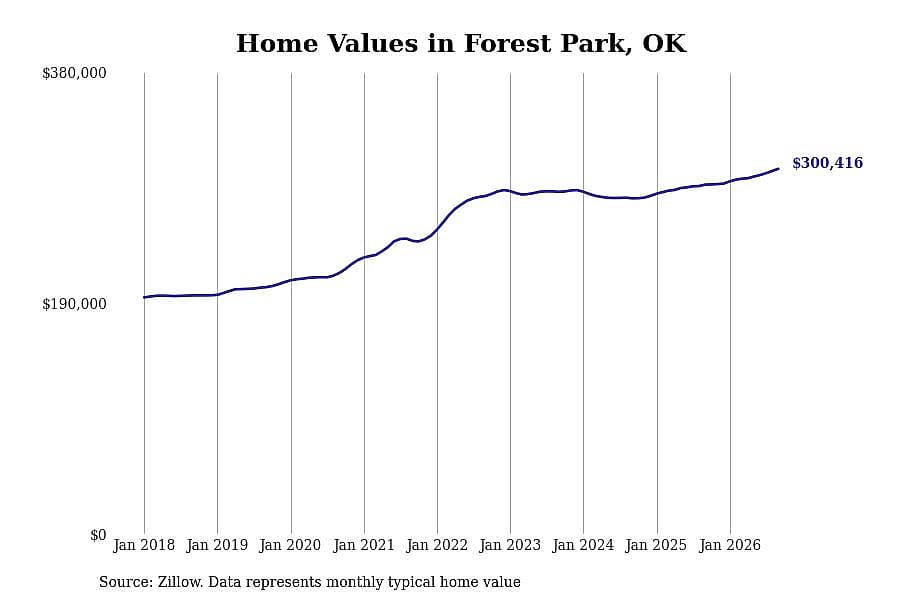
10 / 30- Typical home value: $300,416
- 1-year price change: +4.5%
- 5-year price change: +24.6%
- Metro area: Oklahoma City, OK
You may also like: Oklahoma ranks near the middle for access to mental healthcare. Here's how to find help
Stacker
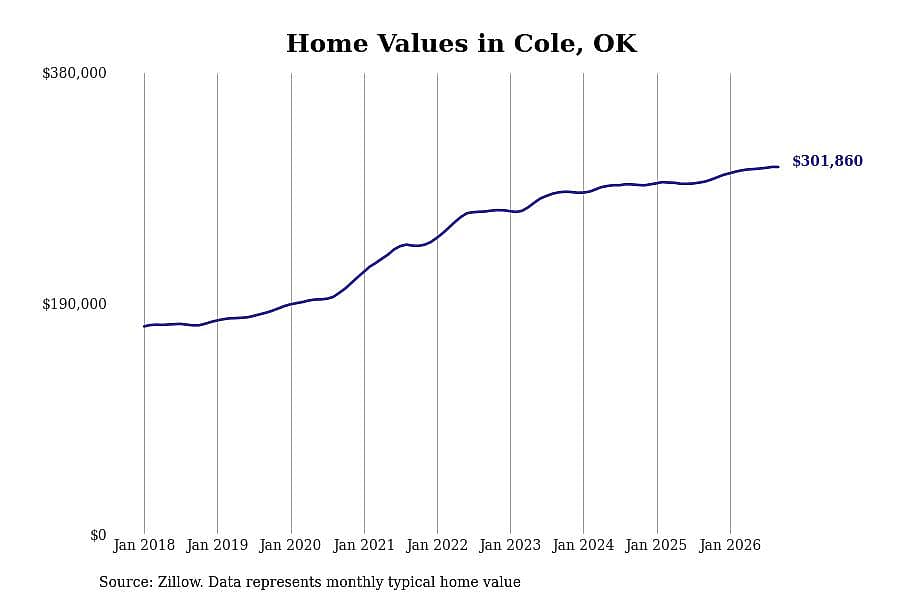
11 / 30- Typical home value: $301,860
- 1-year price change: +4.1%
- 5-year price change: +27.3%
- Metro area: Oklahoma City, OK
Stacker
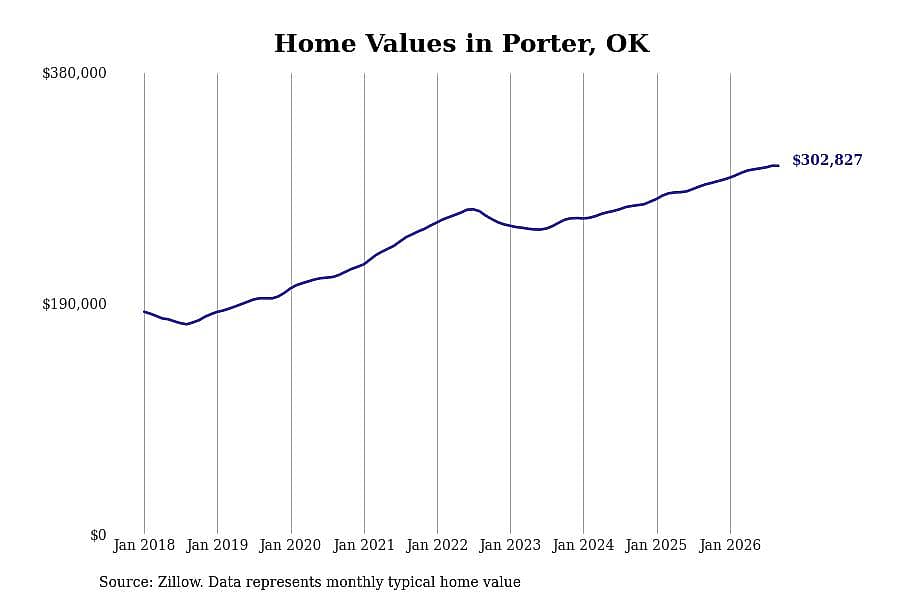
12 / 30- Typical home value: $302,827
- 1-year price change: +5.3%
- 5-year price change: +22.8%
- Metro area: Tulsa, OK
Stacker
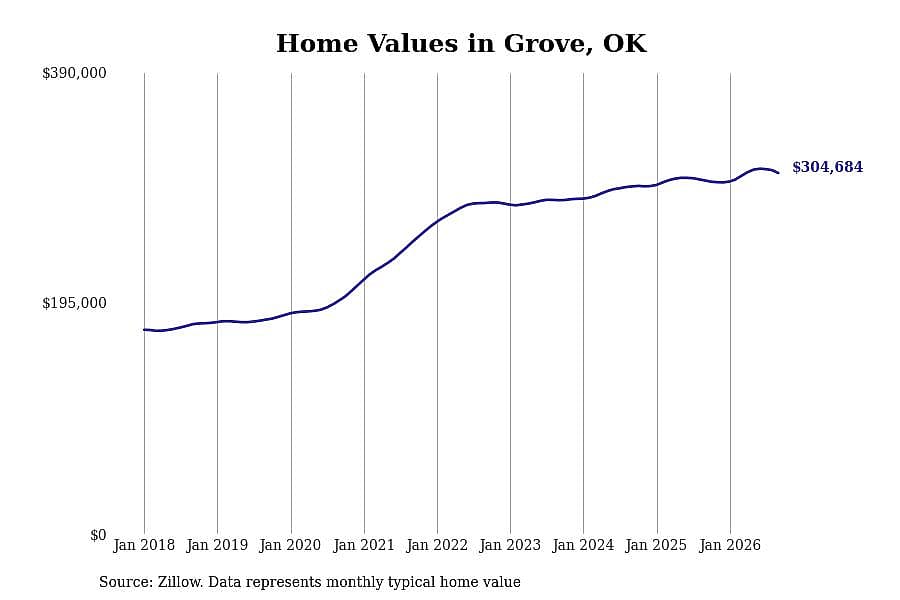
13 / 30- Typical home value: $304,684
- 1-year price change: +2.1%
- 5-year price change: +23.6%
- Metro area: not in a metro area
Stacker
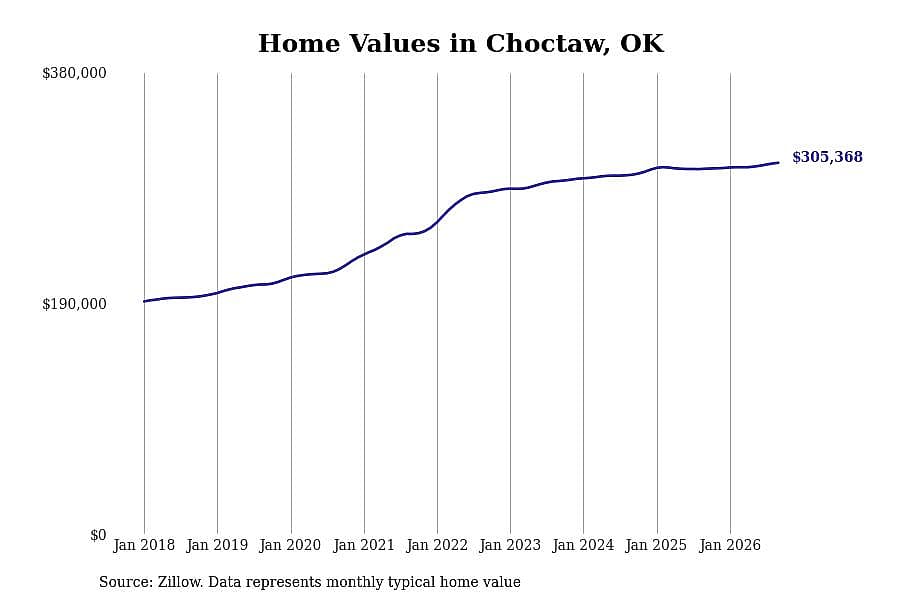
14 / 30- Typical home value: $305,368
- 1-year price change: +1.6%
- 5-year price change: +23.7%
- Metro area: Oklahoma City, OK
Stacker
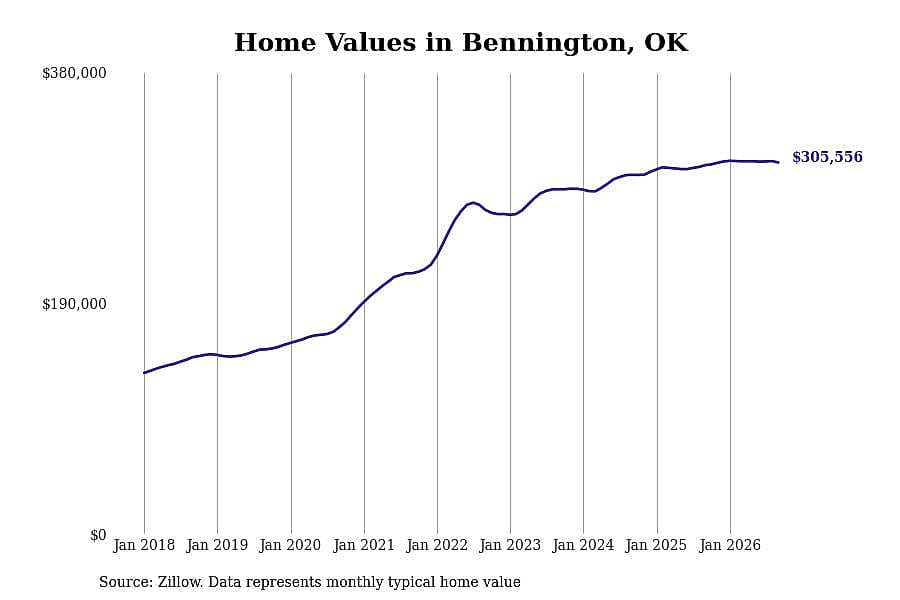
15 / 30- Typical home value: $305,556
- 1-year price change: +0.7%
- 5-year price change: +42.5%
- Metro area: Durant, OK
You may also like: Highest-rated Class of 2026 women's basketball recruits from Oklahoma
Stacker
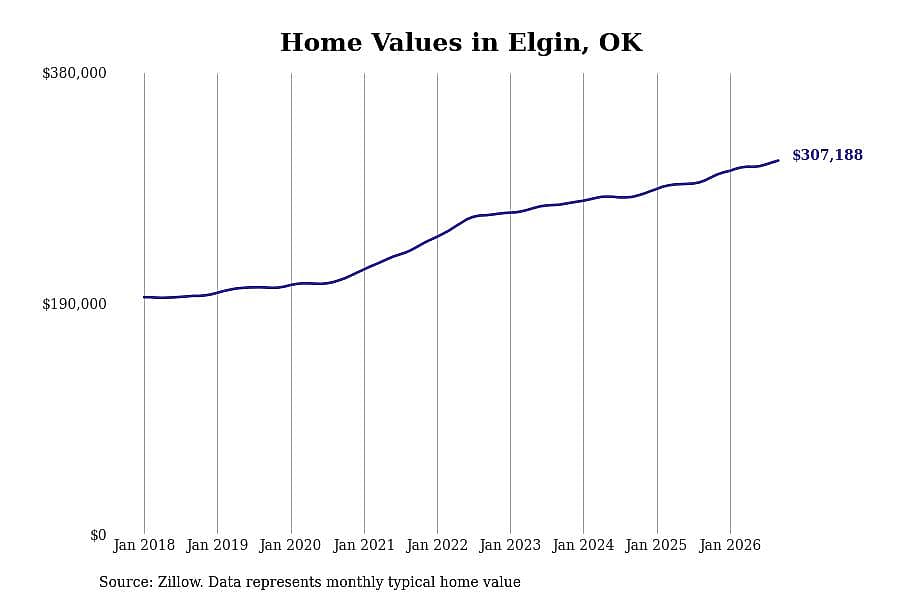
16 / 30- Typical home value: $307,188
- 1-year price change: +5.6%
- 5-year price change: +31.2%
- Metro area: Lawton, OK
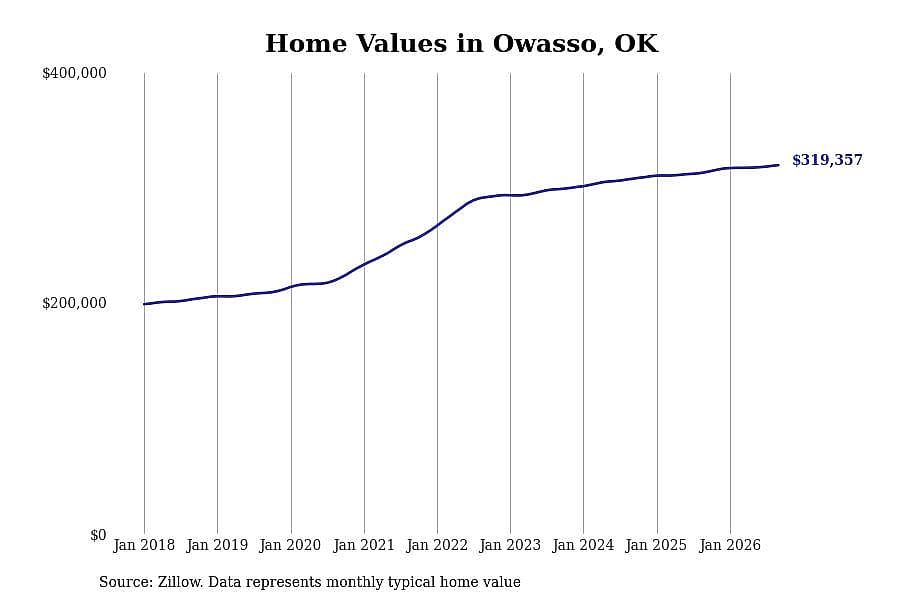
Stacker
17 / 30- Typical home value: $319,357
- 1-year price change: +2.0%
- 5-year price change: +25.5%
- Metro area: Tulsa, OK
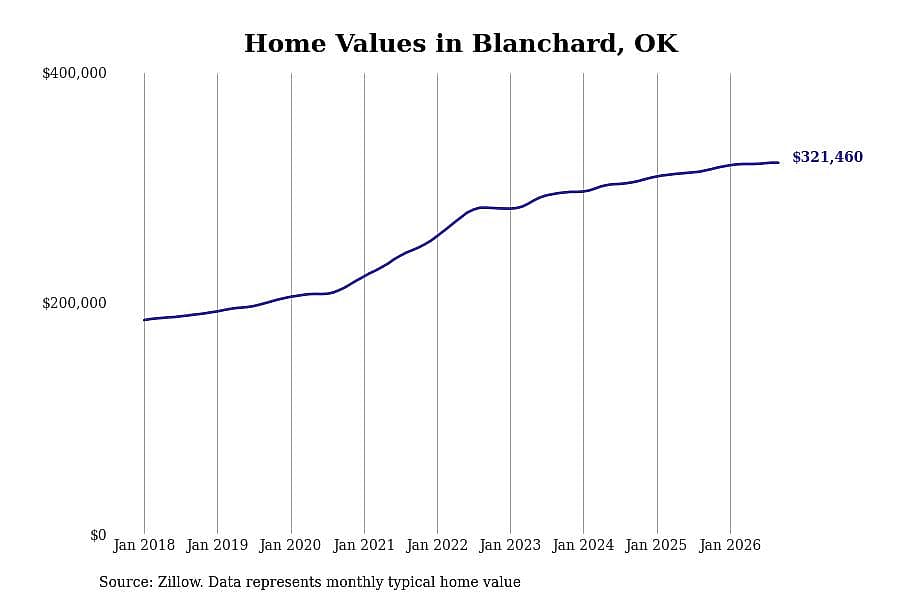
Stacker
18 / 30- Typical home value: $321,460
- 1-year price change: +2.1%
- 5-year price change: +30.8%
- Metro area: Oklahoma City, OK
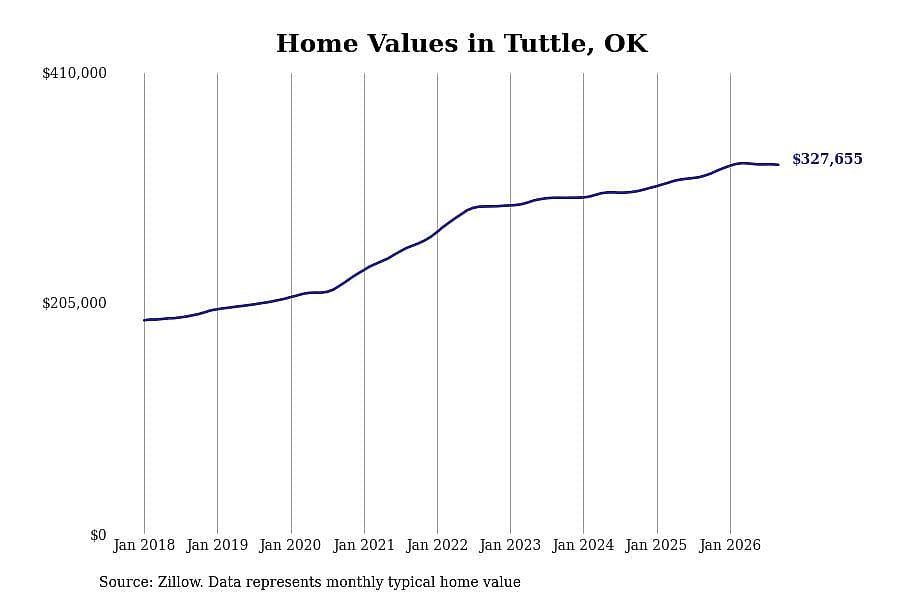
Stacker
19 / 30- Typical home value: $327,655
- 1-year price change: +3.0%
- 5-year price change: +28.1%
- Metro area: Oklahoma City, OK
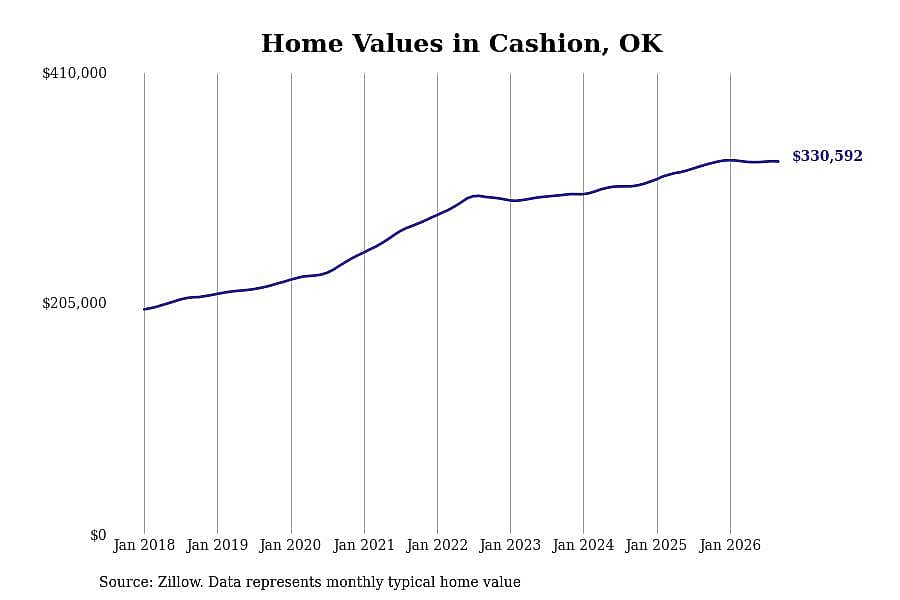
Stacker
20 / 30- Typical home value: $330,592
- 1-year price change: +0.9%
- 5-year price change: +20.9%
- Metro area: Oklahoma City, OK
You may also like: Coldest Decembers in Oklahoma since 1895
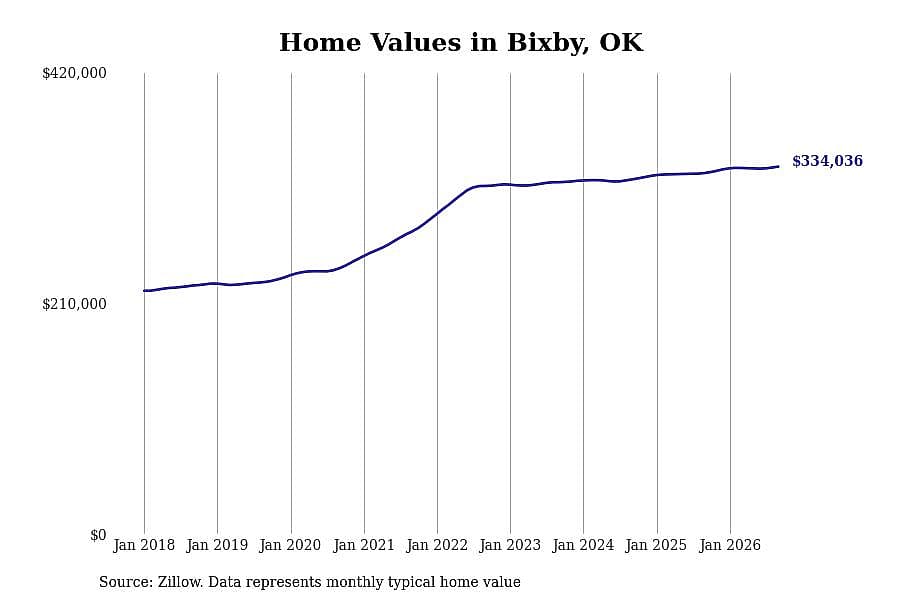
Stacker
21 / 30- Typical home value: $334,036
- 1-year price change: +1.8%
- 5-year price change: +21.4%
- Metro area: Tulsa, OK
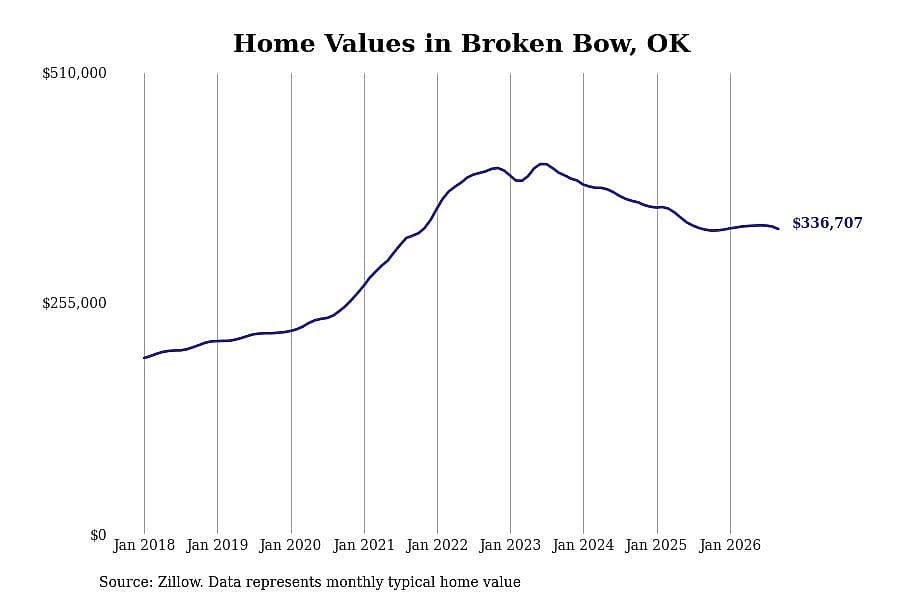
Stacker
22 / 30- Typical home value: $336,707
- 1-year price change: +0.2%
- 5-year price change: +2.3%
- Metro area: not in a metro area
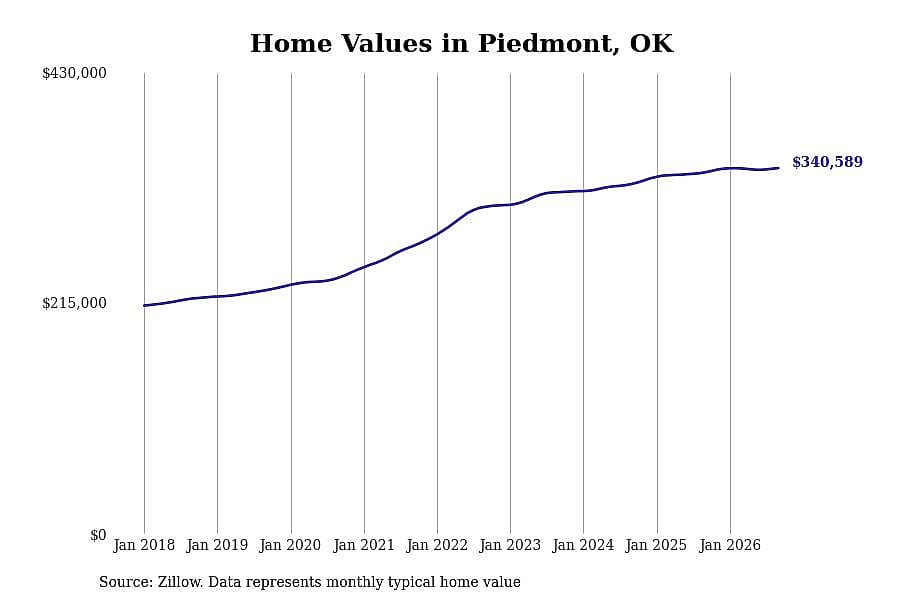
Stacker
23 / 30- Typical home value: $340,589
- 1-year price change: +1.2%
- 5-year price change: +27.2%
- Metro area: Oklahoma City, OK
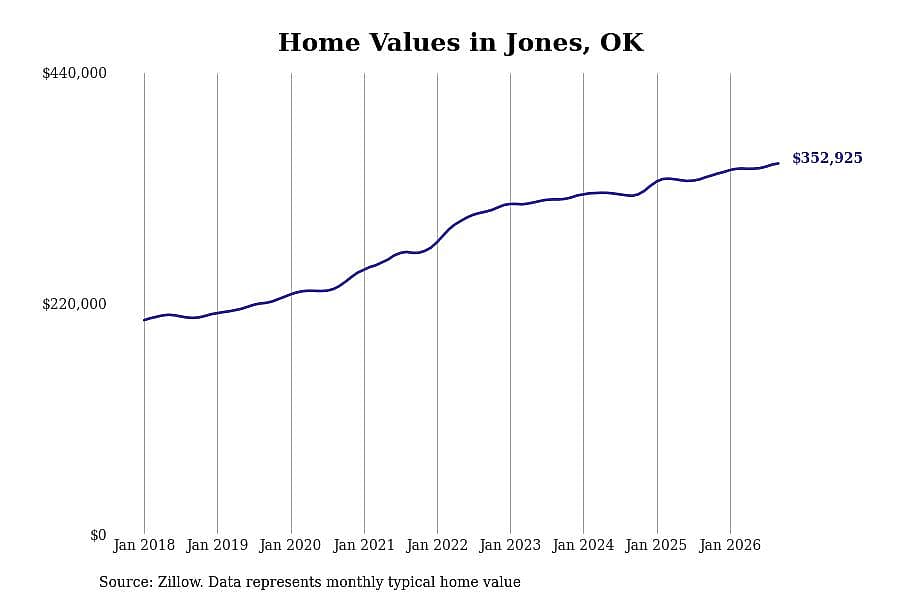
Stacker
24 / 30- Typical home value: $352,925
- 1-year price change: +3.9%
- 5-year price change: +31.8%
- Metro area: Oklahoma City, OK
Stacker
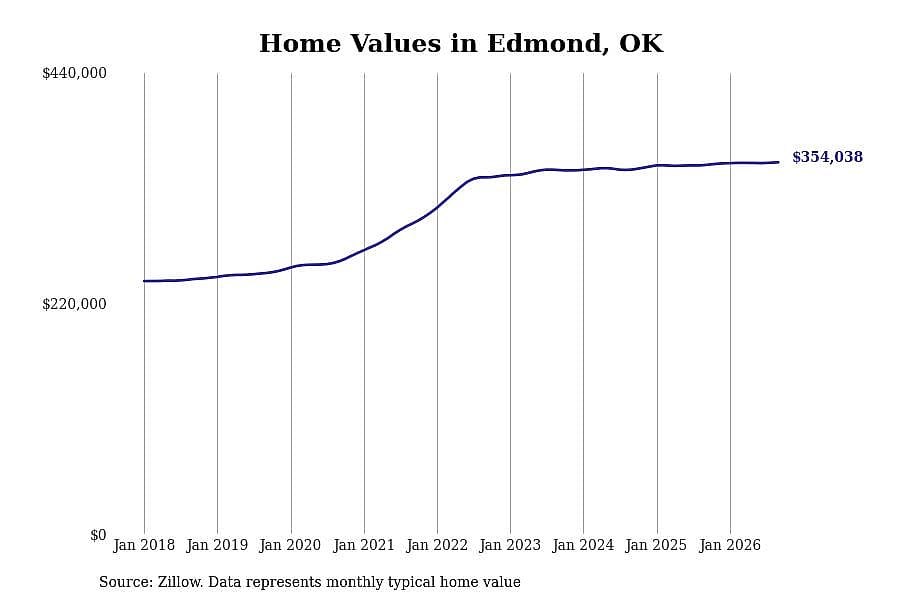
25 / 30- Typical home value: $354,038
- 1-year price change: +0.7%
- 5-year price change: +19.7%
- Metro area: Oklahoma City, OK
You may also like: Most commonly hunted migratory birds in Oklahoma
Stacker
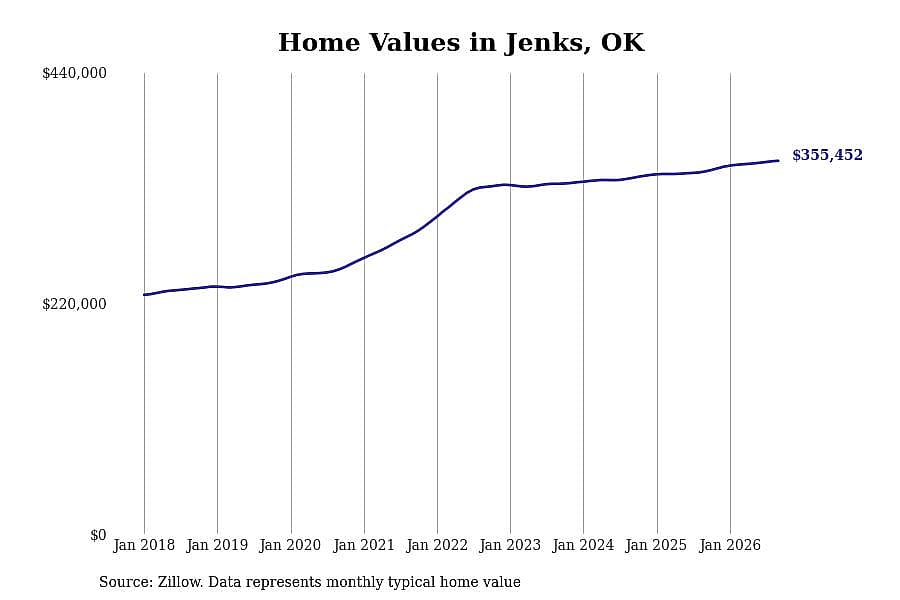
26 / 30- Typical home value: $355,452
- 1-year price change: +2.9%
- 5-year price change: +24.5%
- Metro area: Tulsa, OK
Stacker
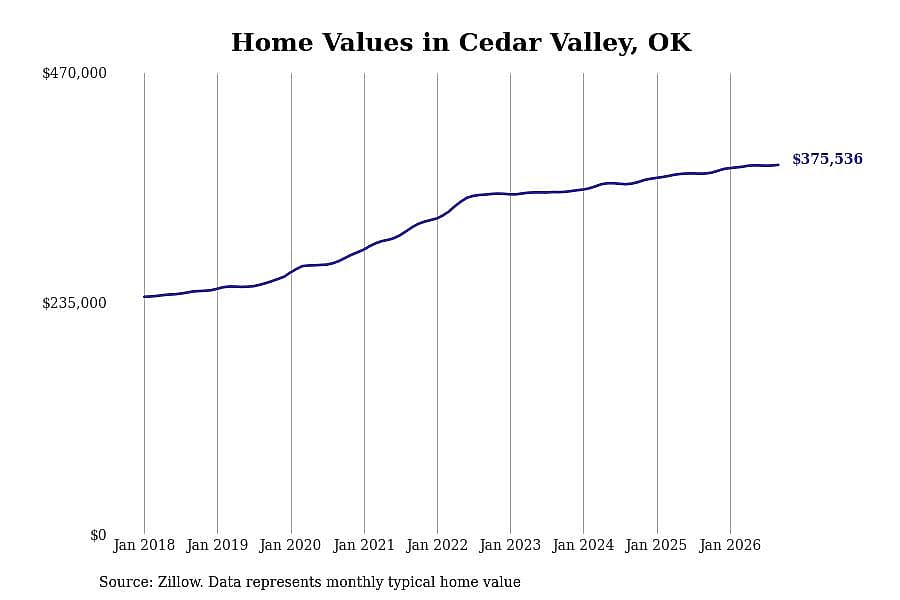
27 / 30- Typical home value: $375,536
- 1-year price change: +2.4%
- 5-year price change: +20.3%
- Metro area: Oklahoma City, OK
Stacker
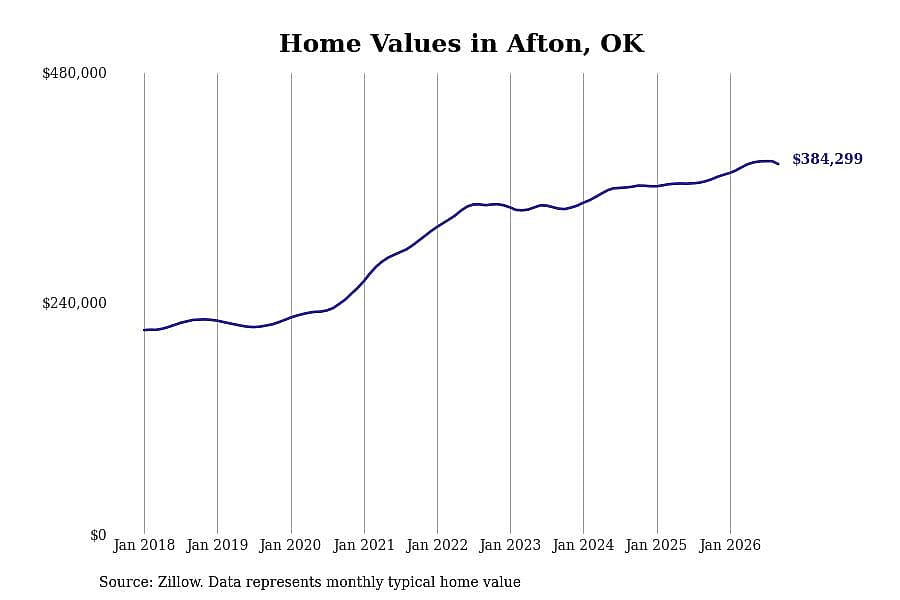
28 / 30- Typical home value: $384,299
- 1-year price change: +4.9%
- 5-year price change: +28.2%
- Metro area: Miami, OK
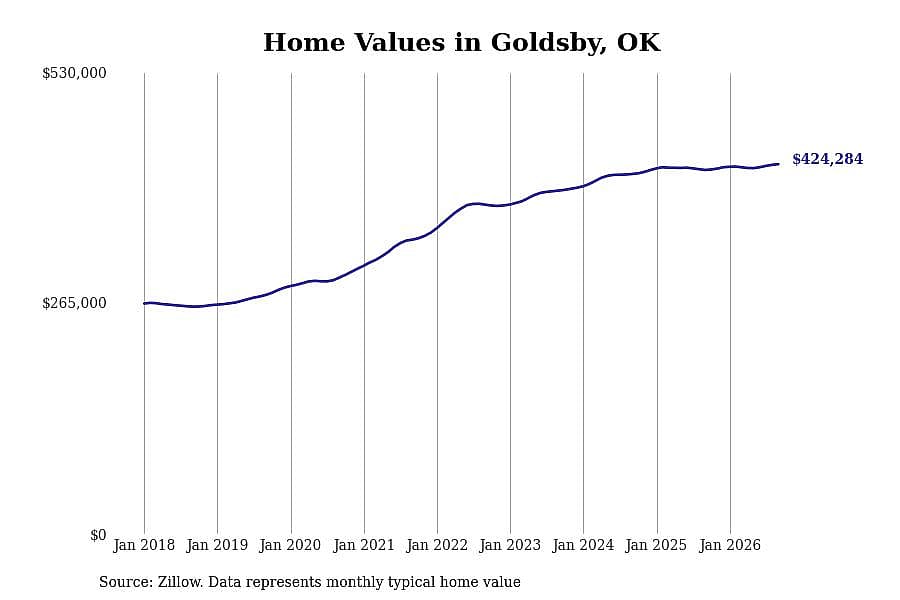
Stacker
29 / 30- Typical home value: $424,284
- 1-year price change: +1.6%
- 5-year price change: +25.7%
- Metro area: Oklahoma City, OK
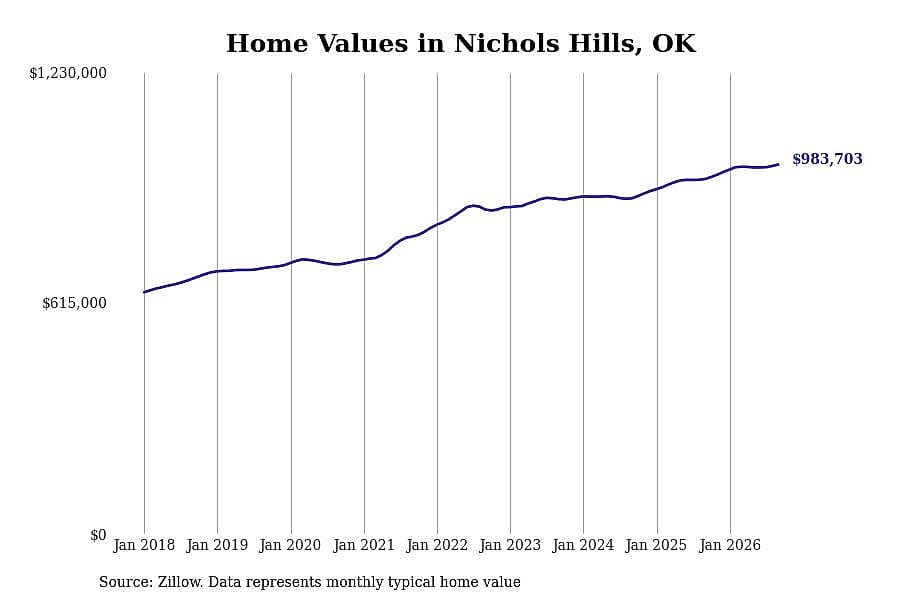
Stacker
30 / 30- Typical home value: $983,703
- 1-year price change: +4.1%
- 5-year price change: +24.2%
- Metro area: Oklahoma City, OK
You may also like: Best draft picks in Oklahoma City Thunder history



