Several factors contribute to cancer rates, from personal habits and genetics to air pollution or groundwater quality in a given area. People experiencing social, economic, or environmental disadvantages are disproportionately affected by high cancer rates in certain regions—including access or barriers to early screening and care.
Cancer rates also fluctuate by jobs: Higher rates of cancer can be found among meat industry and rubber manufacturing workers, and farmers.
Stacker compiled the counties with the highest cancer rates in Oklahoma using data from the CDC. Keep reading to see where in your state cancer cases are the most common.
You may also like: See how popular pumpkin spice is in Oklahoma
#50. Love County
- Cancer rate per 100,000, 2016-2020: 543.1
- Age-adjusted rate per 100,000, 2016-2020: 410.3
Kit Leong // Shutterstock
2 / 50#49. Woods County
- Cancer rate per 100,000, 2016-2020: 545.2
- Age-adjusted rate per 100,000, 2016-2020: 442.5
#48. Greer County
- Cancer rate per 100,000, 2016-2020: 545.7
- Age-adjusted rate per 100,000, 2016-2020: 433.6
Andrey Bayda // Shutterstock
4 / 50#47. Washita County
- Cancer rate per 100,000, 2016-2020: 545.9
- Age-adjusted rate per 100,000, 2016-2020: 417.9
#45. Osage County
- Cancer rate per 100,000, 2016-2020: 555.7
- Age-adjusted rate per 100,000, 2016-2020: 384.4
#44. Hughes County
- Cancer rate per 100,000, 2016-2020: 560.9
- Age-adjusted rate per 100,000, 2016-2020: 429.6
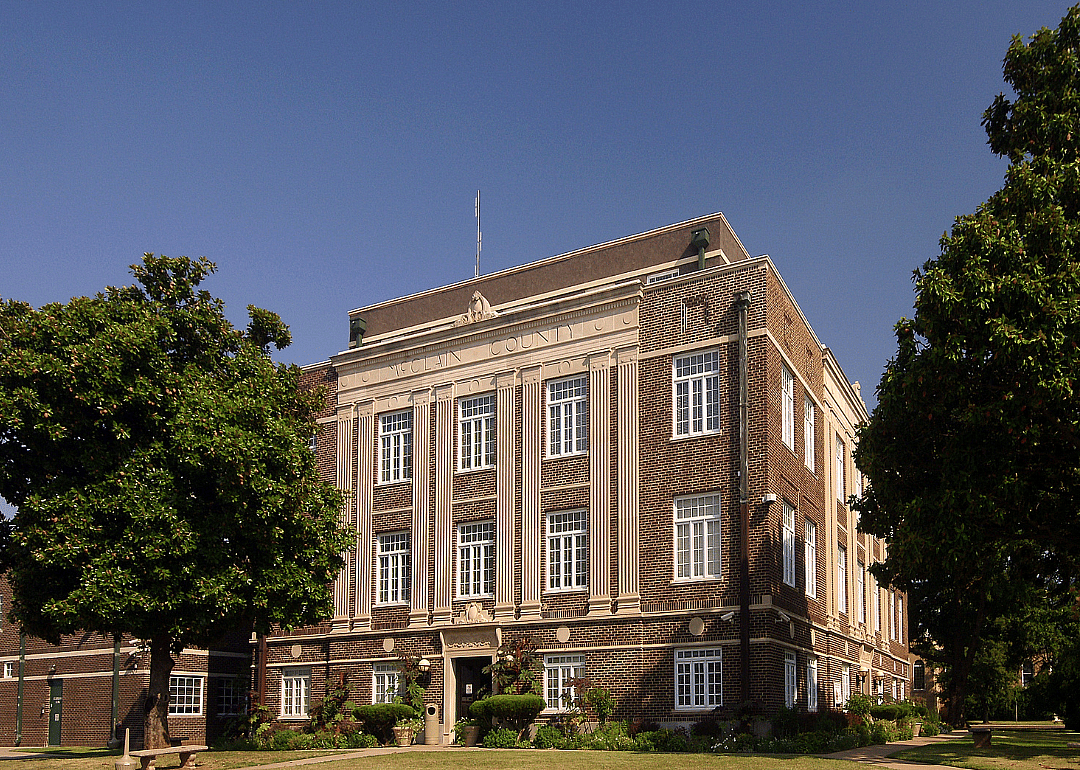
#43. McClain County
- Cancer rate per 100,000, 2016-2020: 564.6
- Age-adjusted rate per 100,000, 2016-2020: 477.1
SevenMaps // Shutterstock
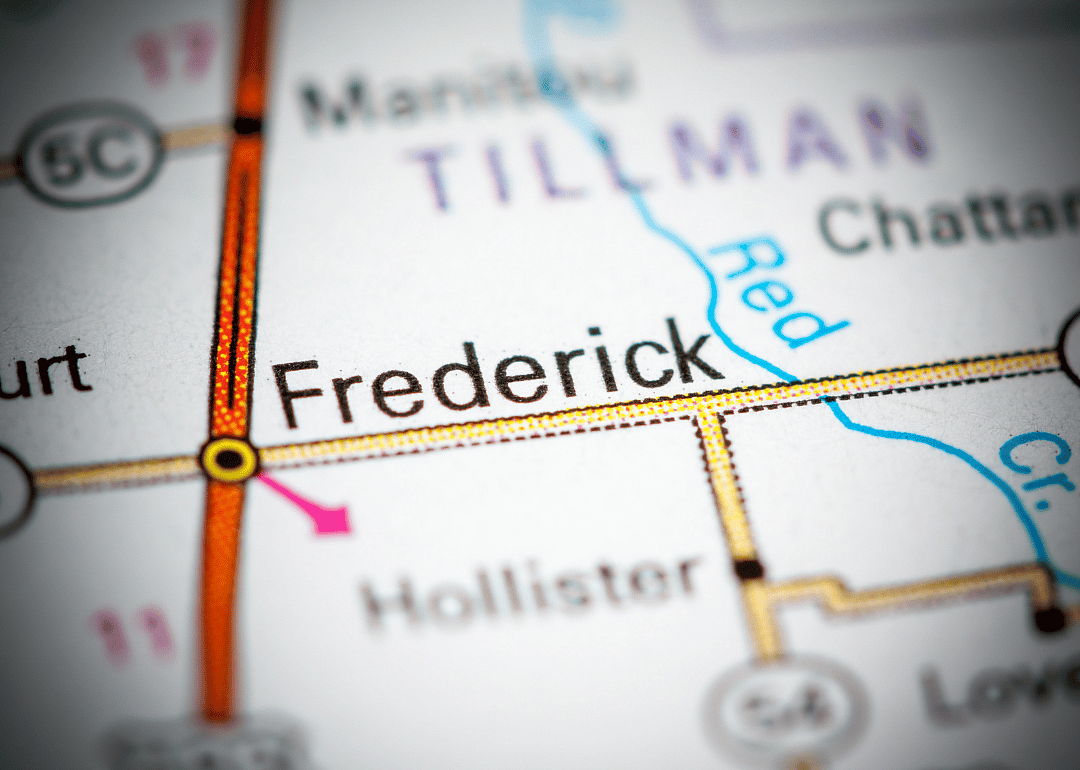
9 / 50#42. Tillman County
- Cancer rate per 100,000, 2016-2020: 566.2
- Age-adjusted rate per 100,000, 2016-2020: 420.7
Sabrina Janelle Gordon // Shutterstock
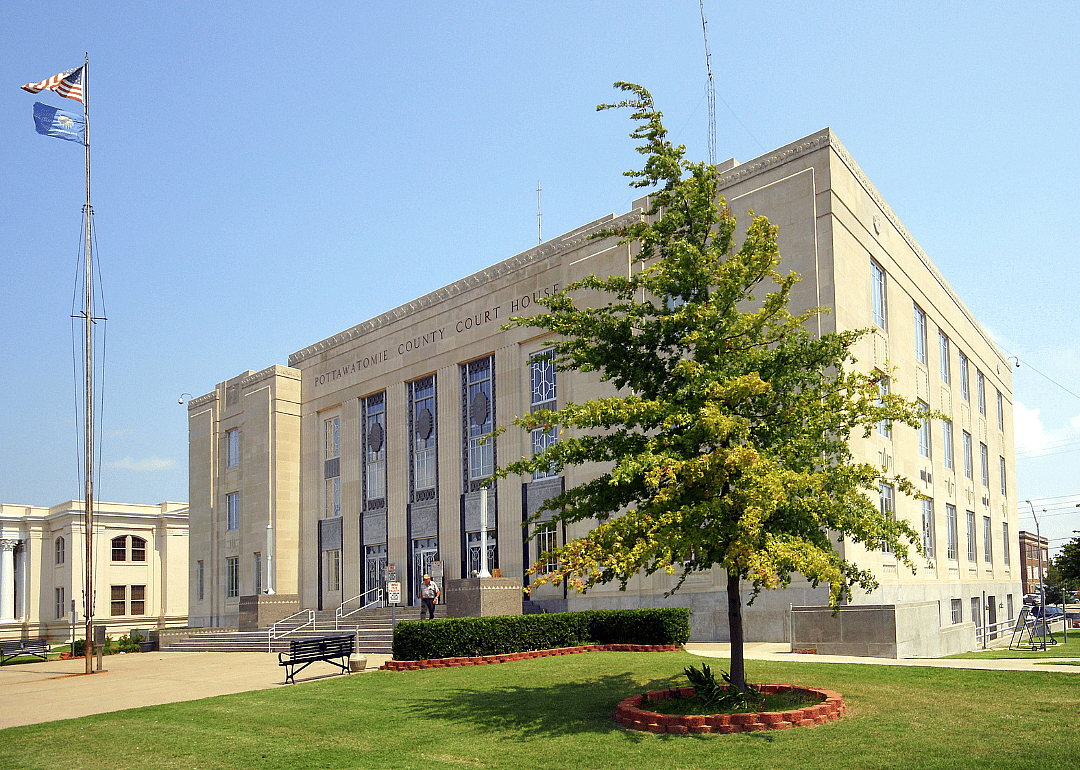
10 / 50#40. Pottawatomie County
- Cancer rate per 100,000, 2016-2020: 567.6
- Age-adjusted rate per 100,000, 2016-2020: 468.9
#39. Le Flore County
- Cancer rate per 100,000, 2016-2020: 572.4
- Age-adjusted rate per 100,000, 2016-2020: 449.0
#38. Rogers County
- Cancer rate per 100,000, 2016-2020: 576.2
- Age-adjusted rate per 100,000, 2016-2020: 464.4
#37. Dewey County
- Cancer rate per 100,000, 2016-2020: 581.3
- Age-adjusted rate per 100,000, 2016-2020: 436.9
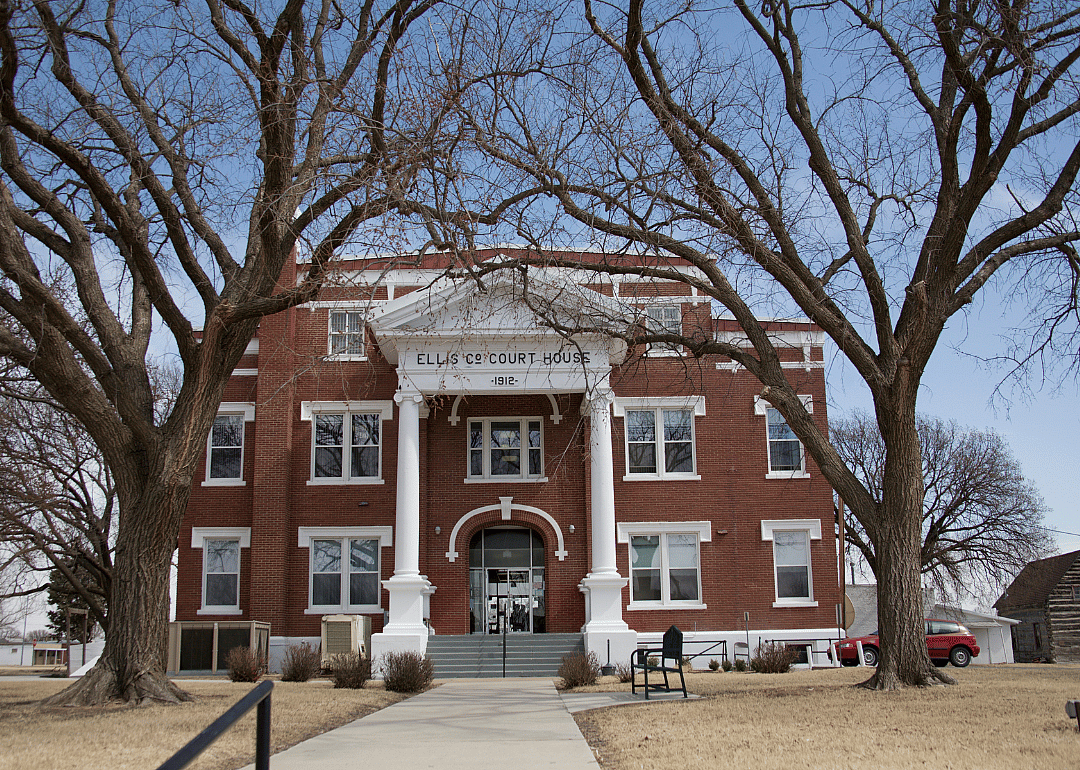
#35. Ellis County
- Cancer rate per 100,000, 2016-2020: 584.3
- Age-adjusted rate per 100,000, 2016-2020: 381.1
#34. Cotton County
- Cancer rate per 100,000, 2016-2020: 584.5
- Age-adjusted rate per 100,000, 2016-2020: 403.9
#33. Muskogee County
- Cancer rate per 100,000, 2016-2020: 586.7
- Age-adjusted rate per 100,000, 2016-2020: 471.4
#32. Johnston County
- Cancer rate per 100,000, 2016-2020: 587.6
- Age-adjusted rate per 100,000, 2016-2020: 439.6
Vineyard Perspective // Shutterstock
20 / 50#30. Noble County
- Cancer rate per 100,000, 2016-2020: 594.9
- Age-adjusted rate per 100,000, 2016-2020: 435.1
#29. Pittsburg County
- Cancer rate per 100,000, 2016-2020: 599.7
- Age-adjusted rate per 100,000, 2016-2020: 439.7
#28. Delaware County
- Cancer rate per 100,000, 2016-2020: 607.4
- Age-adjusted rate per 100,000, 2016-2020: 381.6
#27. Harmon County
- Cancer rate per 100,000, 2016-2020: 608.2
- Age-adjusted rate per 100,000, 2016-2020: 439.3
#25. Okfuskee County
- Cancer rate per 100,000, 2016-2020: 609.0
- Age-adjusted rate per 100,000, 2016-2020: 452.7
#24. Washington County
- Cancer rate per 100,000, 2016-2020: 611.2
- Age-adjusted rate per 100,000, 2016-2020: 450.9
Richard G Smith // Shutterstock
28 / 50#23. Blaine County
- Cancer rate per 100,000, 2016-2020: 617.6
- Age-adjusted rate per 100,000, 2016-2020: 442.3
Roberto Galan // Shutterstock
29 / 50#22. Grant County
- Cancer rate per 100,000, 2016-2020: 618.0
- Age-adjusted rate per 100,000, 2016-2020: 460.8
#20. McCurtain County
- Cancer rate per 100,000, 2016-2020: 620.4
- Age-adjusted rate per 100,000, 2016-2020: 482.7
#19. Ottawa County
- Cancer rate per 100,000, 2016-2020: 638.0
- Age-adjusted rate per 100,000, 2016-2020: 500.8
RaksyBH // Shutterstock
33 / 50#18. Harper County
- Cancer rate per 100,000, 2016-2020: 638.1
- Age-adjusted rate per 100,000, 2016-2020: 439.3
#17. Roger Mills County
- Cancer rate per 100,000, 2016-2020: 638.2
- Age-adjusted rate per 100,000, 2016-2020: 479.0
Sabrina Janelle Gordon // Shutterstock
35 / 50Mohammad Fuad Anshori // Shutterstock
36 / 50#15. Stephens County
- Cancer rate per 100,000, 2016-2020: 647.0
- Age-adjusted rate per 100,000, 2016-2020: 464.8
#14. Kiowa County
- Cancer rate per 100,000, 2016-2020: 648.8
- Age-adjusted rate per 100,000, 2016-2020: 478.2
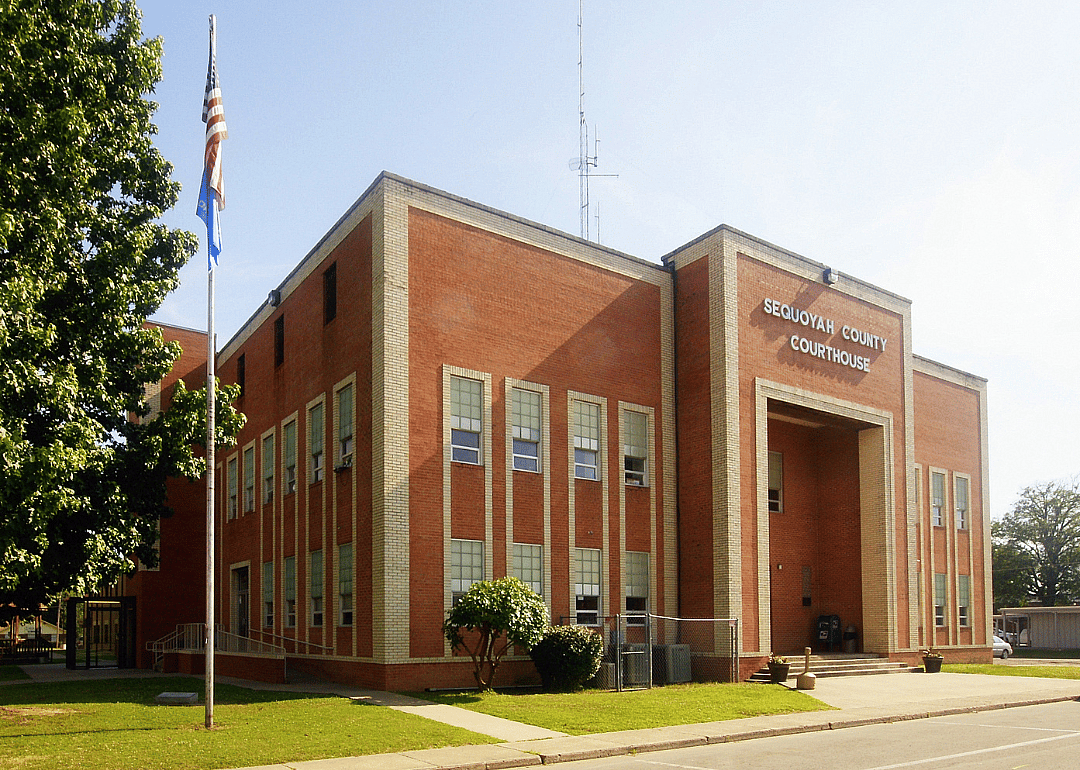
#13. Sequoyah County
- Cancer rate per 100,000, 2016-2020: 649.1
- Age-adjusted rate per 100,000, 2016-2020: 496.1
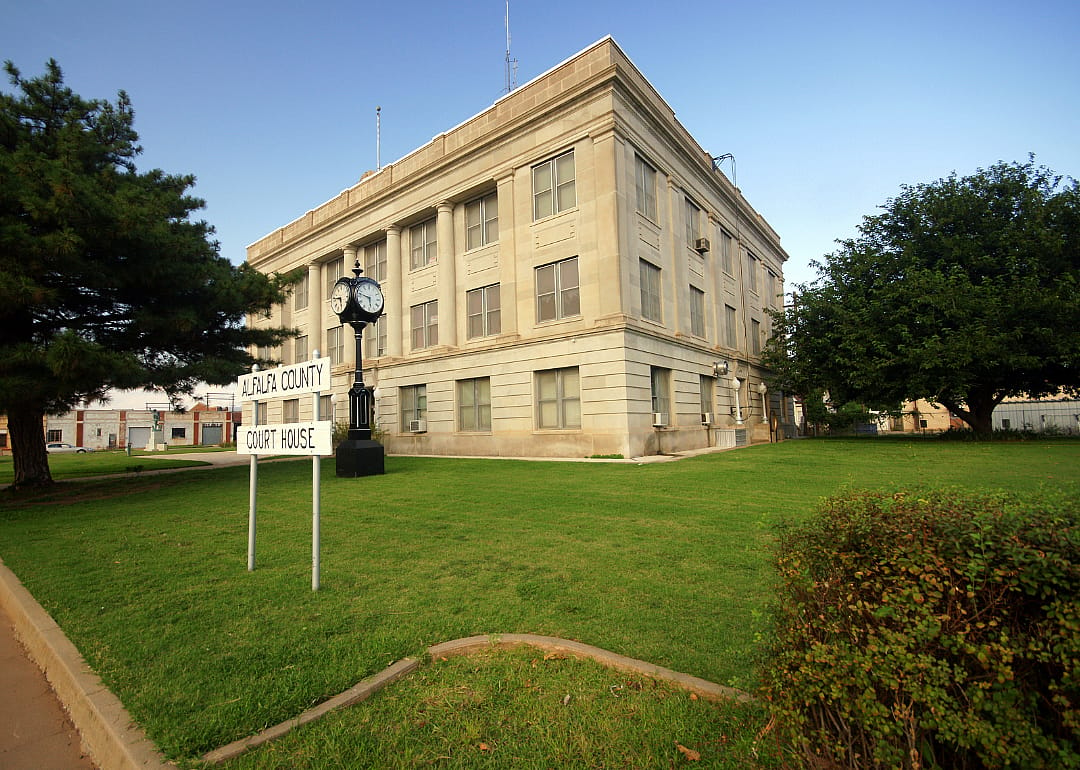
#12. Alfalfa County
- Cancer rate per 100,000, 2016-2020: 649.3
- Age-adjusted rate per 100,000, 2016-2020: 451.4
RaksyBH // Shutterstock
41 / 50#10. Choctaw County
- Cancer rate per 100,000, 2016-2020: 654.6
- Age-adjusted rate per 100,000, 2016-2020: 460.7
#9. Okmulgee County
- Cancer rate per 100,000, 2016-2020: 657.8
- Age-adjusted rate per 100,000, 2016-2020: 503.5
Charles Lemar Brown // Shutterstock
43 / 50#8. Jefferson County
- Cancer rate per 100,000, 2016-2020: 660.7
- Age-adjusted rate per 100,000, 2016-2020: 463.9
#7. Kay County
- Cancer rate per 100,000, 2016-2020: 668.9
- Age-adjusted rate per 100,000, 2016-2020: 504.2
#5. Nowata County
- Cancer rate per 100,000, 2016-2020: 679.5
- Age-adjusted rate per 100,000, 2016-2020: 472.3
#4. Craig County
- Cancer rate per 100,000, 2016-2020: 682.3
- Age-adjusted rate per 100,000, 2016-2020: 487.1
JohnDSmith // Shutterstock
48 / 50#3. McIntosh County
- Cancer rate per 100,000, 2016-2020: 691.2
- Age-adjusted rate per 100,000, 2016-2020: 416.0
#2. Pushmataha County
- Cancer rate per 100,000, 2016-2020: 723.7
- Age-adjusted rate per 100,000, 2016-2020: 486.8