Several factors contribute to cancer rates, from personal habits and genetics to air pollution or groundwater quality in a given area. People experiencing social, economic, or environmental disadvantages are disproportionately affected by high cancer rates in certain regions—including access or barriers to early screening and care.
Cancer rates also fluctuate by jobs: Higher rates of cancer can be found among meat industry and rubber manufacturing workers, and farmers.
Stacker compiled the counties with the highest cancer rates in Oregon using data from the CDC. Keep reading to see where in your state cancer cases are the most common.
You may also like: Best NFL players born in Oregon
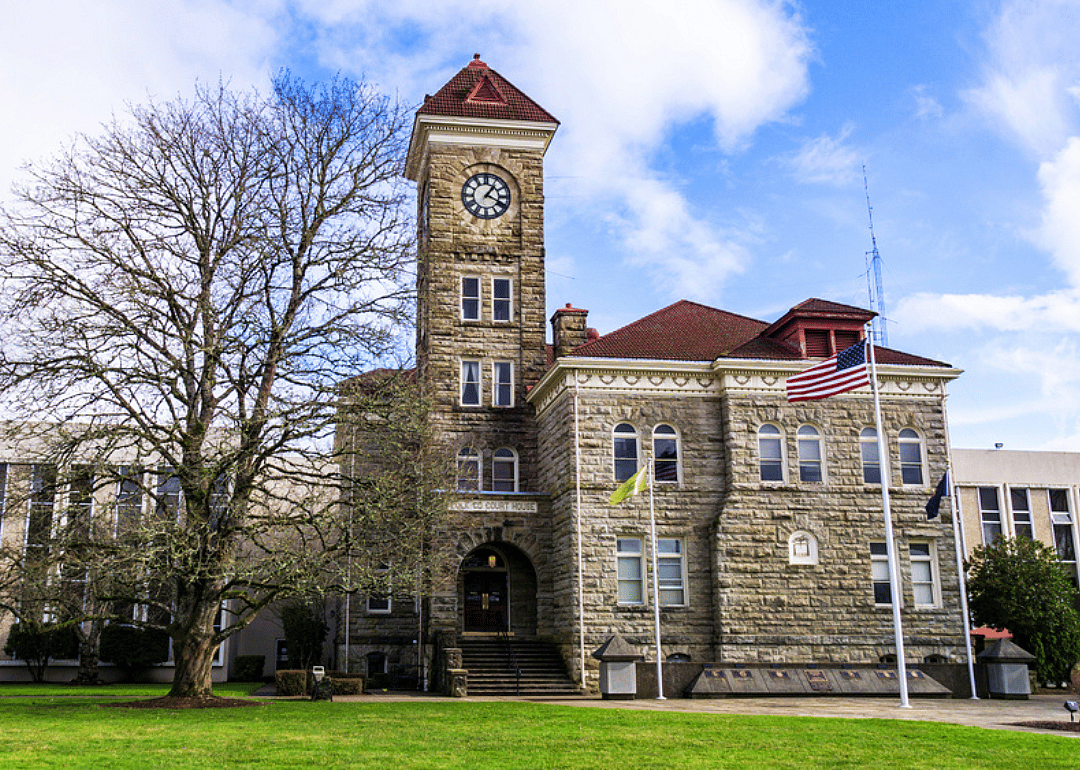
cpaulfell // Shutterstock
1 / 36#36. Benton County
- Cancer rate per 100,000, 2016-2020: 398.2
- Age-adjusted rate per 100,000, 2016-2020: 346.5
Hugh K Telleria // Shutterstock
2 / 36#35. Malheur County
- Cancer rate per 100,000, 2016-2020: 414.6
- Age-adjusted rate per 100,000, 2016-2020: 347.1
Bob Pool // Shutterstock
3 / 36#34. Umatilla County
- Cancer rate per 100,000, 2016-2020: 438.7
- Age-adjusted rate per 100,000, 2016-2020: 377.3
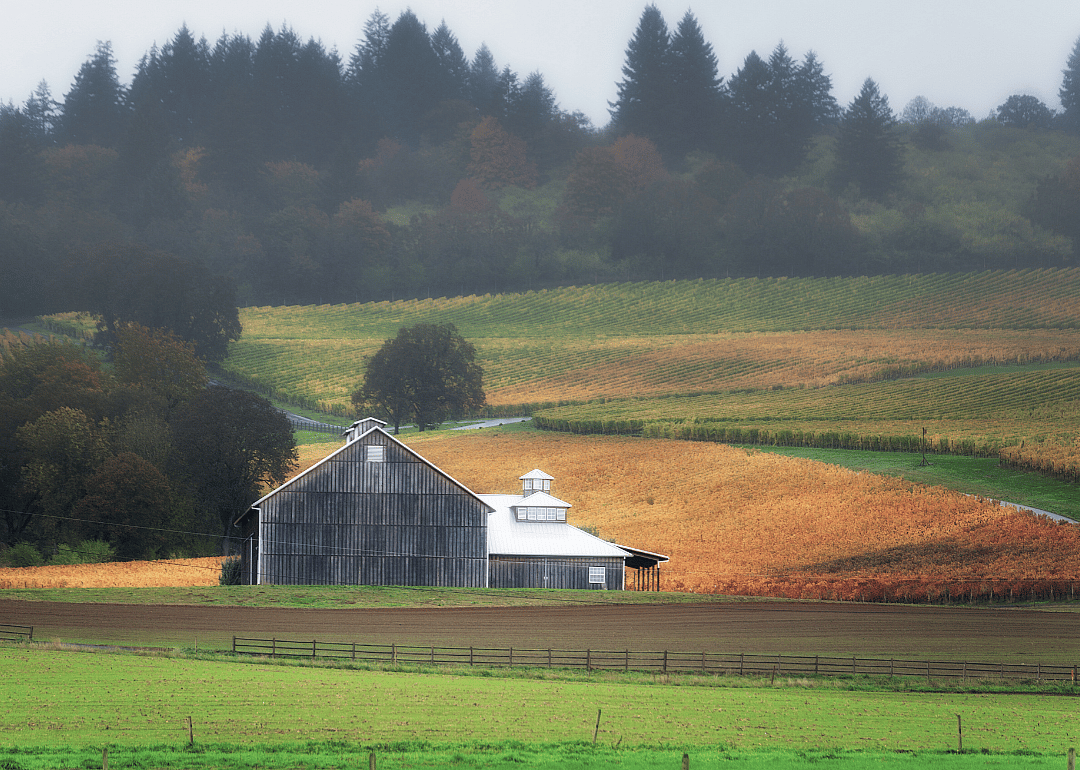
Yanqiang Dai // Shutterstock
4 / 36#33. Washington County
- Cancer rate per 100,000, 2016-2020: 439.1
- Age-adjusted rate per 100,000, 2016-2020: 411.0
#31. Baker County
- Cancer rate per 100,000, 2016-2020: 469.9
- Age-adjusted rate per 100,000, 2016-2020: 282.4
Josemaria Toscano // Shutterstock
7 / 36#30. Multnomah County
- Cancer rate per 100,000, 2016-2020: 480.7
- Age-adjusted rate per 100,000, 2016-2020: 445.5
Bob Pool // Shutterstock
8 / 36#29. Morrow County
- Cancer rate per 100,000, 2016-2020: 491.9
- Age-adjusted rate per 100,000, 2016-2020: 396.1
Arpad Jasko // Shutterstock
9 / 36#28. Gilliam County
- Cancer rate per 100,000, 2016-2020: 506.3
- Age-adjusted rate per 100,000, 2016-2020: 292.1
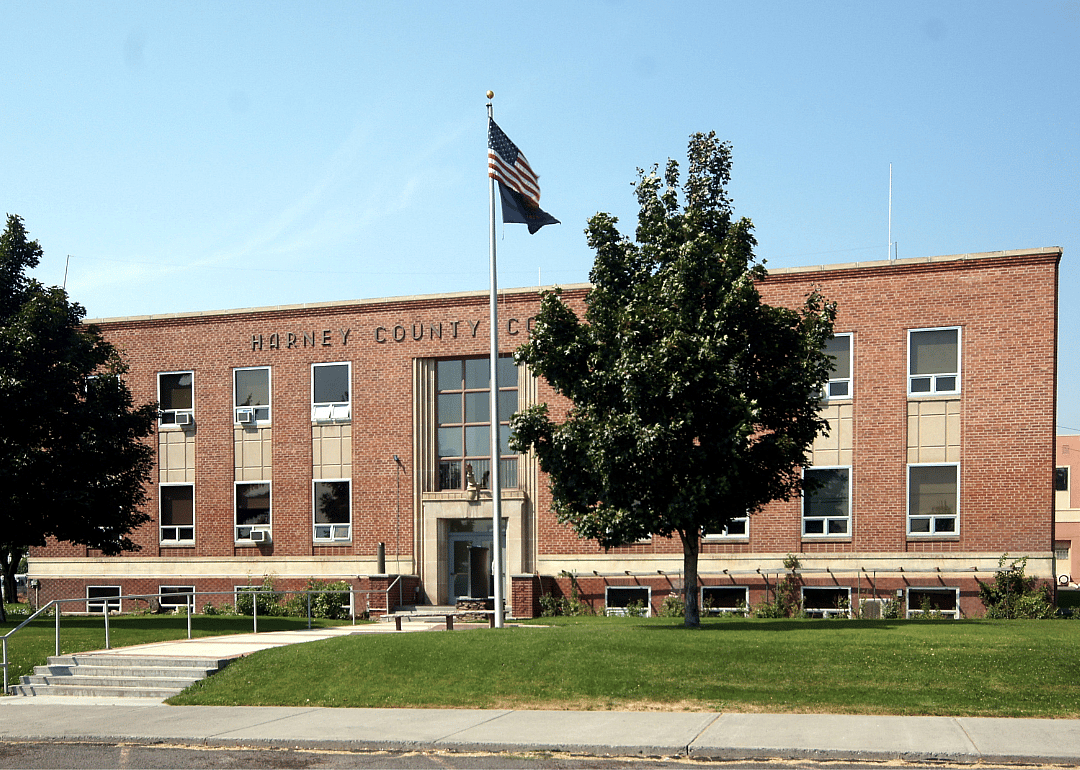
#26. Harney County
- Cancer rate per 100,000, 2016-2020: 525.3
- Age-adjusted rate per 100,000, 2016-2020: 330.7
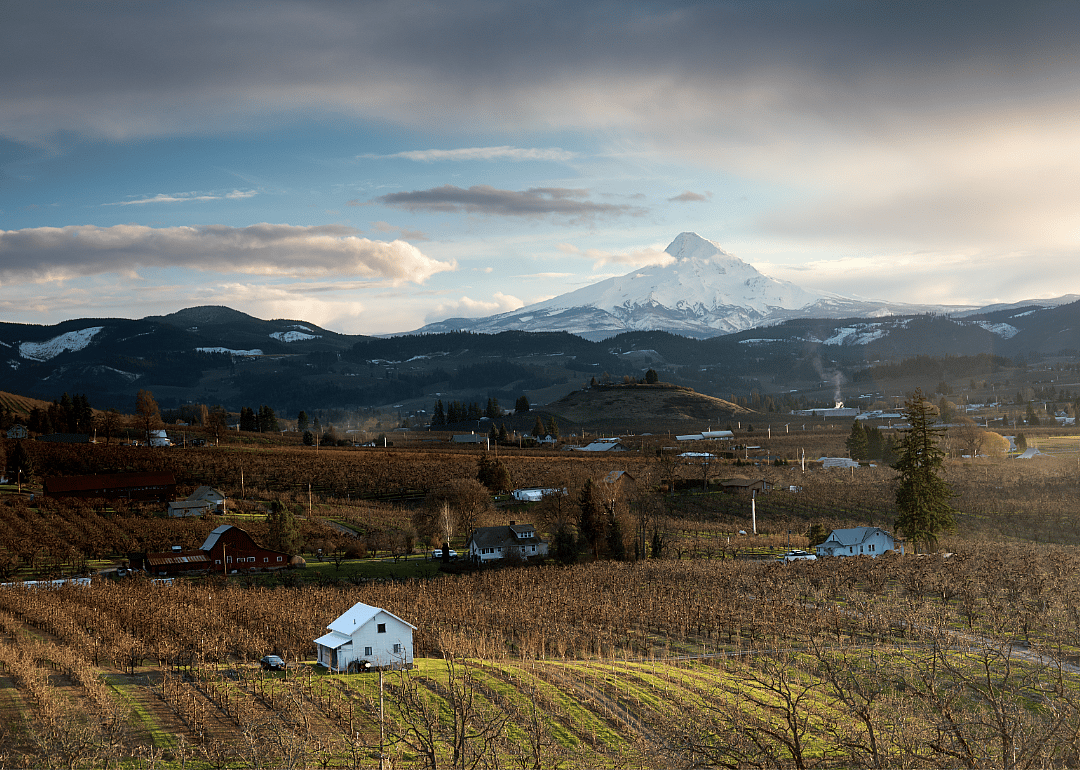
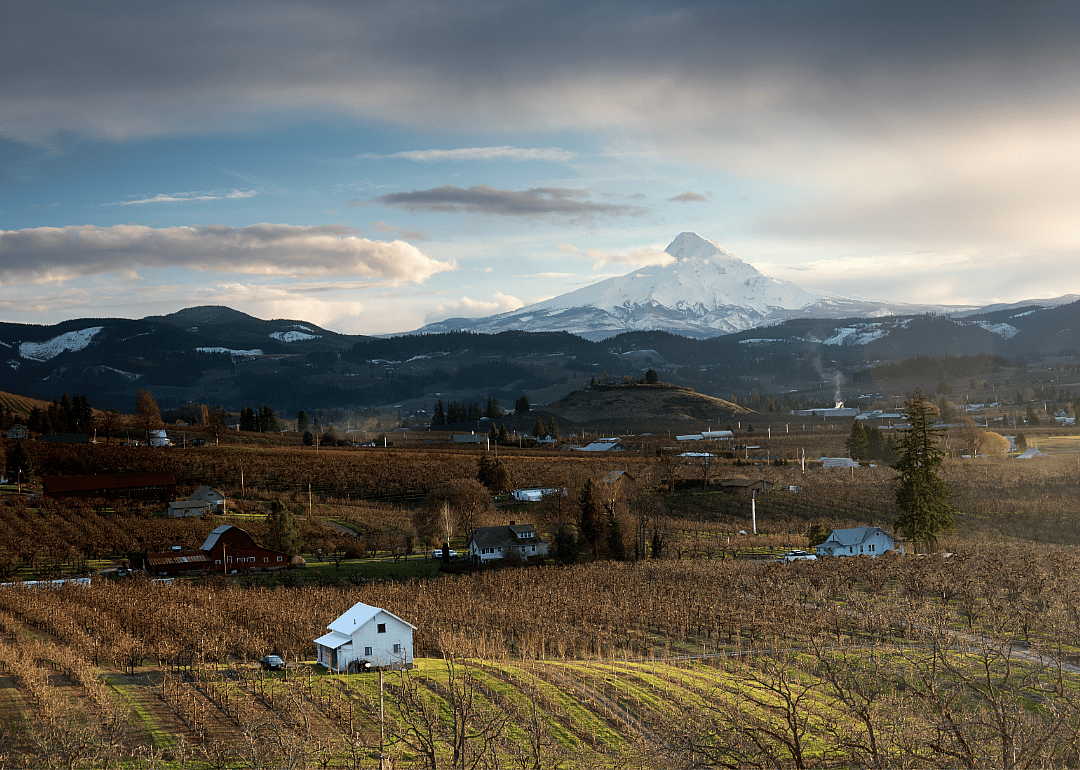
#25. Hood River County
- Cancer rate per 100,000, 2016-2020: 533.7
- Age-adjusted rate per 100,000, 2016-2020: 442.7
#24. Linn County
- Cancer rate per 100,000, 2016-2020: 539.1
- Age-adjusted rate per 100,000, 2016-2020: 404.2
Cynthia Liang // Shutterstock
14 / 36#23. Polk County
- Cancer rate per 100,000, 2016-2020: 539.6
- Age-adjusted rate per 100,000, 2016-2020: 433.5
#21. Jefferson County
- Cancer rate per 100,000, 2016-2020: 546.4
- Age-adjusted rate per 100,000, 2016-2020: 403.9
#20. Union County
- Cancer rate per 100,000, 2016-2020: 553.2
- Age-adjusted rate per 100,000, 2016-2020: 401.2
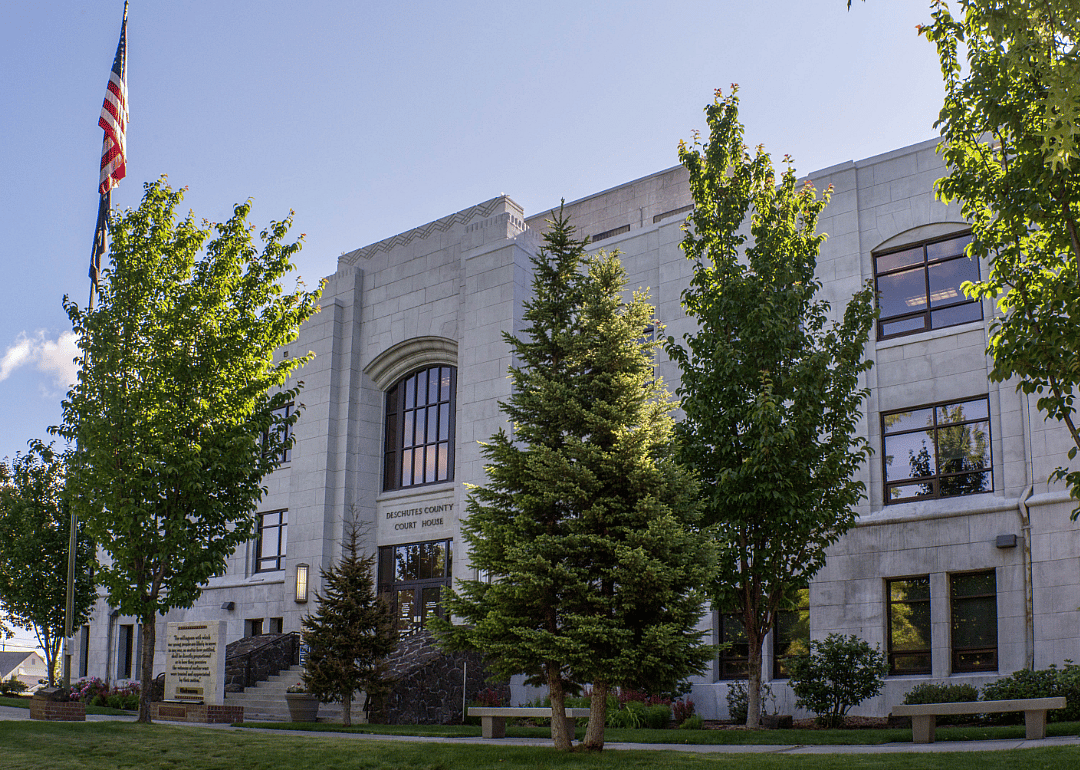
#19. Deschutes County
- Cancer rate per 100,000, 2016-2020: 570.4
- Age-adjusted rate per 100,000, 2016-2020: 410.9
#18. Clackamas County
- Cancer rate per 100,000, 2016-2020: 582.4
- Age-adjusted rate per 100,000, 2016-2020: 443.8
#16. Klamath County
- Cancer rate per 100,000, 2016-2020: 634.9
- Age-adjusted rate per 100,000, 2016-2020: 444.3
kenneth korb // Shutterstock
22 / 36#15. Columbia County
- Cancer rate per 100,000, 2016-2020: 635.1
- Age-adjusted rate per 100,000, 2016-2020: 453.0
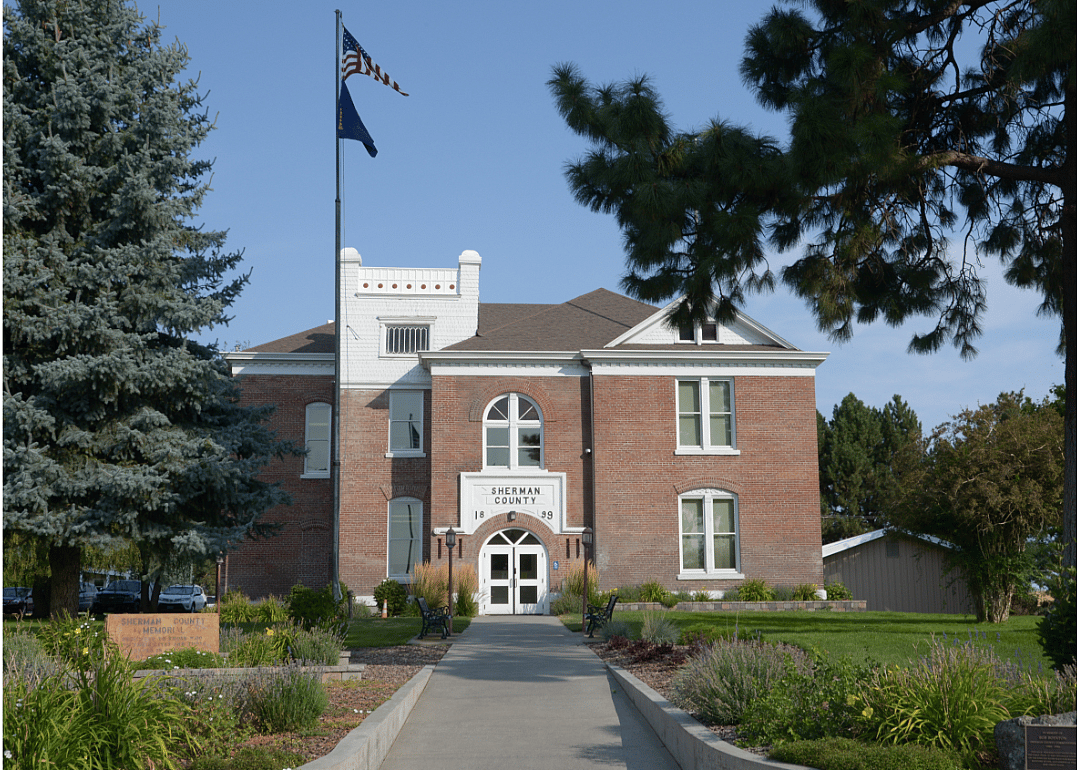
#14. Sherman County
- Cancer rate per 100,000, 2016-2020: 640.4
- Age-adjusted rate per 100,000, 2016-2020: 374.1
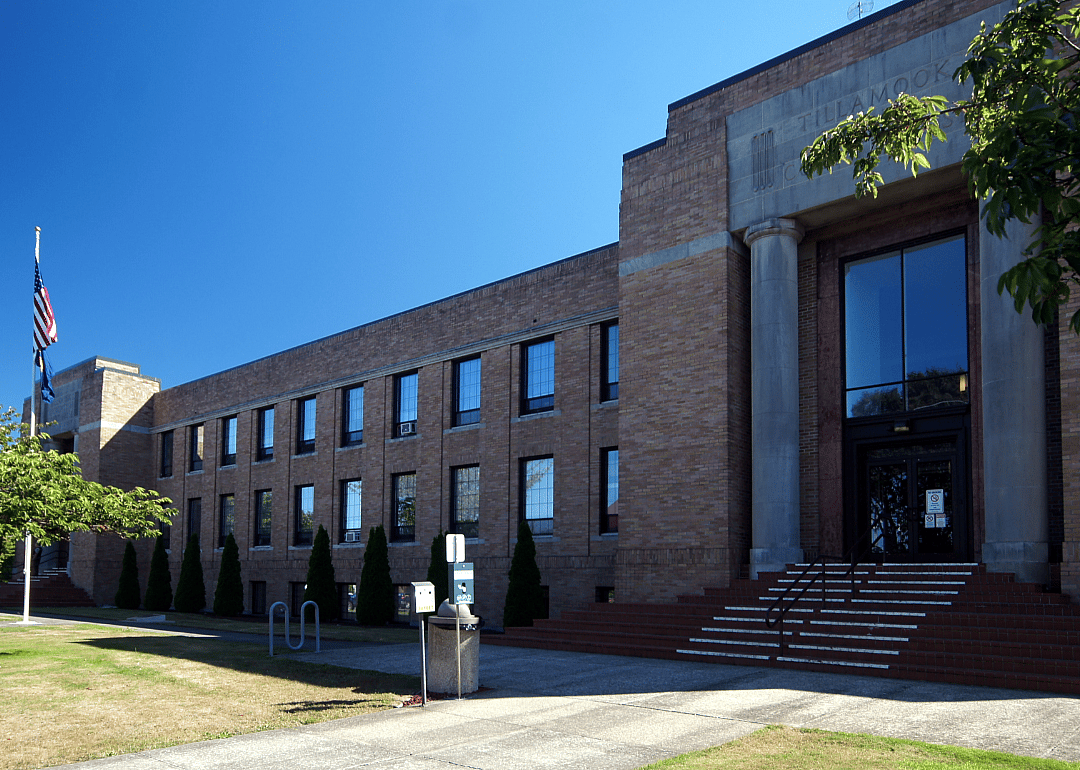
#13. Tillamook County
- Cancer rate per 100,000, 2016-2020: 650.4
- Age-adjusted rate per 100,000, 2016-2020: 395.5
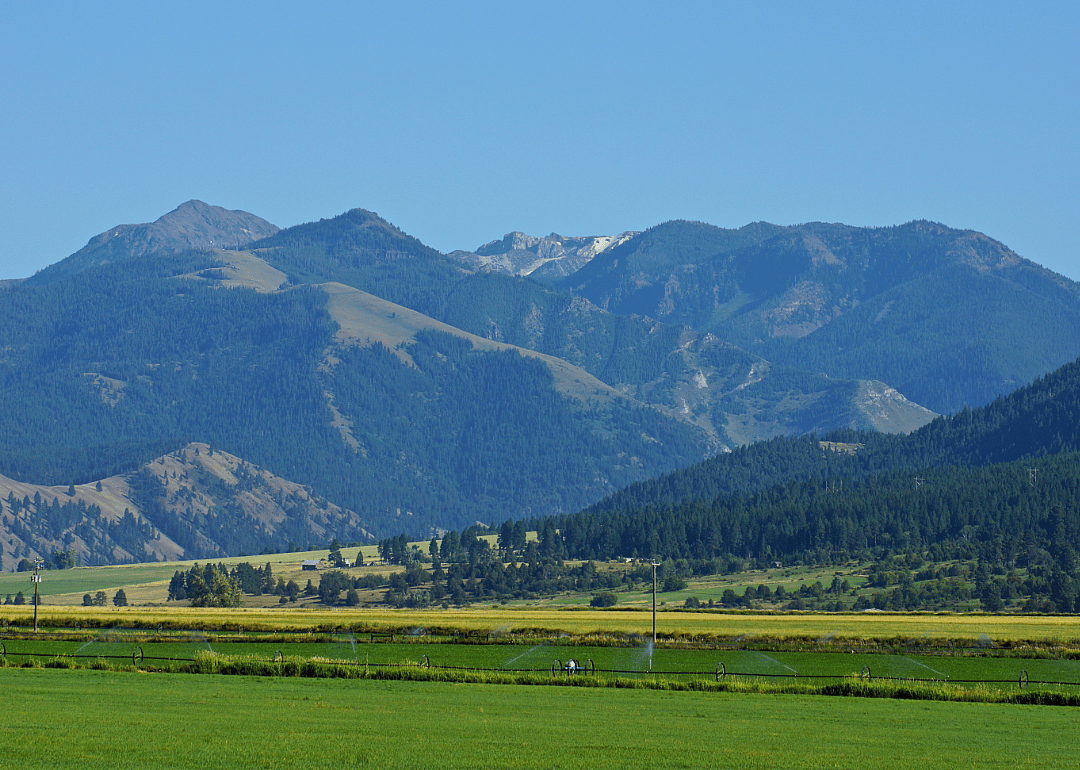
#11. Wallowa County
- Cancer rate per 100,000, 2016-2020: 654.0
- Age-adjusted rate per 100,000, 2016-2020: 367.6
Dee Browning // Shutterstock
27 / 36#10. Grant County
- Cancer rate per 100,000, 2016-2020: 660.7
- Age-adjusted rate per 100,000, 2016-2020: 353.7
#9. Douglas County
- Cancer rate per 100,000, 2016-2020: 667.0
- Age-adjusted rate per 100,000, 2016-2020: 409.0
#8. Lincoln County
- Cancer rate per 100,000, 2016-2020: 708.6
- Age-adjusted rate per 100,000, 2016-2020: 386.7
#6. Coos County
- Cancer rate per 100,000, 2016-2020: 719.9
- Age-adjusted rate per 100,000, 2016-2020: 423.3
Dominic Gentilcore PhD // Shutterstock
32 / 36#5. Lake County
- Cancer rate per 100,000, 2016-2020: 739.7
- Age-adjusted rate per 100,000, 2016-2020: 439.1
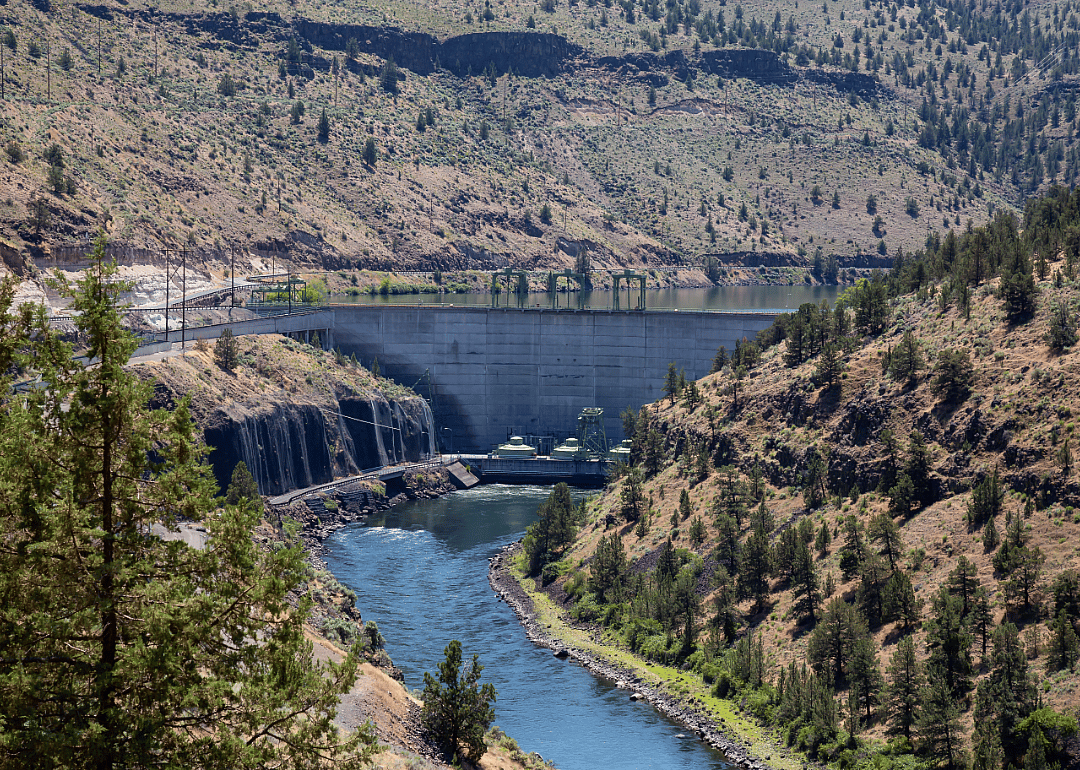
#4. Crook County
- Cancer rate per 100,000, 2016-2020: 766.0
- Age-adjusted rate per 100,000, 2016-2020: 472.3
Bob Pool // Shutterstock
34 / 36#3. Josephine County
- Cancer rate per 100,000, 2016-2020: 787.2
- Age-adjusted rate per 100,000, 2016-2020: 465.1
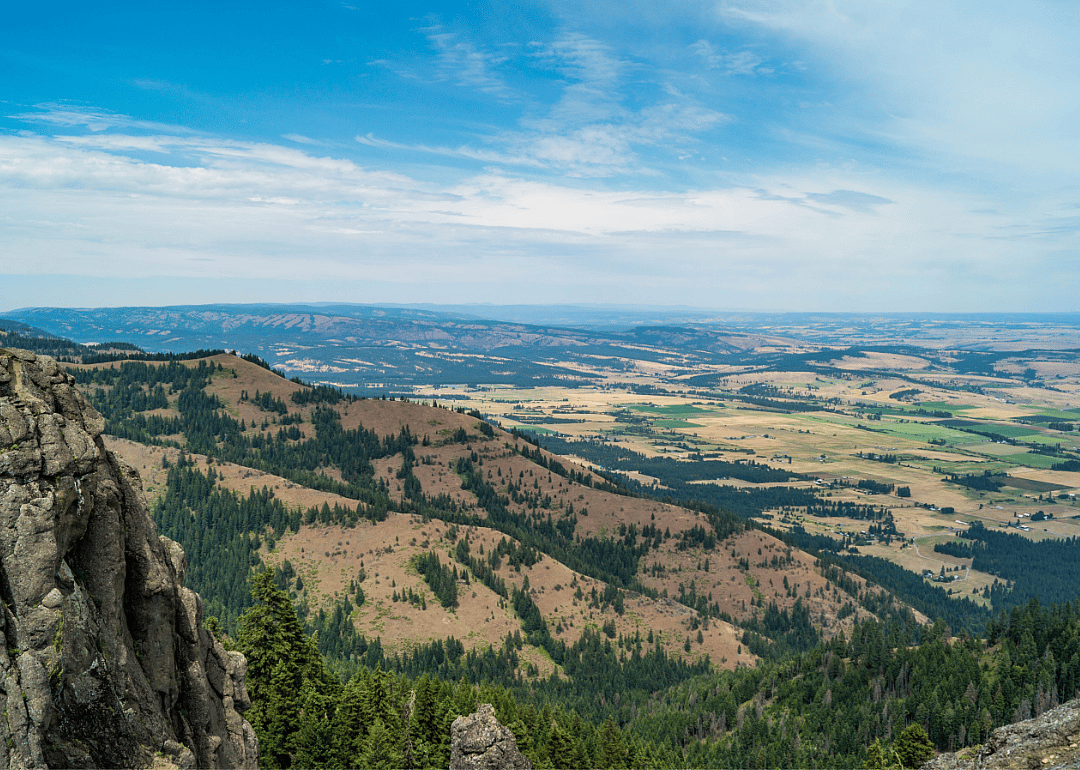
Manuela Durson // Shutterstock
35 / 36Tomas Nevesely // Shutterstock
36 / 36#1. Wheeler County
- Cancer rate per 100,000, 2016-2020: 989.8
- Age-adjusted rate per 100,000, 2016-2020: 471.5