Most common domestic destinations from Mahlon Sweet Field Airport

·Stacker

Canva
Canva

Air travel looks very different now than it did just a few years ago when the coronavirus pandemic grounded folks around the world, putting a halt to travel for both leisure and business.

In 2020, passenger traffic on U.S. airlines was at its lowest since the mid-1980s, with just 369 million passengers. In 2021, the U.S. started to get back to more normal air travel levels, and by 2022, the country was up to 853 million airline passengers. By the looks of it, 2023 is likely to outpace those numbers and return to pre-pandemic levels—nearly 3 million people flew in and out of U.S. airports daily as of April 2023, according to data from the Federal Aviation Administration's Air Traffic Organization.

When you're at the airport, shuffling around with your roller bag, backpack, neck pillow, and water bottle among the thousands of other passengers doing the same, you're probably not too concerned with more than your flight. Is it on time? Who will be sitting next to you? Did your checked bag make it onto the plane?

But when you're not in flight mode, you may be wondering where all of the other folks at your local airport are traveling to. To answer that question, Stacker compiled a list of the most common domestic flights from Mahlon Sweet Field using data from the Bureau of Transportation Statistics. Destinations are ranked by total passengers from October 2022 to September 2023.

Read on to find out if your flight patterns are similar to your fellow Mahlon Sweet Field travelers.

You may also like: Biggest sources of immigrants to Eugene

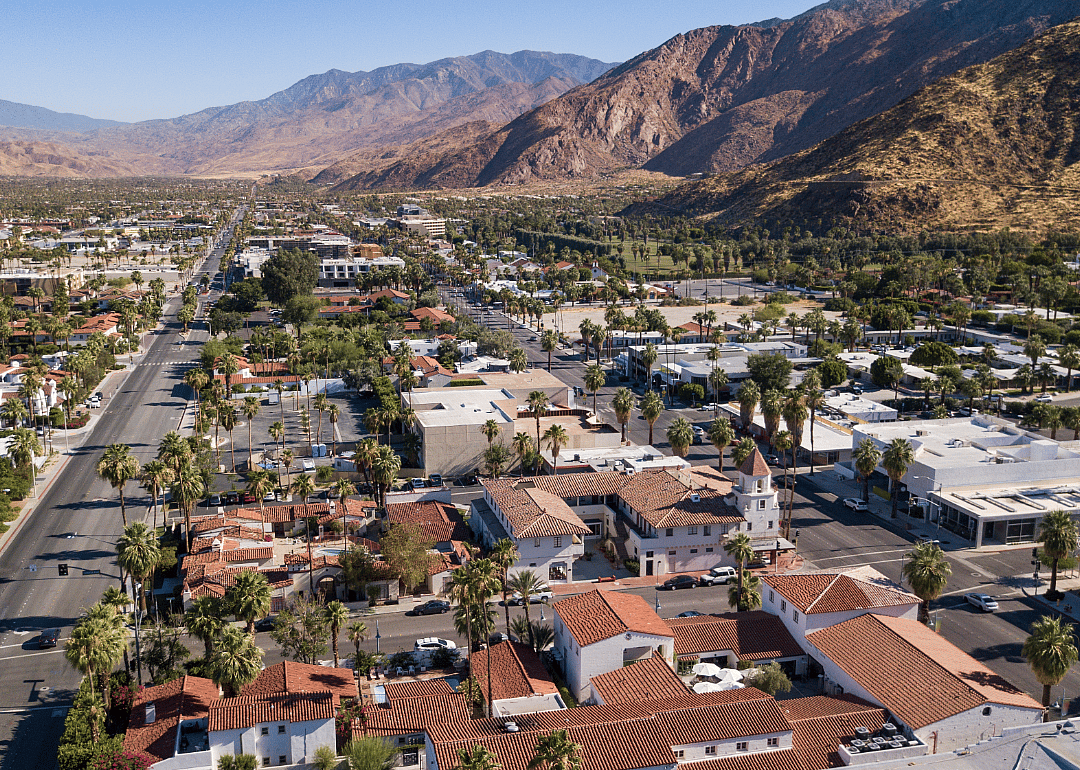
#15. Palm Springs International (Palm Springs, CA)

Canva

1 / 15

#15. Palm Springs International (Palm Springs, CA)

- Passengers: 5,515 (0.7% of all passengers)
- Top carriers:
--- #1. TEM Enterprises dba Avelo Airlines: 5,443
#14. John Wayne Airport-Orange County (Santa Ana, CA)

Canva

2 / 15

#14. John Wayne Airport-Orange County (Santa Ana, CA)

- Passengers: 11,558 (1.4% of all passengers)
- Top carriers:
--- #1. Allegiant Air: 9,946
--- #2. Southwest Airlines: 1,612
#13. San Diego International (San Diego, CA)

Dancestrokes // Shutterstock

3 / 15

#13. San Diego International (San Diego, CA)

- Passengers: 14,427 (1.8% of all passengers)
- Top carriers:
--- #1. SkyWest Airlines: 5,792
--- #2. Southwest Airlines: 3,785
--- #3. Allegiant Air: 3,020
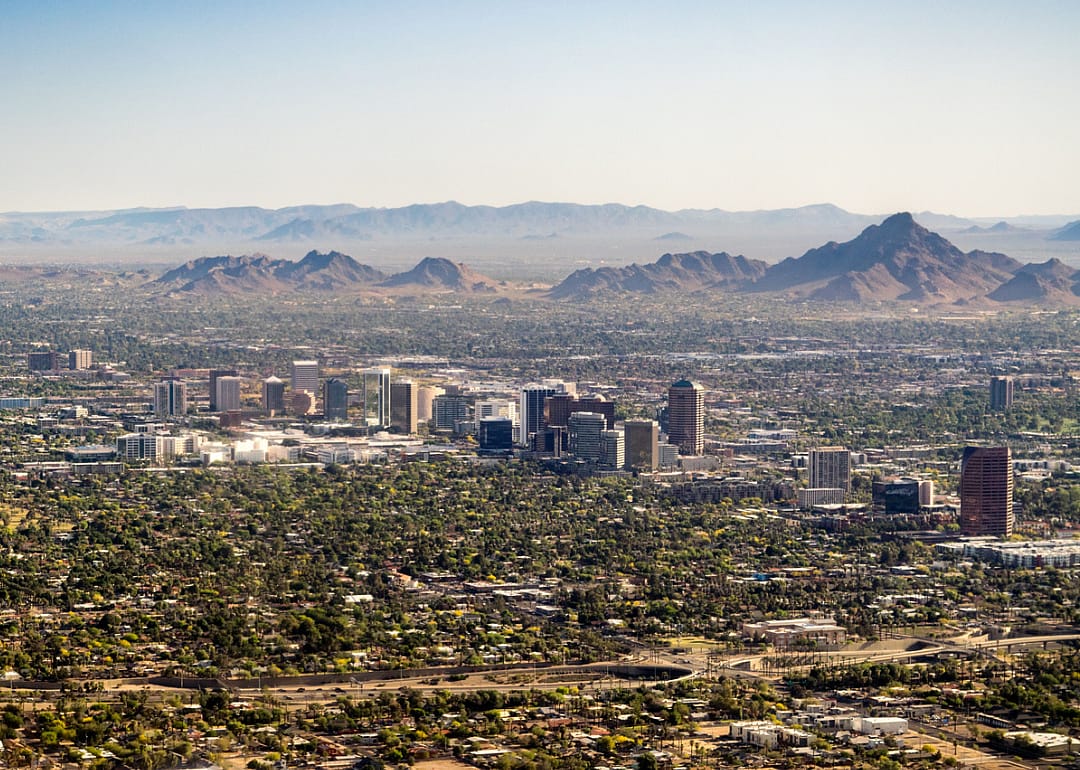
#12. Phoenix - Mesa Gateway (Phoenix, AZ)

Nate Hovee // Shutterstock

4 / 15

#12. Phoenix - Mesa Gateway (Phoenix, AZ)

- Passengers: 19,581 (2.4% of all passengers)
- Top carriers:
--- #1. Allegiant Air: 19,579
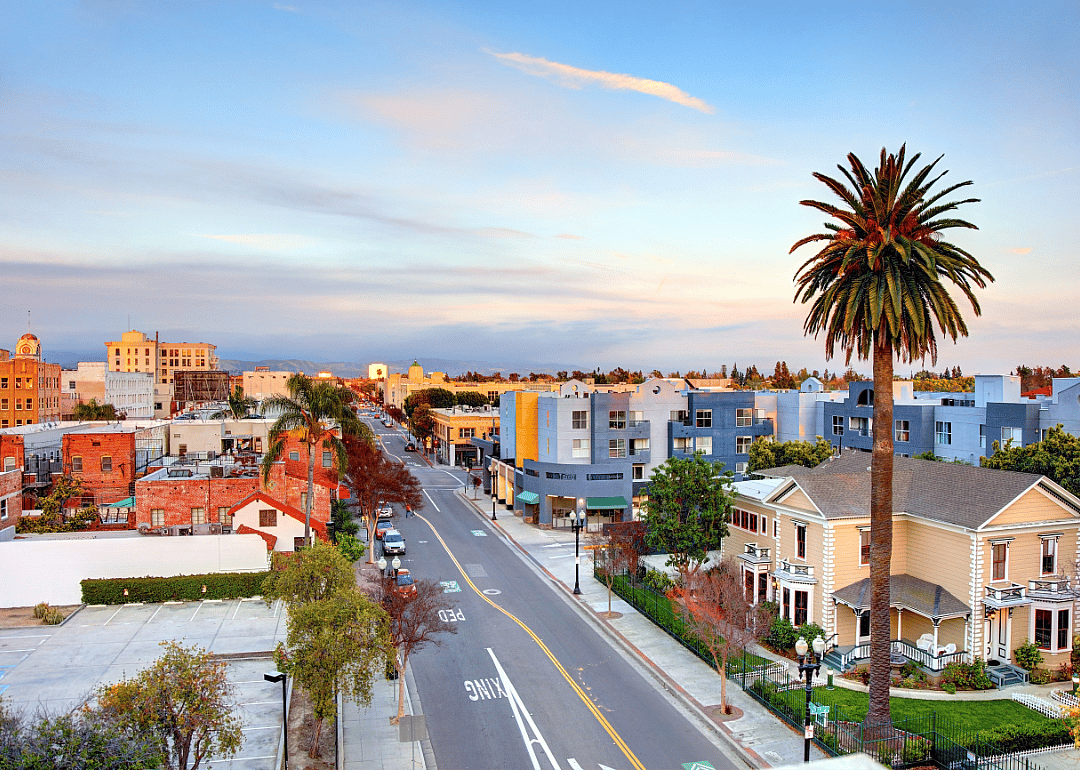
#10. Norman Y. Mineta San Jose International (San Jose, CA)

Uladzik Kryhin // Shutterstock

6 / 15

#10. Norman Y. Mineta San Jose International (San Jose, CA)

- Passengers: 36,680 (4.5% of all passengers)
- Top carriers:
--- #1. Southwest Airlines: 36,274
--- #2. Alaska Airlines: 326
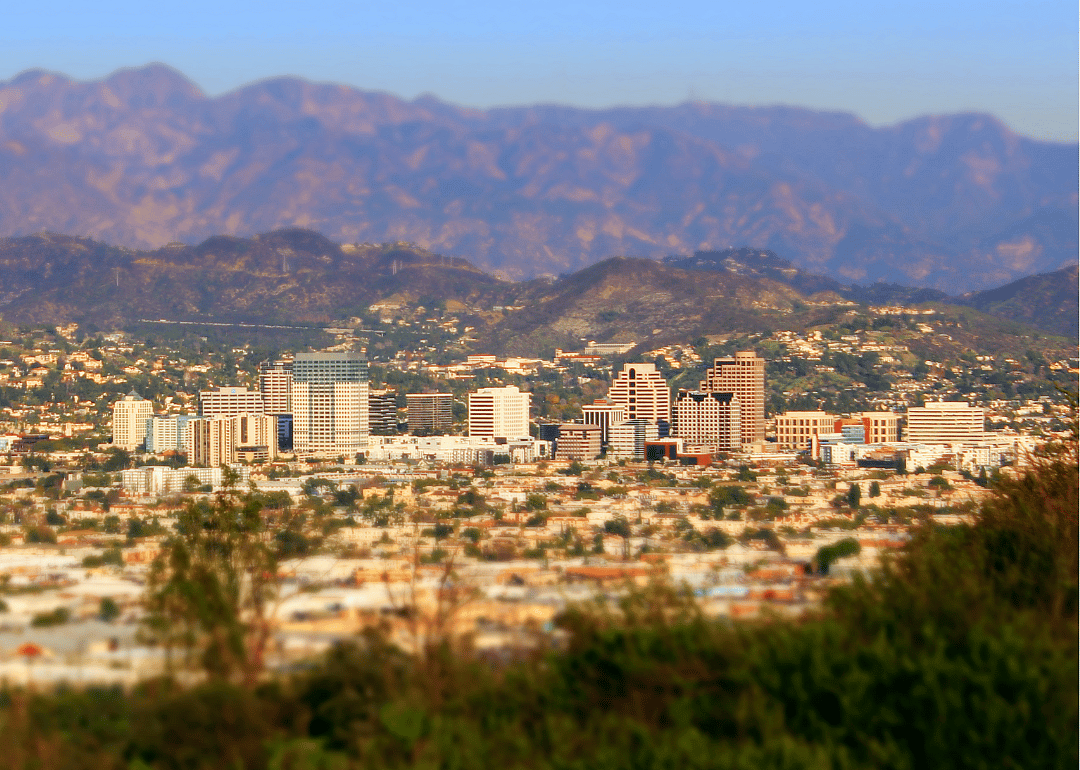
#9. Los Angeles International (Los Angeles, CA)

Strike First // Shutterstock

7 / 15

#9. Los Angeles International (Los Angeles, CA)

- Passengers: 40,181 (4.9% of all passengers)
- Top carriers:
--- #1. SkyWest Airlines: 17,206
--- #2. Allegiant Air: 12,773
--- #3. Horizon Air: 5,279
#8. Salt Lake City International (Salt Lake City, UT)

Canva

8 / 15

#8. Salt Lake City International (Salt Lake City, UT)

- Passengers: 49,581 (6.0% of all passengers)
- Top carriers:
--- #1. SkyWest Airlines: 36,096
--- #2. Delta Air Lines: 13,016
--- #3. Alaska Airlines: 323
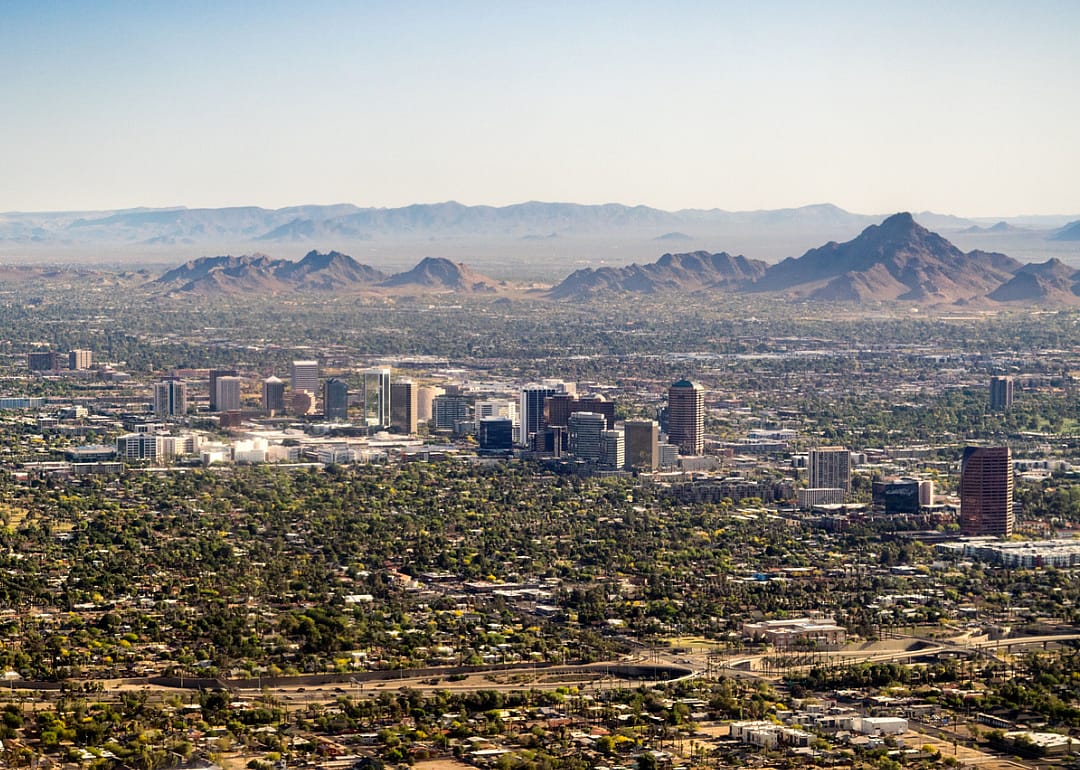
#7. Phoenix Sky Harbor International (Phoenix, AZ)

Nate Hovee // Shutterstock

9 / 15

#7. Phoenix Sky Harbor International (Phoenix, AZ)

- Passengers: 50,501 (6.1% of all passengers)
- Top carriers:
--- #1. American Airlines: 40,848
--- #2. SkyWest Airlines: 4,255
--- #3. Mesa Airlines: 2,206
#5. Harry Reid International (Las Vegas, NV)

randy andy // Shutterstock

11 / 15

#5. Harry Reid International (Las Vegas, NV)

- Passengers: 65,730 (8.0% of all passengers)
- Top carriers:
--- #1. Southwest Airlines: 48,830
--- #2. Allegiant Air: 16,737
--- #3. Global Crossing Airlines: 163
#4. Metro Oakland International (Oakland, CA)

MarynaG // Shutterstock

12 / 15

#4. Metro Oakland International (Oakland, CA)

- Passengers: 72,620 (8.8% of all passengers)
- Top carriers:
--- #1. Southwest Airlines: 67,029
--- #2. Allegiant Air: 5,243
--- #3. Alaska Airlines: 323
#3. San Francisco International (San Francisco, CA)

Pete Niesen // Shutterstock

13 / 15

#3. San Francisco International (San Francisco, CA)

- Passengers: 86,126 (10.5% of all passengers)
- Top carriers:
--- #1. United Air Lines: 57,437
--- #2. SkyWest Airlines: 28,531
--- #3. Alaska Airlines: 158
#2. Denver International (Denver, CO)

Andrew Zarivny // Shutterstock

14 / 15

#2. Denver International (Denver, CO)

- Passengers: 123,661 (15.0% of all passengers)
- Top carriers:
--- #1. United Air Lines: 94,624
--- #2. Southwest Airlines: 28,608
--- #3. SkyWest Airlines: 265
#1. Seattle/Tacoma International (Seattle, WA)

kan_khampanya // Shutterstock

15 / 15

#1. Seattle/Tacoma International (Seattle, WA)

- Passengers: 163,711 (19.9% of all passengers)
- Top carriers:
--- #1. SkyWest Airlines: 73,588
--- #2. Horizon Air: 70,333
--- #3. Alaska Airlines: 19,790

This story features data reporting by Rob Powell, writing by Jaimie Etkin, and is part of a series utilizing data automation across 199 metros.

You may also like: Highest-rated chicken wings in Eugene by diners