Cities attracting the most millennials
This story was produced by SmartAsset and reviewed and distributed by Stacker.
Cities attracting the most millennials
In just one year, 5.49 million millennials moved to large U.S. cities. While about 73% of these transplants moved to a big city within their current state of residence, another 19% traversed states to start new—and nearly 8% came to these cities from abroad. Millennials are often in their prime earning years, and many have young families, which may significantly impact the communities they join and leave.
With this in mind, SmartAsset ranked 271 of the largest U.S. cities based on the percentage of people between the ages of 25 and 44 who recently moved in.
Key Findings
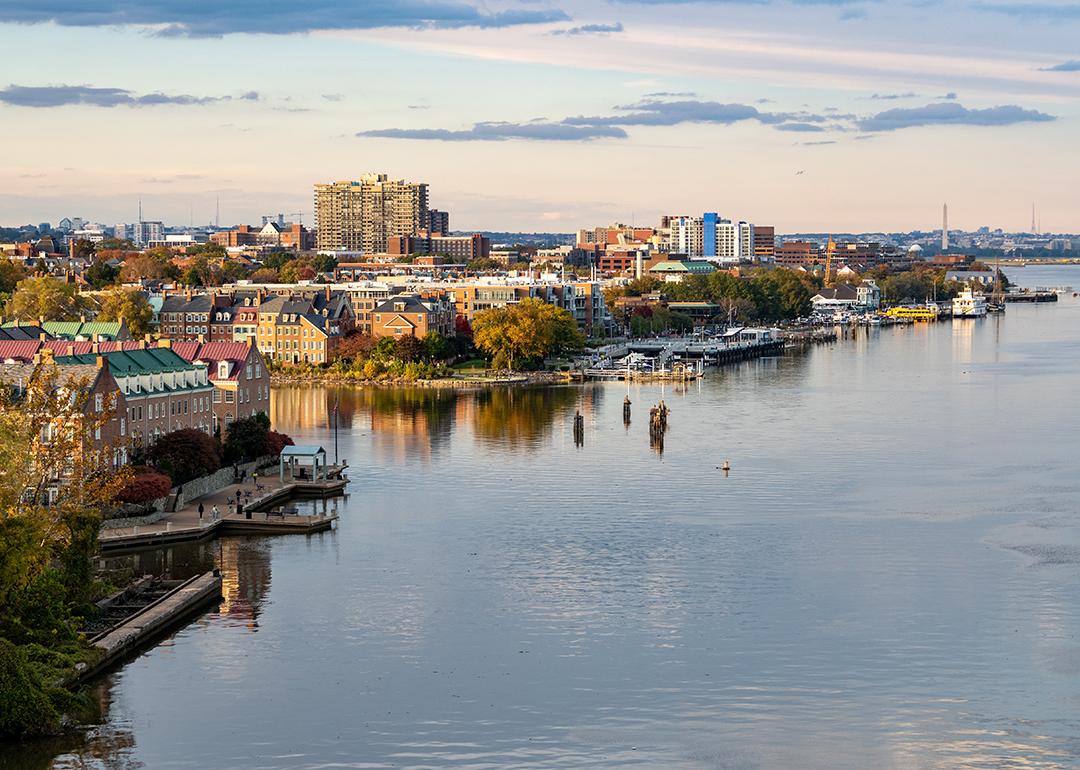
- In these two cities, millennials who have recently moved in make up over 12% of the population. Alexandria, Virginia, saw the highest influx of millennials relative to its population, with 12.67%—or 19,486— moving in during 2023, approximately 46% of whom came from out of state. Cambridge, Massachusetts, ranked second, with millennials making up 12.15% of new residents, or 14,197 people, 39% of whom relocated from outside the state.
- New York City had the most millennials move in by a factor of at least 2x. Not accounting for its population size, New York City had the most millennials join its perimeters at 362,649 move-ins in one year—accounting for 4.44% of the population. This number of move-ins was double that of Los Angeles, which had the second highest nominal move-ins at 187,210.
- These California cities were least attractive to millennials. While Sunnyvale and Santa Clara made the top 10 cities where millennials are moving to, more California cities rank at the bottom of the list. Jurupa Valley ranked last with 2.35% of its population comprising new millennial transplants. Other cities that were among the 10 least popular include Santa Ana (2.58%), Elk Grove (2.60%), San Bernardino (2.78%), Oxnard (2.78%), Ontario (2.96%), El Monte (3.08%), Garden Grove (3.11%) and Modesto (3.12%).
- Seattle has the largest segment of millennials relative to its population. Just over 42% of Seattle residents are between the ages of 25 and 44. Seattle also ranked fifth overall for most popular places for millennials to move to, with 11.51% of its population made up of millennials who moved in in 2023.
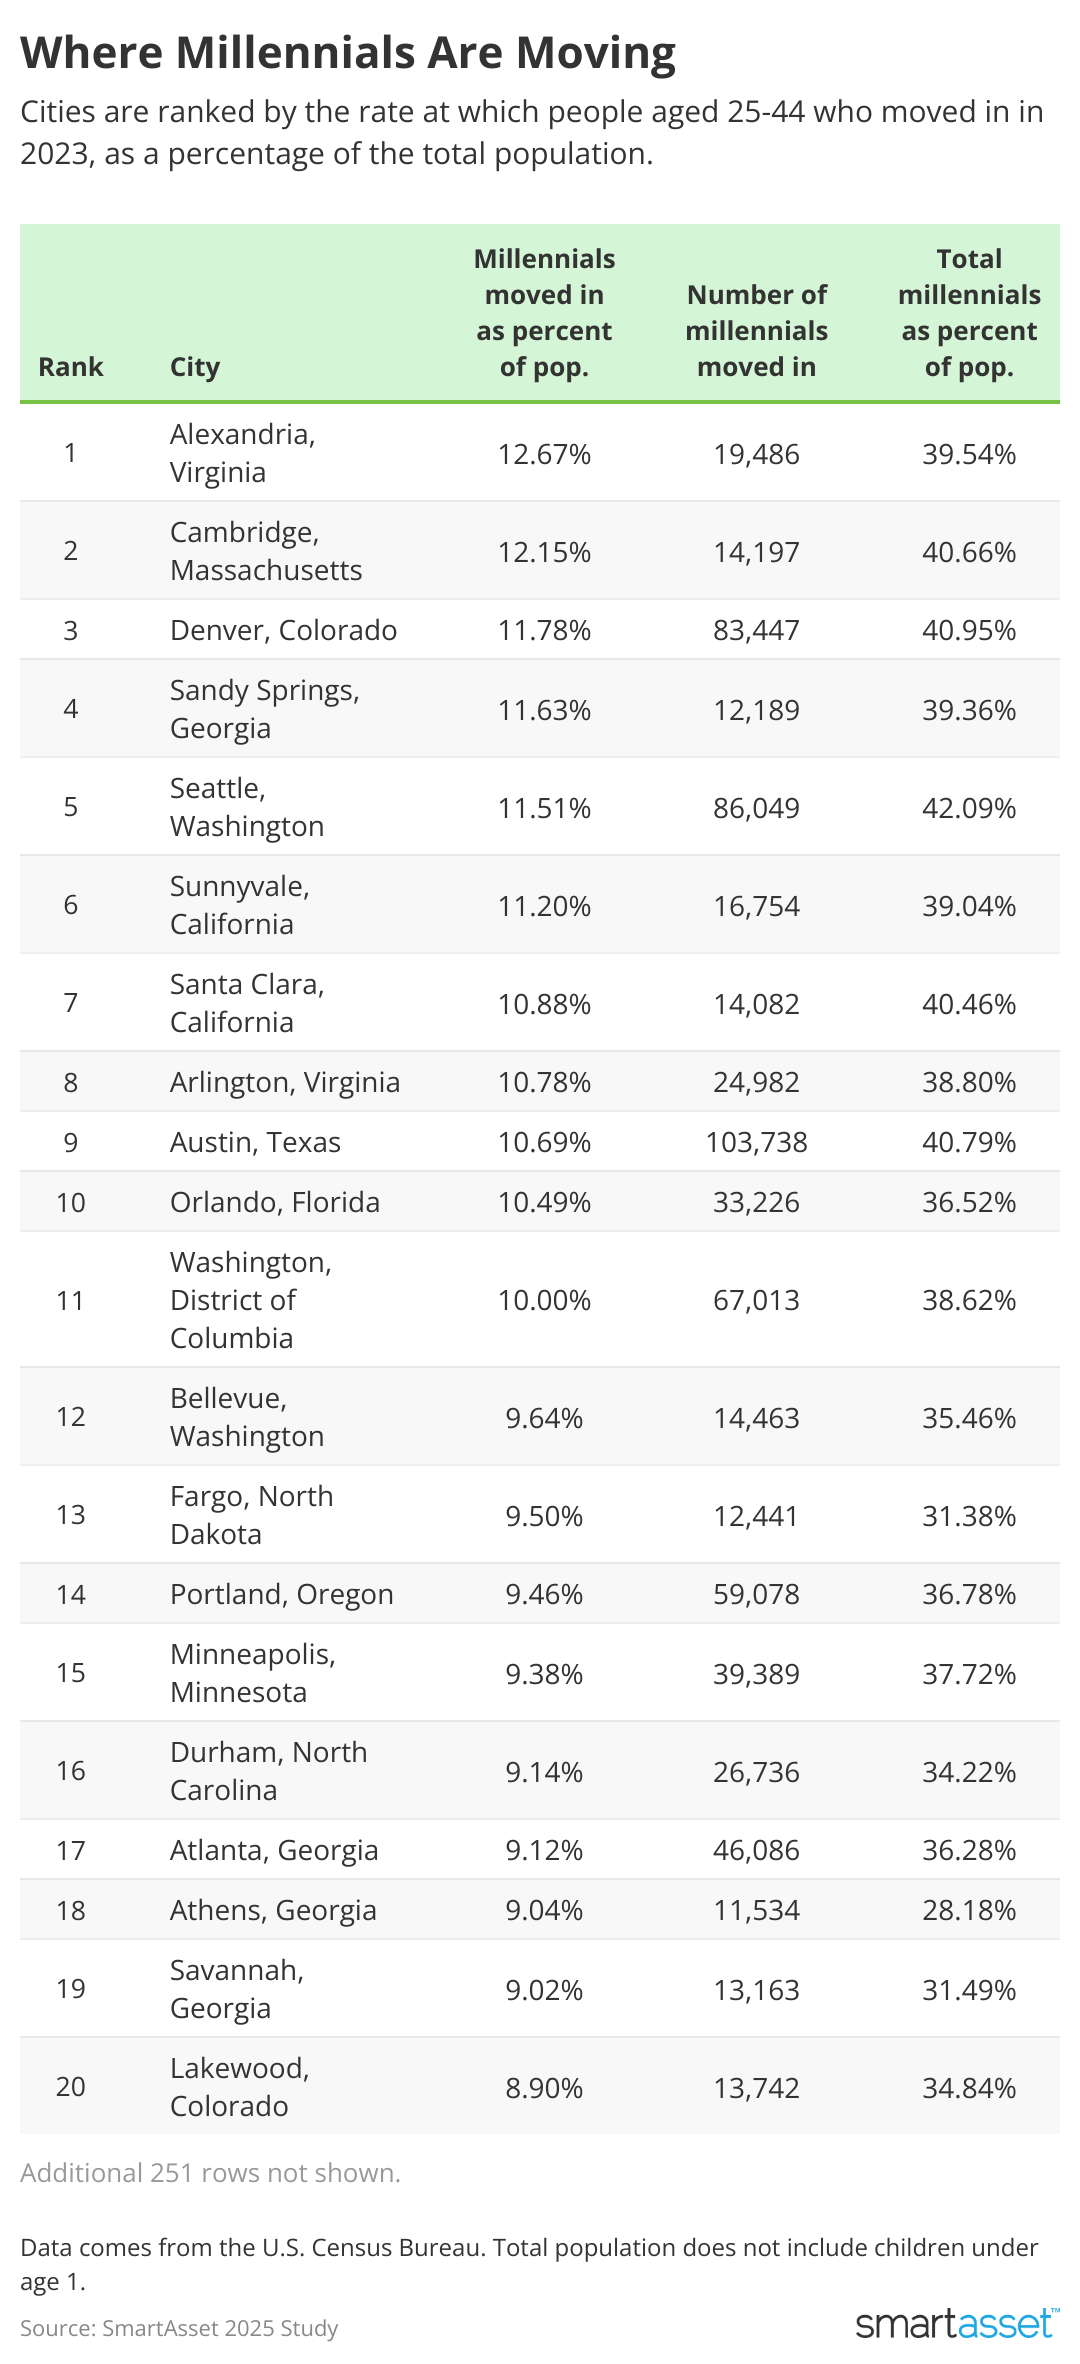
Top 20 Cities Where Millennials Are Moving
- Alexandria, Virginia
- Percent of population represented by new millennial transplants: 12.67%
- Number of millennials moved in: 19,486
- Total population (1 year and older): 153,790
- Total number of millennials: 60,815
- Millennials moved in from the same county: 4,680
- Millennials moved in from a different county, same state: 5,795
- Millennials moved in from a different state: 8,252
- Millennials moved in from abroad: 760
- Median household income: $110,294
- Median monthly housing costs: $2,105
- Millennials relative to the total population: 39.54%
- Cambridge, Massachusetts
- Percent of population represented by new millennial transplants: 12.15%
- Number of millennials moved in: 14,197
- Total population (1 year and older): 116,843
- Total number of millennials: 47,510
- Millennials moved in from the same county: 4,933
- Millennials moved in from a different county, same state: 3,741
- Millennials moved in from a different state: 3,166
- Millennials moved in from abroad: 2,356
- Median household income: $134,307
- Median monthly housing costs: $2,789
- Millennials relative to the total population: 40.66%
- Denver, Colorado
- Percent of population represented by new millennial transplants: 11.78%
- Number of millennials moved in: 83,447
- Total population (1 year and older): 708,432
- Total number of millennials: 290,134
- Millennials moved in from the same county: 33,816
- Millennials moved in from a different county, same state: 25,735
- Millennials moved in from a different state: 21,655
- Millennials moved in from abroad: 2,241
- Median household income: $94,157
- Median monthly housing costs: $1,886
- Millennials relative to the total population: 40.95%
- Sandy Springs, Georgia
- Percent of population represented by new millennial transplants: 11.63%
- Number of millennials moved in: 12,189
- Total population (1 year and older): 104,836
- Total number of millennials: 41,267
- Millennials moved in from the same county: 5,909
- Millennials moved in from a different county, same state: 3,813
- Millennials moved in from a different state: 1,666
- Millennials moved in from abroad: 800
- Median household income: $110,401
- Median monthly housing costs: $1,894
- Millennials relative to the total population: 39.36%
- Seattle, Washington
- Percent of population represented by new millennial transplants: 11.51%
- Number of millennials moved in: 86,049
- Total population (1 year and older): 747,884
- Total number of millennials: 314,788
- Millennials moved in from the same county: 51,638
- Millennials moved in from a different county, same state: 5,166
- Millennials moved in from a different state: 23,515
- Millennials moved in from abroad: 5,731
- Median household income: $120,608
- Median monthly housing costs: $2,155
- Millennials relative to the total population: 42.09%
- Sunnyvale, California
- Percent of population represented by new millennial transplants: 11.20%
- Number of millennials moved in: 16,754
- Total population (1 year and older): 149,575
- Total number of millennials: 58,401
- Millennials moved in from the same county: 9,111
- Millennials moved in from a different county, same state: 2,967
- Millennials moved in from a different state: 2,515
- Millennials moved in from abroad: 2,161
- Median household income: $189,443
- Median monthly housing costs: $3,012
- Millennials relative to the total population: 39.04%
- Santa Clara, California
- Percent of population represented by new millennial transplants: 10.88%
- Number of millennials moved in: 14,082
- Total population (1 year and older): 129,396
- Total number of millennials: 52,349
- Millennials moved in from the same county: 8,396
- Millennials moved in from a different county, same state: 2,616
- Millennials moved in from a different state: 2,185
- Millennials moved in from abroad: 885
- Median household income: $166,228
- Median monthly housing costs: $2,941
- Millennials relative to the total population: 40.46%
- Arlington, Virginia
- Percent of population represented by new millennial transplants: 10.78%
- Number of millennials moved in: 24,982
- Total population (1 year and older): 231,669
- Total number of millennials: 89,891
- Millennials moved in from the same county: 7,395
- Millennials moved in from a different county, same state: 5,233
- Millennials moved in from a different state: 10,121
- Millennials moved in from abroad: 2,234
- Median household income: $140,219
- Median monthly housing costs: $2,360
- Millennials relative to the total population: 38.80%
- Austin, Texas
- Percent of population represented by new millennial transplants: 10.69%
- Number of millennials moved in: 103,738
- Total population (1 year and older): 970,338
- Total number of millennials: 395,776
- Millennials moved in from the same county: 55,591
- Millennials moved in from a different county, same state: 21,403
- Millennials moved in from a different state: 19,890
- Millennials moved in from abroad: 6,854
- Median household income: $91,501
- Median monthly housing costs: $1,828
- Millennials relative to the total population: 40.79%
- Orlando, Florida
- Percent of population represented by new millennial transplants: 10.49%
- Number of millennials moved in: 33,226
- Total population (1 year and older): 316,702
- Total number of millennials: 115,668
- Millennials moved in from the same county: 17,216
- Millennials moved in from a different county, same state: 8,210
- Millennials moved in from a different state: 4,847
- Millennials moved in from abroad: 2,953
- Median household income: $69,414
- Median monthly housing costs: $1,762
- Millennials relative to the total population: 36.52%
- Washington, District of Columbia
- Percent of population represented by new millennial transplants: 10%
- Number of millennials moved in: 67,013
- Total population (1 year and older): 670,127
- Total number of millennials: 258,814
- Millennials moved in from the same county: 36,390
- Millennials moved in from a different county, same state: 0
- Millennials moved in from a different state: 24,465
- Millennials moved in from abroad: 6,159
- Median household income: $108,210
- Median monthly housing costs: $2,083
- Millennials relative to the total population: 38.62%
- Bellevue, Washington
- Percent of population represented by new millennial transplants: 9.64%
- Number of millennials moved in: 14,463
- Total population (1 year and older): 149,955
- Total number of millennials: 53,175
- Millennials moved in from the same county: 7,414
- Millennials moved in from a different county, same state: 749
- Millennials moved in from a different state: 3,197
- Millennials moved in from abroad: 3,103
- Median household income: $158,253
- Median monthly housing costs: $2,551
- Millennials relative to the total population: 35.46%
- Fargo, North Dakota
- Percent of population represented by new millennial transplants: 9.50%
- Number of millennials moved in: 12,441
- Total population (1 year and older): 130,895
- Total number of millennials: 41,073
- Millennials moved in from the same county: 8,193
- Millennials moved in from a different county, same state: 685
- Millennials moved in from a different state: 2,654
- Millennials moved in from abroad: 909
- Median household income: $61,422
- Median monthly housing costs: $1,038
- Millennials relative to the total population: 31.38%
- Portland, Oregon
- Percent of population represented by new millennial transplants: 9.46%
- Number of millennials moved in: 59,078
- Total population (1 year and older): 624,727
- Total number of millennials: 229,791
- Millennials moved in from the same county: 32,810
- Millennials moved in from a different county, same state: 10,372
- Millennials moved in from a different state: 13,704
- Millennials moved in from abroad: 2,192
- Median household income: $86,057
- Median monthly housing costs: $1,746
- Millennials relative to the total population: 36.78%
- Minneapolis, Minnesota
- Percent of population represented by new millennial transplants: 9.38%
- Number of millennials moved in: 39,389
- Total population (1 year and older): 419,780
- Total number of millennials: 158,333
- Millennials moved in from the same county: 20,511
- Millennials moved in from a different county, same state: 7,673
- Millennials moved in from a different state: 9,757
- Millennials moved in from abroad: 1,448
- Median household income: $81,001
- Median monthly housing costs: $1,506
- Millennials relative to the total population: 37.72%
- Durham, North Carolina
- Percent of population represented by new millennial transplants: 9.14%
- Number of millennials moved in: 26,736
- Total population (1 year and older): 292,429
- Total number of millennials: 100,080
- Millennials moved in from the same county: 11,099
- Millennials moved in from a different county, same state: 6,781
- Millennials moved in from a different state: 7,055
- Millennials moved in from abroad: 1,801
- Median household income: $80,064
- Median monthly housing costs: $1,567
- Millennials relative to the total population: 34.22%
- Atlanta, Georgia
- Percent of population represented by new millennial transplants: 9.12%
- Number of millennials moved in: 46,086
- Total population (1 year and older): 505,496
- Total number of millennials: 183,397
- Millennials moved in from the same county: 21,683
- Millennials moved in from a different county, same state: 12,776
- Millennials moved in from a different state: 9,848
- Millennials moved in from abroad: 1,779
- Median household income: $85,880
- Median monthly housing costs: $1,812
- Millennials relative to the total population: 36.28%
- Athens, Georgia
- Percent of population represented by new millennial transplants: 9.04%
- Number of millennials moved in: 11,534
- Total population (1 year and older): 127,615
- Total number of millennials: 35,962
- Millennials moved in from the same county: 5,953
- Millennials moved in from a different county, same state: 1,786
- Millennials moved in from a different state: 2,918
- Millennials moved in from abroad: 877
- Median household income: $53,775
- Median monthly housing costs: $1,242
- Millennials relative to the total population: 28.18%
- Savannah, Georgia
- Percent of population represented by new millennial transplants: 9.02%
- Number of millennials moved in: 13,163
- Total population (1 year and older): 145,911
- Total number of millennials: 45,947
- Millennials moved in from the same county: 6,310
- Millennials moved in from a different county, same state: 3,240
- Millennials moved in from a different state: 3,170
- Millennials moved in from abroad: 444
- Median household income: $56,823
- Median monthly housing costs: $1,355
- Millennials relative to the total population: 31.49%
- Lakewood, Colorado
- Percent of population represented by new millennial transplants: 8.90%
- Number of millennials moved in: 13,742
- Total population (1 year and older): 154,379
- Total number of millennials: 53,793
- Millennials moved in from the same county: 3,522
- Millennials moved in from a different county, same state: 6,727
- Millennials moved in from a different state: 2,699
- Millennials moved in from abroad: 794
- Median household income: $83,987
- Median monthly housing costs: $1,755
- Millennials relative to the total population: 34.84%
Data and Methodology
Data comes from the Census Bureau 1-Year American Community Survey for 2023. This SmartAsset study included 271 cities that had available data and 100,000 or more people aged 1 or over. Millennials were defined as those aged 25 to 44. Cities were ranked by the percentage of the total population represented by millennials who moved into the city in 2023.