SmartAsset
1 / 1Top 10 Cities With the Largest One-Year Population Increase
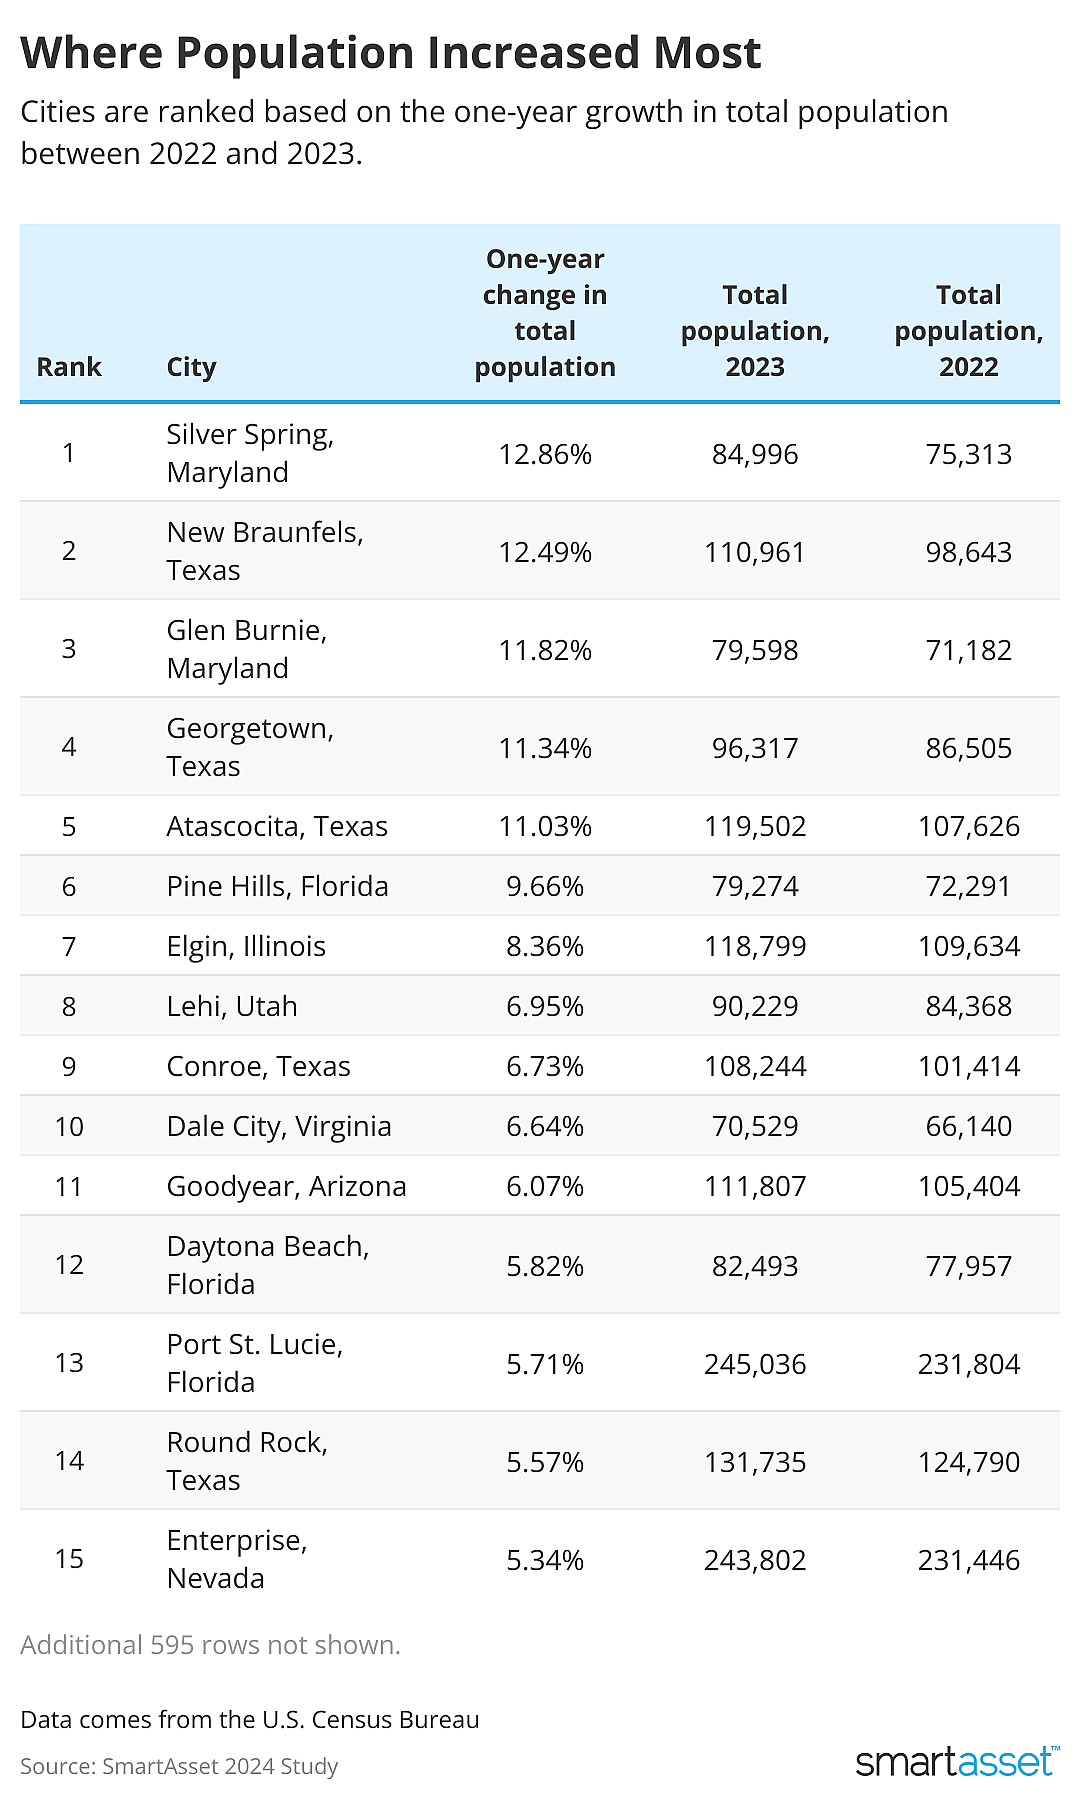
- Silver Spring, Maryland
- One-year change in total population: 12.86%
- Five-year change in total population: 3.89%
- Total population, 2023: 84,996
- Total population, 2022: 75,313
- Total population, 2018: 81,816
- One-year change in the number of working-age residents: 6.56%
- Number of working-age residents, 2023: 47,003
- Percent of population of working age, 2023: 55.30%
- Number of working-age residents, 2022: 44,111
- Percent of population of working age, 2022: 58.57%
- New Braunfels, Texas
- One-year change in total population: 12.49%
- Five-year change in total population: 29.68%
- Total population, 2023: 110,961
- Total population, 2022: 98,643
- Total population, 2018: 85,566
- One-year change in the number of working-age residents: 21.96%
- Number of working-age residents, 2023: 59,340
- Percent of population of working age, 2023: 53.48%
- Number of working-age residents, 2022: 48,654
- Percent of population of working age, 2022: 49.32%
- Glen Burnie, Maryland
- One-year change in total population: 11.82%
- Five-year change in total population: 20.63%
- Total population, 2023: 79,598
- Total population, 2022: 71,182
- Total population, 2018: 65,987
- One-year change in the number of working-age residents: 4.89%
- Number of working-age residents, 2023: 38,295
- Percent of population of working age, 2023: 48.11%
- Number of working-age residents, 2022: 36,508
- Percent of population of working age, 2022: 51.29%
- Georgetown, Texas
- One-year change in total population: 11.34%
- Five-year change in total population: 29.85%
- Total population, 2023: 96,317
- Total population, 2022: 86,505
- Total population, 2018: 74,176
- One-year change in the number of working-age residents: 7.47%
- Number of working-age residents, 2023: 40,074
- Percent of population of working age, 2023: 41.61%
- Number of working-age residents, 2022: 37,290
- Percent of population of working age, 2022: 43.11%
- Atascocita, Texas
- One-year change in total population: 11.03%
- Five-year change in total population: 38.56%
- Total population, 2023: 119,502
- Total population, 2022: 107,626
- Total population, 2018: 86,243
- One-year change in the number of working-age residents: 7.77%
- Number of working-age residents, 2023: 58,297
- Percent of population of working age, 2023: 48.78%
- Number of working-age residents, 2022: 54,095
- Percent of population of working age, 2022: 50.26%
- Pine Hills, Florida
- One-year change in total population: 9.66%
- Five-year change in total population: -11.99%
- Total population, 2023: 79,274
- Total population, 2022: 72,291
- Total population, 2018: 90,070
- One-year change in the number of working-age residents: 7.67%
- Number of working-age residents, 2023: 35,932
- Percent of population of working age, 2023: 45.33%
- Number of working-age residents, 2022: 33,372
- Percent of population of working age, 2022: 46.16%
- Elgin, Illinois
- One-year change in total population: 8.36%
- Five-year change in total population: 7.13%
- Total population, 2023: 118,799
- Total population, 2022: 109,634
- Total population, 2018: 110,893
- One-year change in the number of working-age residents: 16.08%
- Number of working-age residents, 2023: 57,513
- Percent of population of working age, 2023: 48.41%
- Number of working-age residents, 2022: 49,545
- Percent of population of working age, 2022: 45.19%
- Lehi, Utah
- One-year change in total population: 6.95%
- Five-year change in total population: 36.65%
- Total population, 2023: 90,229
- Total population, 2022: 84,368
- Total population, 2018: 66,029
- One-year change in the number of working-age residents: 4.89%
- Number of working-age residents, 2023: 43,052
- Percent of population of working age, 2023: 47.71%
- Number of working-age residents, 2022: 41,044
- Percent of population of working age, 2022: 48.65%
- Conroe, Texas
- One-year change in total population: 6.73%
- Five-year change in total population: 23.49%
- Total population, 2023: 108,244
- Total population, 2022: 101,414
- Total population, 2018: 87,656
- One-year change in the number of working-age residents: 15.62%
- Number of working-age residents, 2023: 57,237
- Percent of population of working age, 2023: 52.88%
- Number of working-age residents, 2022: 49,504
- Percent of population of working age, 2022: 48.81%
- Dale City, Virginia
- One-year change in total population: 6.64%
- Five-year change in total population: 2.51%
- Total population, 2023: 70,529
- Total population, 2022: 66,140
- Total population, 2018: 68,805
- One-year change in the number of working-age residents: 2.24%
- Number of working-age residents, 2023: 31,850
- Percent of population of working age, 2023: 45.16%
- Number of working-age residents, 2022: 31,153
- Percent of population of working age, 2022: 47.10%
Top 10 Cities With the Largest Five-Year Population Increase
- Buckeye, Arizona
- Five-year change in total population: 46.41%
- One-year change in total population: 3.16%
- Total population, 2023: 108,900
- Total population, 2022: 105,567
- Total population, 2018: 74,378
- One-year change in the number of working-age residents: -1.52%
- Number of working-age residents, 2023: 50,747
- Percent of population of working age, 2023: 46.60%
- Number of working-age residents, 2022: 51,528
- Percent of population of working age, 2022: 48.81%
- Atascocita, Texas
- Five-year change in total population: 38.56%
- One-year change in total population: 11.03%
- Total population, 2023: 119,502
- Total population, 2022: 107,626
- Total population, 2018: 86,243
- One-year change in the number of working-age residents: 7.77%
- Number of working-age residents, 2023: 58,297
- Percent of population of working age, 2023: 48.78%
- Number of working-age residents, 2022: 54,095
- Percent of population of working age, 2022: 50.26%
- Lehi, Utah
- Five-year change in total population: 36.65%
- One-year change in total population: 6.95%
- Total population, 2023: 90,229
- Total population, 2022: 84,368
- Total population, 2018: 66,029
- One-year change in the number of working-age residents: 4.89%
- Number of working-age residents, 2023: 43,052
- Percent of population of working age, 2023: 47.71%
- Number of working-age residents, 2022: 41,044
- Percent of population of working age, 2022: 48.65%
- Goodyear, Arizona
- Five-year change in total population: 34.97%
- One-year change in total population: 6.07%
- Total population, 2023: 111,807
- Total population, 2022: 105,404
- Total population, 2018: 82,837
- One-year change in the number of working-age residents: -2.55%
- Number of working-age residents, 2023: 48,772
- Percent of population of working age, 2023: 43.62%
- Number of working-age residents, 2022: 50,049
- Percent of population of working age, 2022: 47.48%
- Riverview, Florida
- Five-year change in total population: 33.04%
- One-year change in total population: 4.60%
- Total population, 2023: 119,714
- Total population, 2022: 114,454
- Total population, 2018: 89,982
- One-year change in the number of working-age residents: 7.29%
- Number of working-age residents, 2023: 61,369
- Percent of population of working age, 2023: 51.26%
- Number of working-age residents, 2022: 57,198
- Percent of population of working age, 2022: 49.97%
- Enterprise, Nevada
- Five-year change in total population: 30.32%
- One-year change in total population: 5.34%
- Total population, 2023: 243,802
- Total population, 2022: 231,446
- Total population, 2018: 187,078
- One-year change in the number of working-age residents: 5.80%
- Number of working-age residents, 2023: 133,647
- Percent of population of working age, 2023: 54.82%
- Number of working-age residents, 2022: 126,317
- Percent of population of working age, 2022: 54.58%
- Georgetown, Texas
- Five-year change in total population: 29.85%
- One-year change in total population: 11.34%
- Total population, 2023: 96,317
- Total population, 2022: 86,505
- Total population, 2018: 74,176
- One-year change in the number of working-age residents: 7.47%
- Number of working-age residents, 2023: 40,074
- Percent of population of working age, 2023: 41.61%
- Number of working-age residents, 2022: 37,290
- Percent of population of working age, 2022: 43.11%
- New Braunfels, Texas
- Five-year change in total population: 29.68%
- One-year change in total population: 12.49%
- Total population, 2023: 110,961
- Total population, 2022: 98,643
- Total population, 2018: 85,566
- One-year change in the number of working-age residents: 21.96%
- Number of working-age residents, 2023: 59,340
- Percent of population of working age, 2023: 53.48%
- Number of working-age residents, 2022: 48,654
- Percent of population of working age, 2022: 49.32%
- North Port, Florida
- Five-year change in total population: 29.57%
- One-year change in total population: 4.50%
- Total population, 2023: 88,931
- Total population, 2022: 85,102
- Total population, 2018: 68,637
- One-year change in the number of working-age residents: 7.35%
- Number of working-age residents, 2023: 35,139
- Percent of population of working age, 2023: 39.51%
- Number of working-age residents, 2022: 32,734
- Percent of population of working age, 2022: 38.46%
- Meridian, Idaho
- Five-year change in total population: 26.22%
- One-year change in total population: 3.90%
- Total population, 2023: 134,794
- Total population, 2022: 129,730
- Total population, 2018: 106,794
- One-year change in the number of working-age residents: 1.65%
- Number of working-age residents, 2023: 63,251
- Percent of population of working age, 2023: 46.92%
- Number of working-age residents, 2022: 62,223
- Percent of population of working age, 2022: 47.96%
Data and Methodology
Population estimates from the U.S. Census Bureau for 2023, 2022 and 2018 were used to determine one-year and five-year population changes for cities with populations of at least 65,000 in 2023 for which full data was available. Changes in the working age population were also examined, with working age defined as between ages 20 and 54.