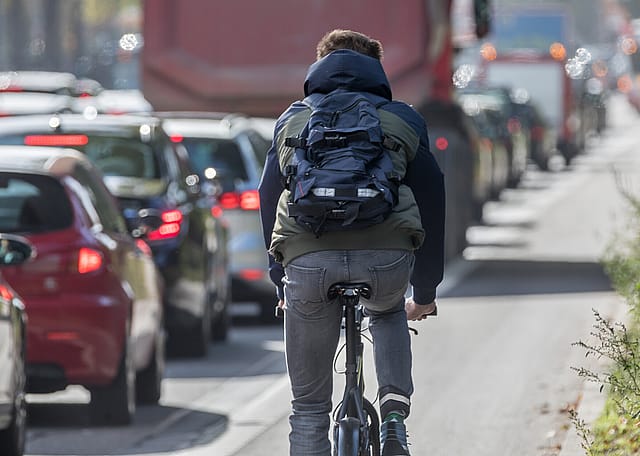
Stacker compiled a list of the counties with the best commutes in South Carolina using data from the U.S. Census Bureau. Counties are ranked by the shortest average travel time to work, with ties broken by lowest percent of residents that commute over 60 minutes, and any further ties broken by lowest percent of residents that work outside the county of residence.
You may also like: Best public middle schools in South Carolina
Farrargirl // Wikimedia Commons
1 / 46#46. McCormick County
- Mean travel time to work: 34.3
- Workers with 60+ minute commute: 11.0%
- Worked outside of county of residence: 38.8%
Bill Fitzpatrick // Wikimedia Commons
2 / 46#45. Saluda County
- Mean travel time to work: 33.3
- Workers with 60+ minute commute: 14.7%
- Worked outside of county of residence: 58.7%
Upstateherd // Wikimedia Commons
3 / 46#44. Allendale County
- Mean travel time to work: 32.9
- Workers with 60+ minute commute: 22.8%
- Worked outside of county of residence: 53.7%
Upstateherd // Wikimedia Commons
4 / 46#43. Colleton County
- Mean travel time to work: 32.2
- Workers with 60+ minute commute: 15.9%
- Worked outside of county of residence: 29.8%
Pollinator // Wikimedia Commons
5 / 46Ffuhr // Wikimedia Commons
6 / 46#41. Hampton County
- Mean travel time to work: 31.8
- Workers with 60+ minute commute: 16.2%
- Worked outside of county of residence: 41.1%
Calvin Beale // Wikimedia Commons
7 / 46#40. Barnwell County
- Mean travel time to work: 31.7
- Workers with 60+ minute commute: 15.6%
- Worked outside of county of residence: 41.5%
Lazyksaw // Wikimedia Commons
8 / 46#39. Dorchester County
- Mean travel time to work: 30.8
- Workers with 60+ minute commute: 11.0%
- Worked outside of county of residence: 59.3%
Calatayudboy // Wikimedia Commons
9 / 46#38. Lancaster County
- Mean travel time to work: 30.7
- Workers with 60+ minute commute: 12.2%
- Worked outside of county of residence: 20.9%
ProfReader // Wikimedia Commons
10 / 46#36. Chester County
- Mean travel time to work: 30.2
- Workers with 60+ minute commute: 9.8%
- Worked outside of county of residence: 45.8%
Upstateherd // Wikimedia Commons
12 / 46#35. Clarendon County
- Mean travel time to work: 29.8
- Workers with 60+ minute commute: 13.7%
- Worked outside of county of residence: 46.2%
Upstateherd // Wikimedia Commons
13 / 46#34. Fairfield County
- Mean travel time to work: 29.8
- Workers with 60+ minute commute: 6.1%
- Worked outside of county of residence: 56.0%
Ammodramus // Wikimedia Commons
14 / 46#33. Orangeburg County
- Mean travel time to work: 29.6
- Workers with 60+ minute commute: 13.9%
- Worked outside of county of residence: 29.4%
Bill Fitzpatrick // Wikimedia Commons
15 / 46Brian Scott // Wikimedia Commons
16 / 46#31. Abbeville County
- Mean travel time to work: 29.0
- Workers with 60+ minute commute: 8.5%
- Worked outside of county of residence: 56.8%
#30. Georgetown County
- Mean travel time to work: 28.9
- Workers with 60+ minute commute: 12.9%
- Worked outside of county of residence: 29.7%
Bill Fitzpatrick // Wikimedia Commons
18 / 46#29. Calhoun County
- Mean travel time to work: 28.5
- Workers with 60+ minute commute: 3.6%
- Worked outside of county of residence: 65.5%
Ammodramus // Wikimedia Commons
19 / 46#28. Lee County
- Mean travel time to work: 28.4
- Workers with 60+ minute commute: 8.1%
- Worked outside of county of residence: 59.6%
Pollinator // Wikimedia Commons
20 / 46Itsbrandoyo // Wikimedia Commons
21 / 46#26. Berkeley County
- Mean travel time to work: 28.2
- Workers with 60+ minute commute: 7.7%
- Worked outside of county of residence: 53.0%
Bill Fitzpatrick // Wikimedia Commons
22 / 46#25. Jasper County
- Mean travel time to work: 28.0
- Workers with 60+ minute commute: 8.3%
- Worked outside of county of residence: 50.0%
Upstateherd // Wikimedia Commons
23 / 46#24. Edgefield County
- Mean travel time to work: 27.9
- Workers with 60+ minute commute: 10.0%
- Worked outside of county of residence: 37.8%
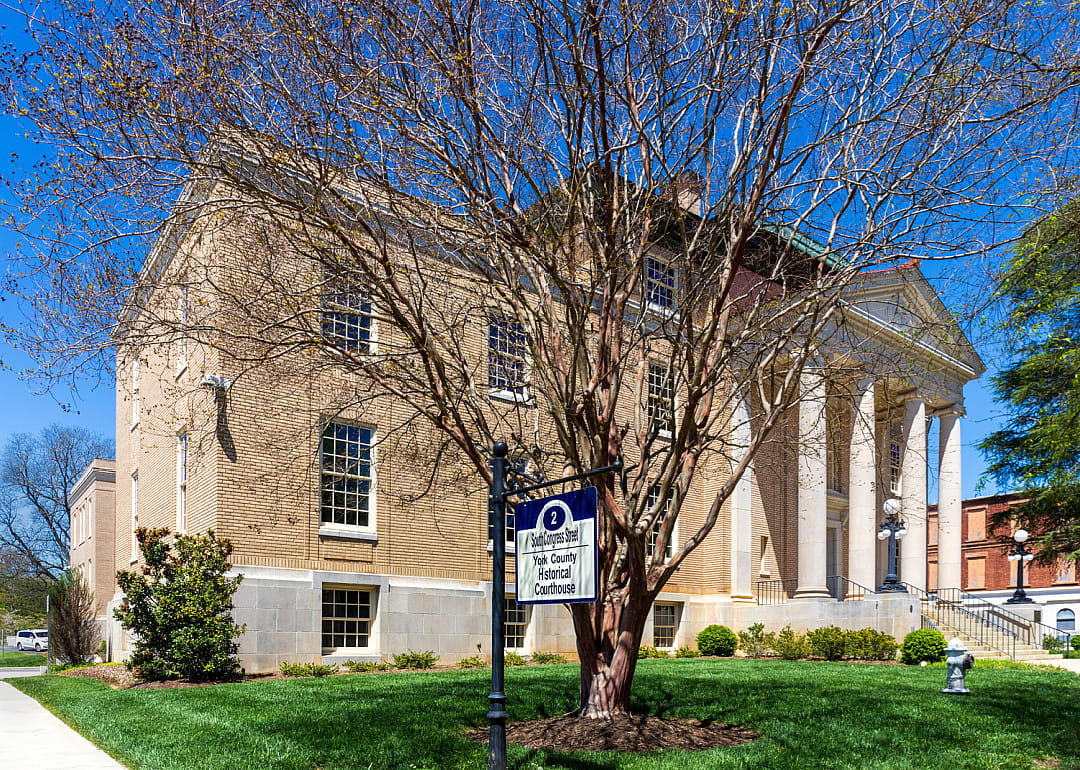
Nolichuckyjake // Shutterstock
24 / 46#23. York County
- Mean travel time to work: 27.6
- Workers with 60+ minute commute: 8.4%
- Worked outside of county of residence: 5.5%
Calvin Beale // Wikimedia Commons
26 / 46#21. Marlboro County
- Mean travel time to work: 26.6
- Workers with 60+ minute commute: 7.7%
- Worked outside of county of residence: 27.5%
Bill Fitzpatrick // Wikimedia Commons
27 / 46#20. Laurens County
- Mean travel time to work: 26.4
- Workers with 60+ minute commute: 8.4%
- Worked outside of county of residence: 43.3%
KudzuVine // Wikimedia Commons
28 / 46#19. Pickens County
- Mean travel time to work: 26.4
- Workers with 60+ minute commute: 5.5%
- Worked outside of county of residence: 43.1%
Ralph Hightower // Wikimedia Commons
29 / 46#18. Lexington County
- Mean travel time to work: 26.0
- Workers with 60+ minute commute: 5.5%
- Worked outside of county of residence: 36.9%
Morder // Wikimedia Commons
30 / 46Upstateherd // Wikimedia Commons
31 / 46#16. Chesterfield County
- Mean travel time to work: 25.1
- Workers with 60+ minute commute: 7.0%
- Worked outside of county of residence: 20.5%
Upstateherd // Wikimedia Commons
32 / 46#15. Anderson County
- Mean travel time to work: 25.1
- Workers with 60+ minute commute: 4.9%
- Worked outside of county of residence: 32.6%
NatalieMaynor // Wikimedia Commons
33 / 46#14. Newberry County
- Mean travel time to work: 24.9
- Workers with 60+ minute commute: 7.2%
- Worked outside of county of residence: 32.6%
Brian Stansberry // Wikimedia Commons
34 / 46#13. Oconee County
- Mean travel time to work: 24.8
- Workers with 60+ minute commute: 6.7%
- Worked outside of county of residence: 27.2%
Festiva76 // Wikimedia Commons
35 / 46#11. Charleston County
- Mean travel time to work: 24.3
- Workers with 60+ minute commute: 4.3%
- Worked outside of county of residence: 9.8%
#10. Spartanburg County
- Mean travel time to work: 23.7
- Workers with 60+ minute commute: 4.6%
- Worked outside of county of residence: 19.2%
#9. Greenville County
- Mean travel time to work: 23.6
- Workers with 60+ minute commute: 4.0%
- Worked outside of county of residence: 14.4%
Jud McCranie // Wikimedia Commons
39 / 46#8. Darlington County
- Mean travel time to work: 23.3
- Workers with 60+ minute commute: 5.4%
- Worked outside of county of residence: 42.4%
#6. Richland County
- Mean travel time to work: 22.8
- Workers with 60+ minute commute: 4.9%
- Worked outside of county of residence: 20.1%
Pollinator // Wikimedia Commons
42 / 46#5. Sumter County
- Mean travel time to work: 22.7
- Workers with 60+ minute commute: 8.8%
- Worked outside of county of residence: 19.0%
Robert Thomas Mckenzie Jr // Wikimedia Commons
43 / 46#4. Florence County
- Mean travel time to work: 22.7
- Workers with 60+ minute commute: 6.2%
- Worked outside of county of residence: 15.5%
Bill Fitzpatrick // Wikimedia Commons
44 / 46#3. Dillon County
- Mean travel time to work: 22.6
- Workers with 60+ minute commute: 4.8%
- Worked outside of county of residence: 29.1%
Pollinator // Wikimedia Commons
45 / 46Bill Fitzpatrick // Wikimedia Commons
46 / 46#1. Greenwood County
- Mean travel time to work: 20.3
- Workers with 60+ minute commute: 5.8%
- Worked outside of county of residence: 19.1%