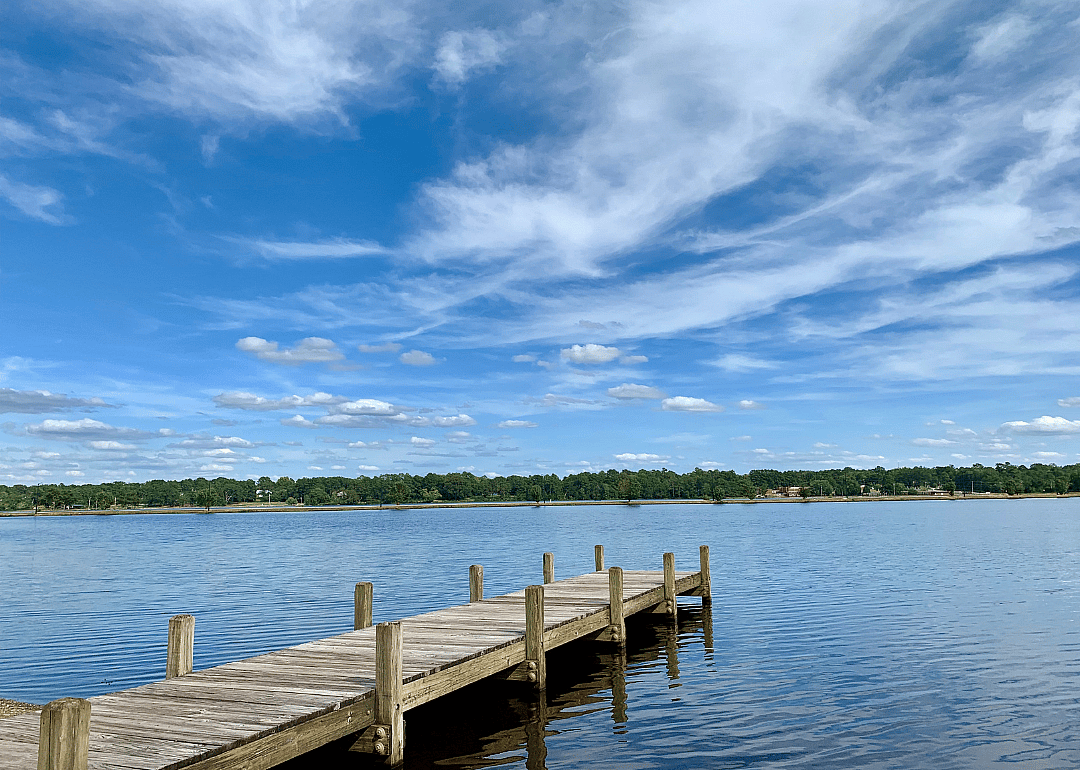
Wilma Engelhardt Ellis // Shutterstock
1 / 20#20. Marlboro County
- Bridges in poor condition: 5.4% (5 of 93 bridges)
- Square meters of bridges in poor condition: 4.3% (3,483 of 81,211 square meters of bridges)

One in three U.S. bridges is in need of repair or replacement, according to data from the American Road & Transportation Builders Association, including 29% of interstate bridges. The cost to make these repairs is estimated to be in excess of $54 billion.
Stacker investigated which counties in South Carolina have the most bridges in dire need of repair using data from the Federal Highway Administration. The data is accurate as of June 15, 2022. Counties are ranked by percent of bridges in "poor" condition and ties are broken by percent square meters of bridges in poor condition. Counties that have no bridges or have no bridges in poor condition are excluded from the list.
You may also like: Highest-rated IPAs in South Carolina
Wilma Engelhardt Ellis // Shutterstock
1 / 20- Bridges in poor condition: 5.4% (5 of 93 bridges)
- Square meters of bridges in poor condition: 4.3% (3,483 of 81,211 square meters of bridges)
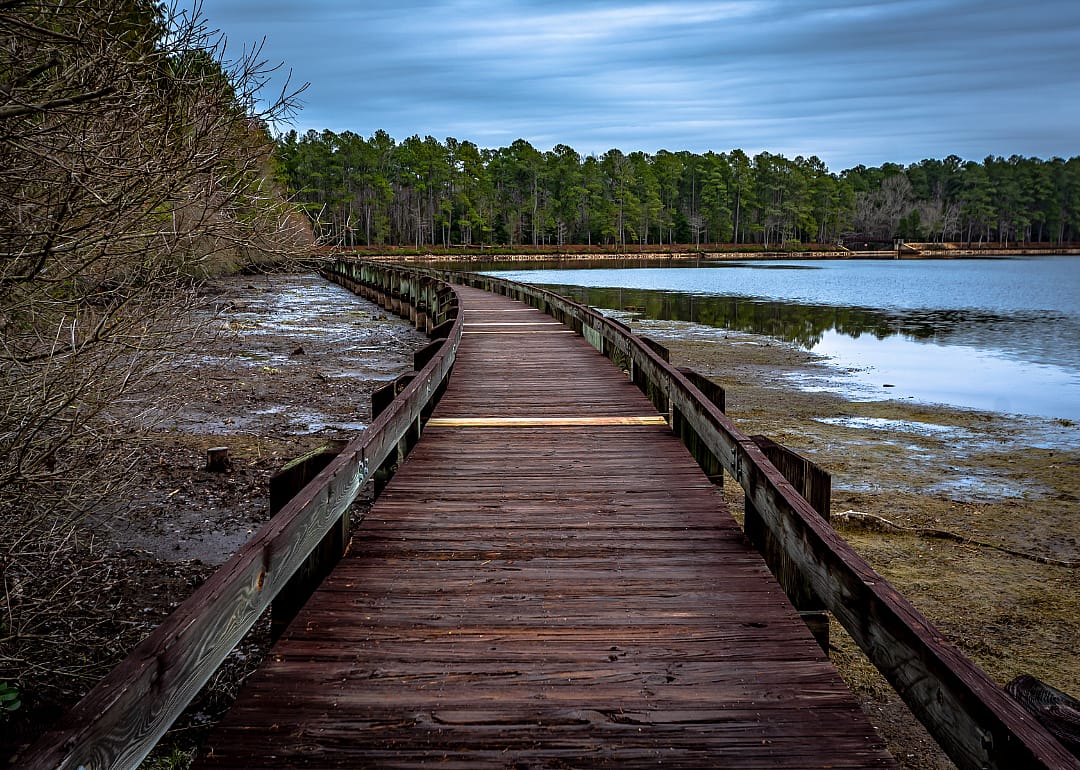
Chansak Joe // Shutterstock
2 / 20- Bridges in poor condition: 5.6% (11 of 197 bridges)
- Square meters of bridges in poor condition: 5.3% (3,810 of 71,980 square meters of bridges)
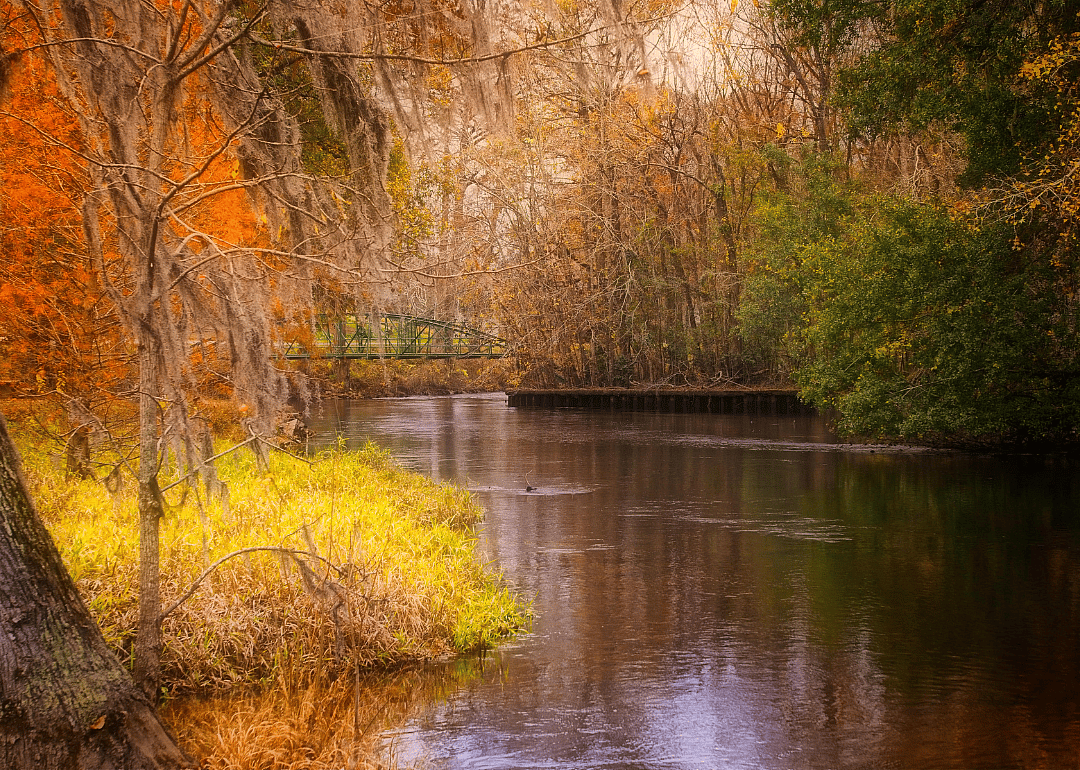
James R Poston // Shutterstock
3 / 20- Bridges in poor condition: 5.8% (16 of 277 bridges)
- Square meters of bridges in poor condition: 2.8% (3,273 of 117,768 square meters of bridges)

Canva
4 / 20- Bridges in poor condition: 6.2% (40 of 641 bridges)
- Square meters of bridges in poor condition: 6.5% (24,717 of 381,408 square meters of bridges)
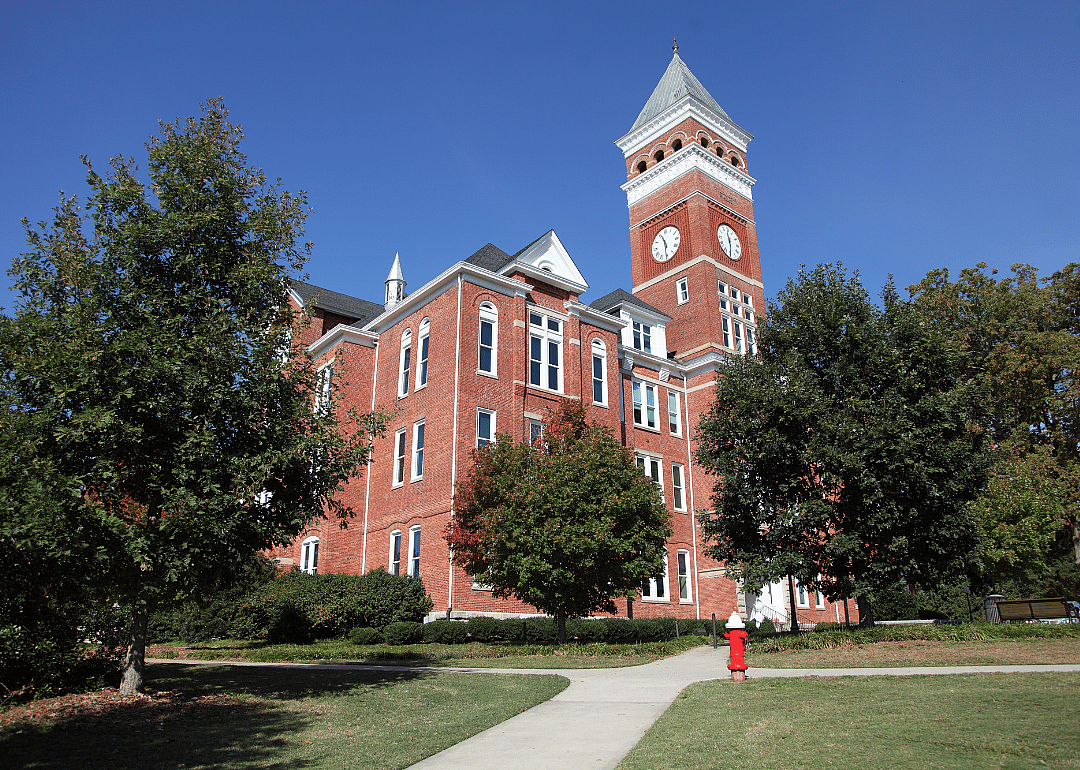
Canva
5 / 20- Bridges in poor condition: 6.6% (19 of 289 bridges)
- Square meters of bridges in poor condition: 8.0% (7,198 of 89,774 square meters of bridges)
You may also like: Cities with the most UFO sightings in South Carolina
Canva
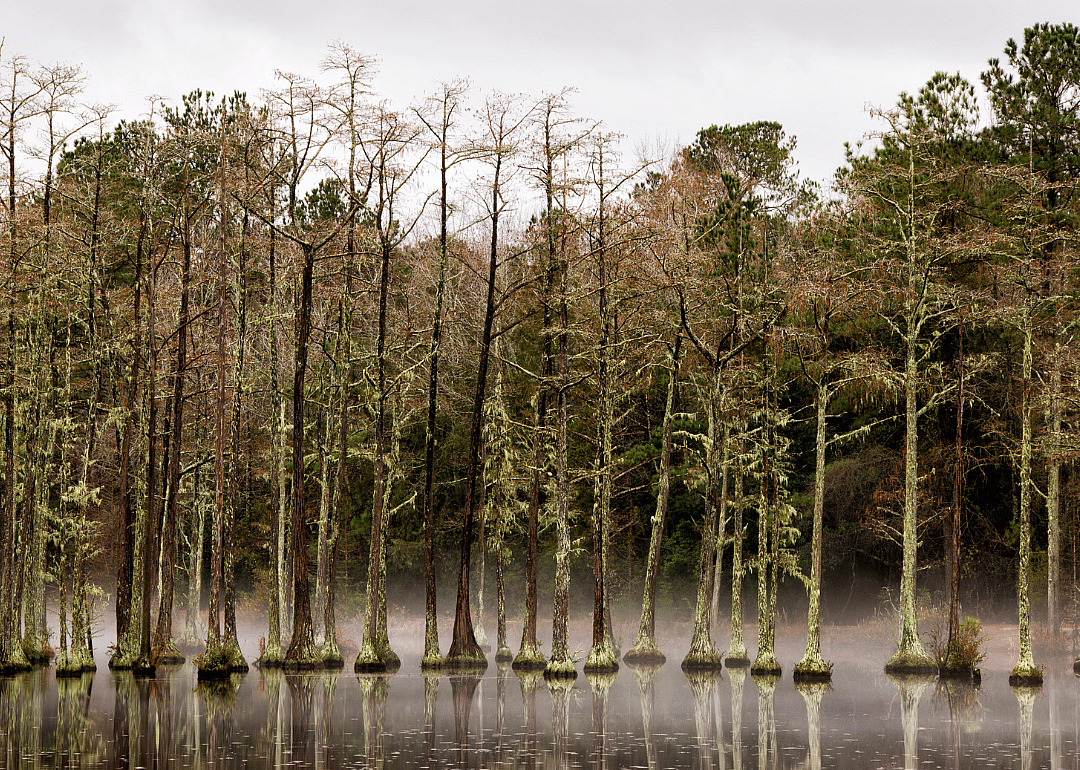
6 / 20- Bridges in poor condition: 6.9% (12 of 174 bridges)
- Square meters of bridges in poor condition: 24.3% (28,278 of 116,580 square meters of bridges)

Canva
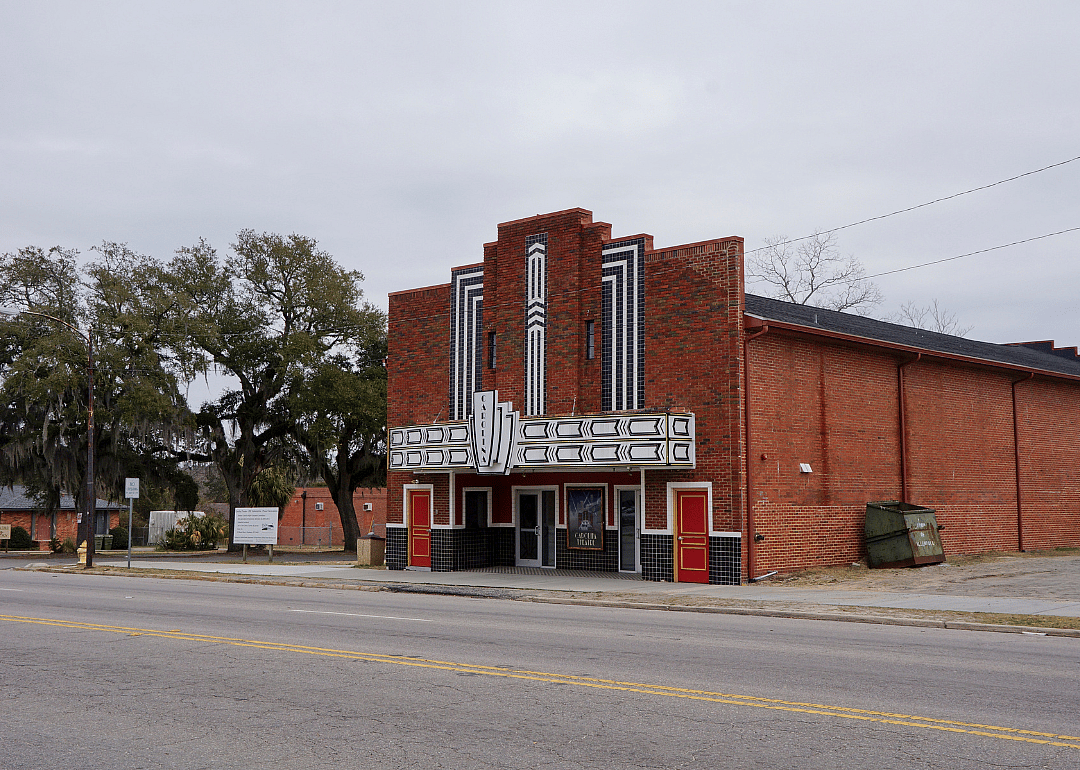
7 / 20- Bridges in poor condition: 7.1% (45 of 632 bridges)
- Square meters of bridges in poor condition: 11.0% (44,401 of 402,089 square meters of bridges)
Bennekom // Shutterstock
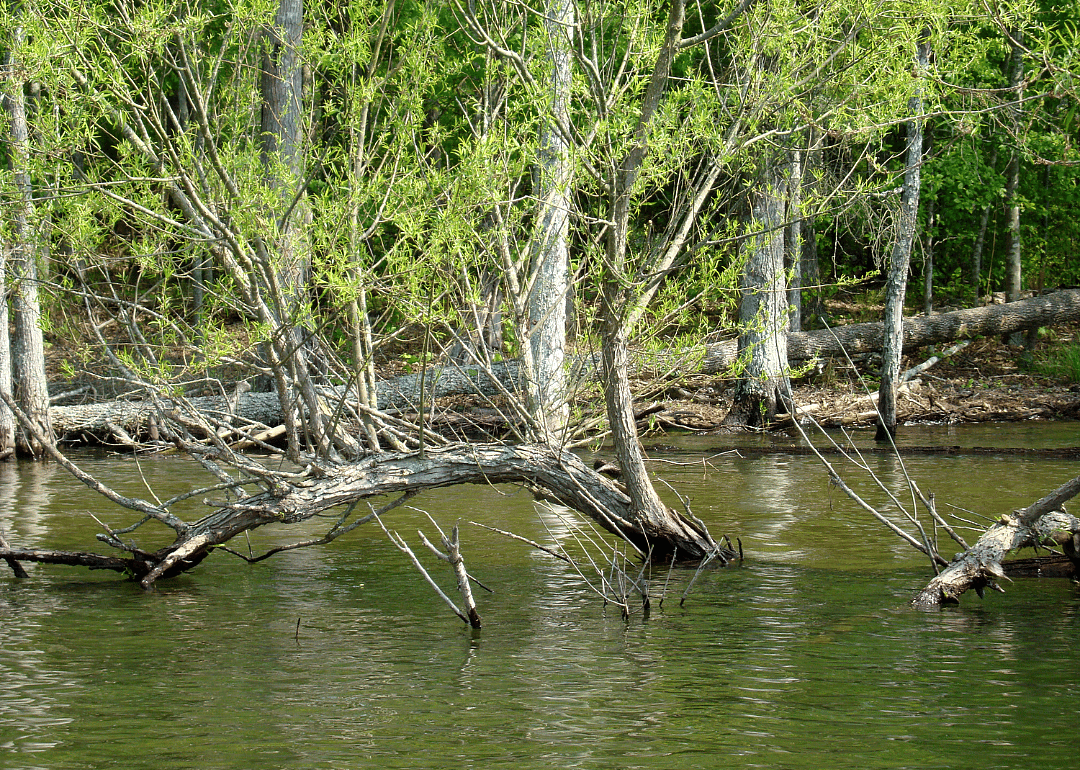
8 / 20- Bridges in poor condition: 7.2% (5 of 69 bridges)
- Square meters of bridges in poor condition: 3.6% (848 of 23,780 square meters of bridges)
Canva
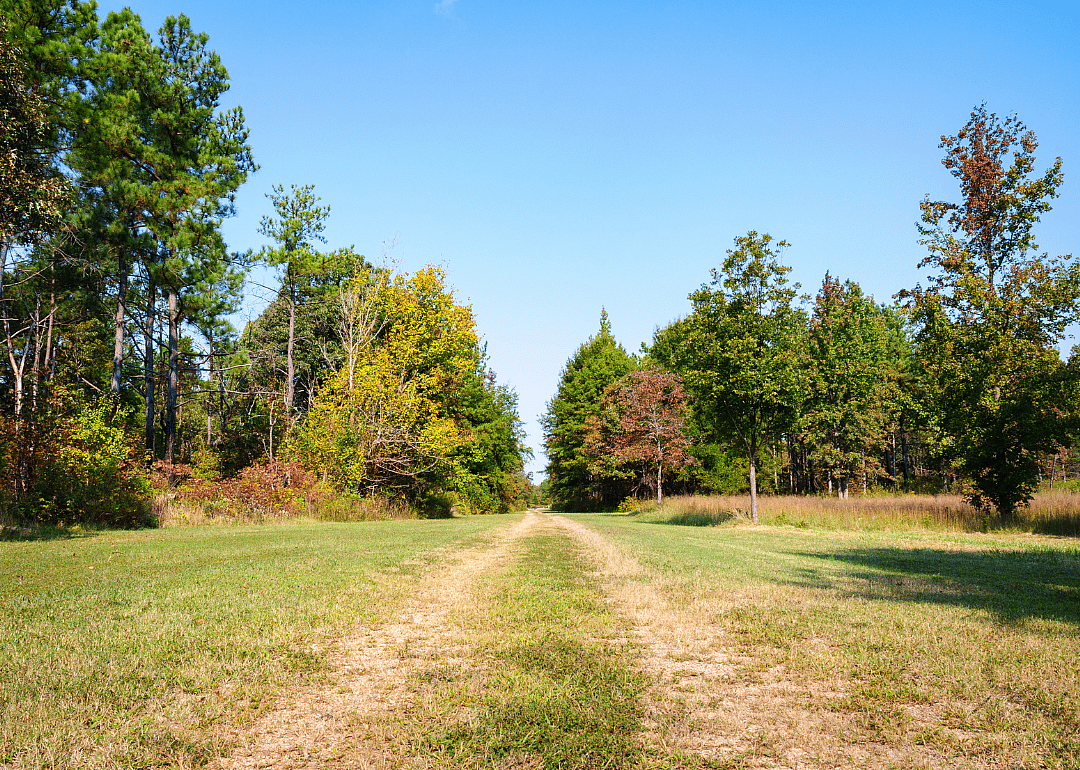
9 / 20- Bridges in poor condition: 7.3% (9 of 124 bridges)
- Square meters of bridges in poor condition: 4.7% (1,865 of 39,337 square meters of bridges)
Canva
10 / 20- Bridges in poor condition: 7.7% (15 of 194 bridges)
- Square meters of bridges in poor condition: 4.4% (4,447 of 102,024 square meters of bridges)
You may also like: See the most extreme temperatures in South Carolina history
Canva
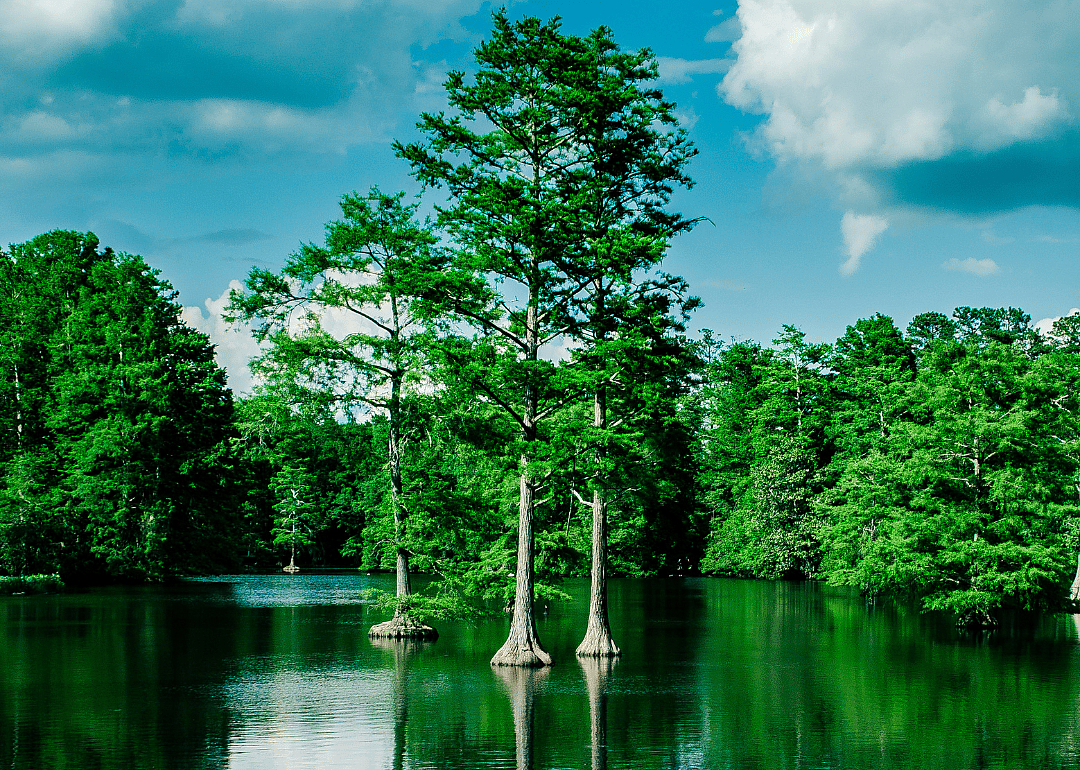
11 / 20- Bridges in poor condition: 7.8% (13 of 167 bridges)
- Square meters of bridges in poor condition: 15.4% (16,997 of 110,702 square meters of bridges)
Canva
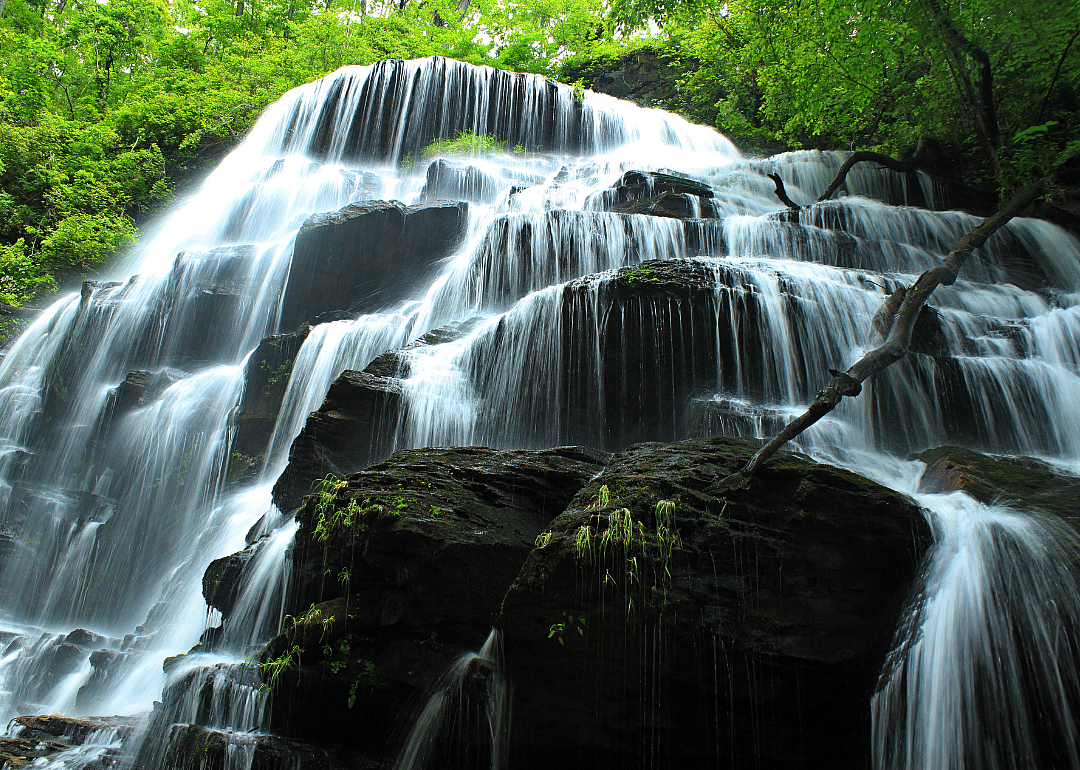
12 / 20- Bridges in poor condition: 7.9% (17 of 214 bridges)
- Square meters of bridges in poor condition: 8.2% (8,646 of 105,594 square meters of bridges)
Canva
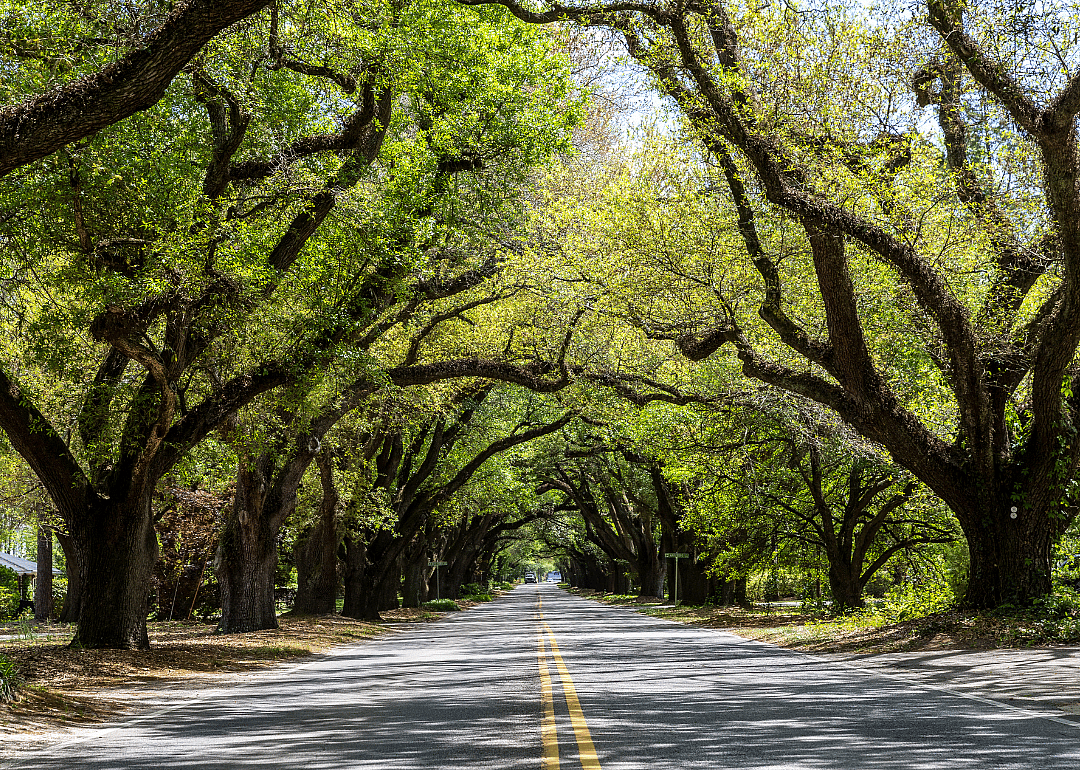
13 / 20- Bridges in poor condition: 8.6% (17 of 198 bridges)
- Square meters of bridges in poor condition: 5.5% (9,182 of 167,592 square meters of bridges)
Canva
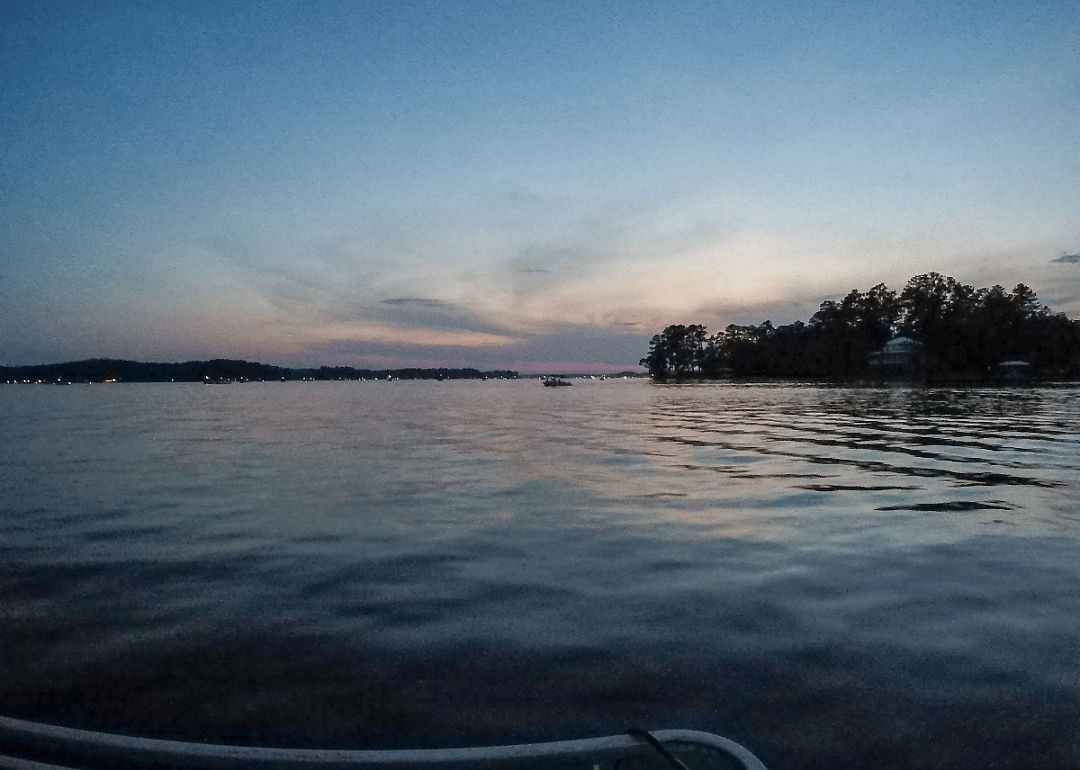
14 / 20- Bridges in poor condition: 9.0% (12 of 134 bridges)
- Square meters of bridges in poor condition: 6.8% (4,806 of 70,643 square meters of bridges)

Canva
15 / 20- Bridges in poor condition: 9.3% (12 of 129 bridges)
- Square meters of bridges in poor condition: 12.4% (7,192 of 57,860 square meters of bridges)
You may also like: Best private colleges in South Carolina
Canva
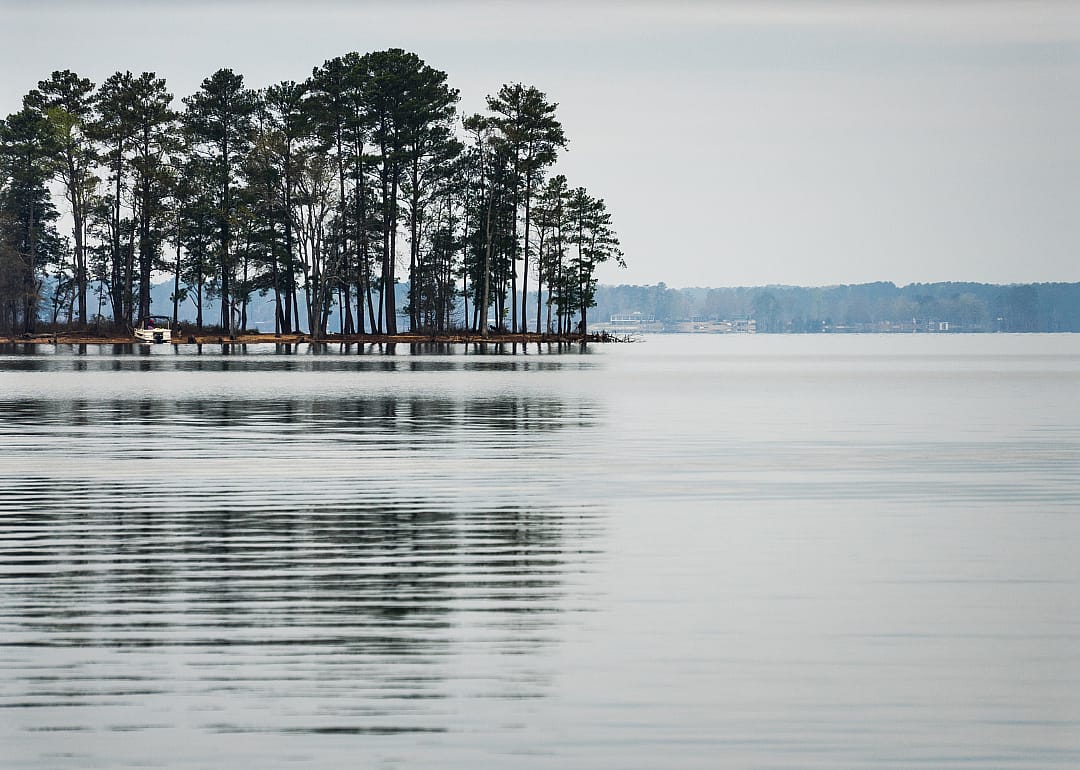
16 / 20- Bridges in poor condition: 10.2% (22 of 215 bridges)
- Square meters of bridges in poor condition: 7.4% (7,236 of 97,629 square meters of bridges)
Nolichuckyjake // Shutterstock
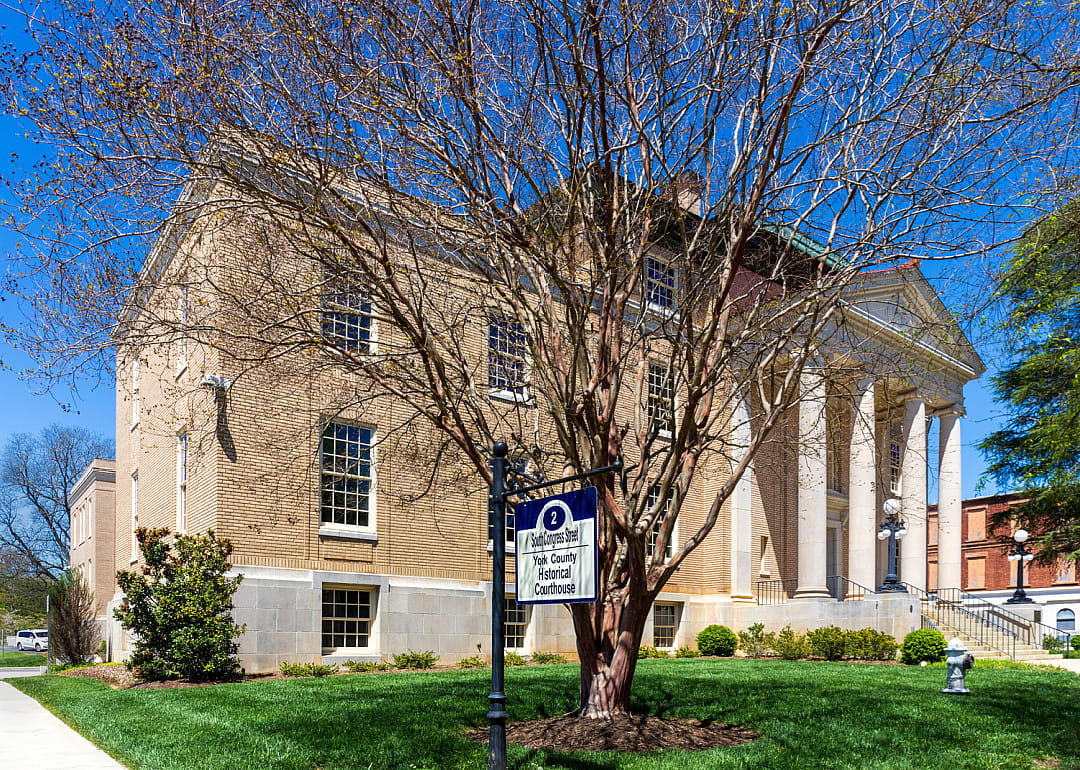
17 / 20- Bridges in poor condition: 10.3% (29 of 282 bridges)
- Square meters of bridges in poor condition: 8.7% (15,854 of 182,330 square meters of bridges)
Canva
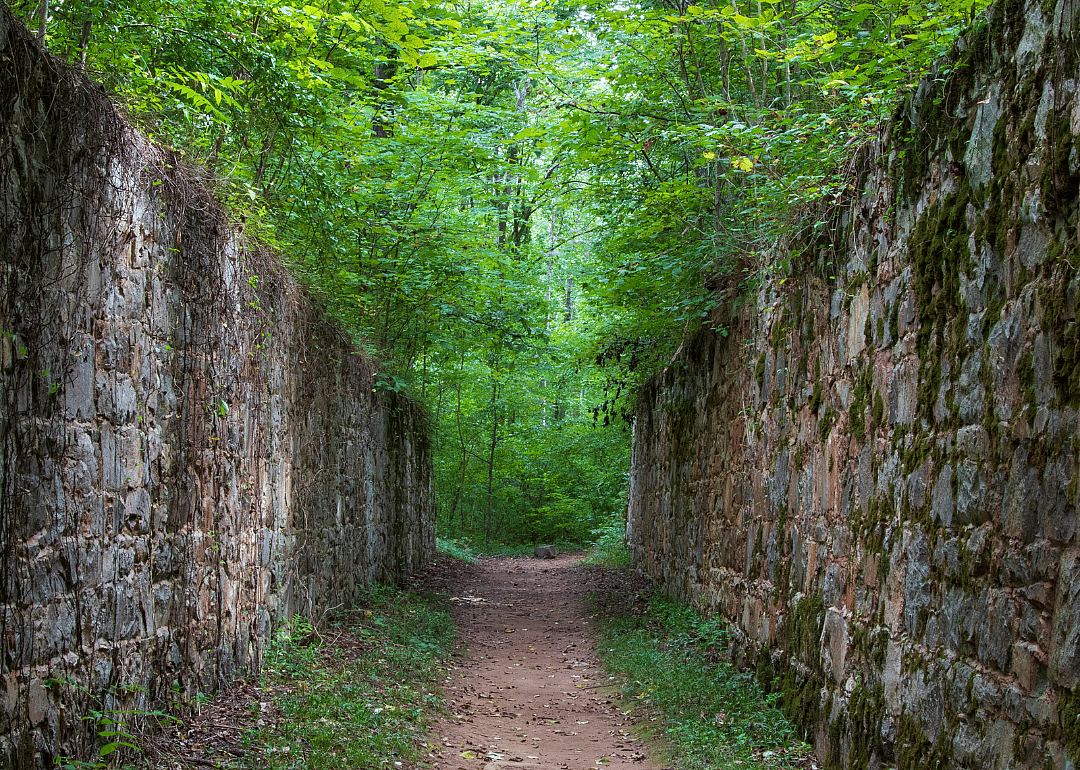
18 / 20- Bridges in poor condition: 11.2% (20 of 179 bridges)
- Square meters of bridges in poor condition: 5.8% (5,692 of 98,737 square meters of bridges)

Canva
19 / 20- Bridges in poor condition: 11.7% (22 of 188 bridges)
- Square meters of bridges in poor condition: 7.7% (7,868 of 102,583 square meters of bridges)
SevenMaps // Shutterstock
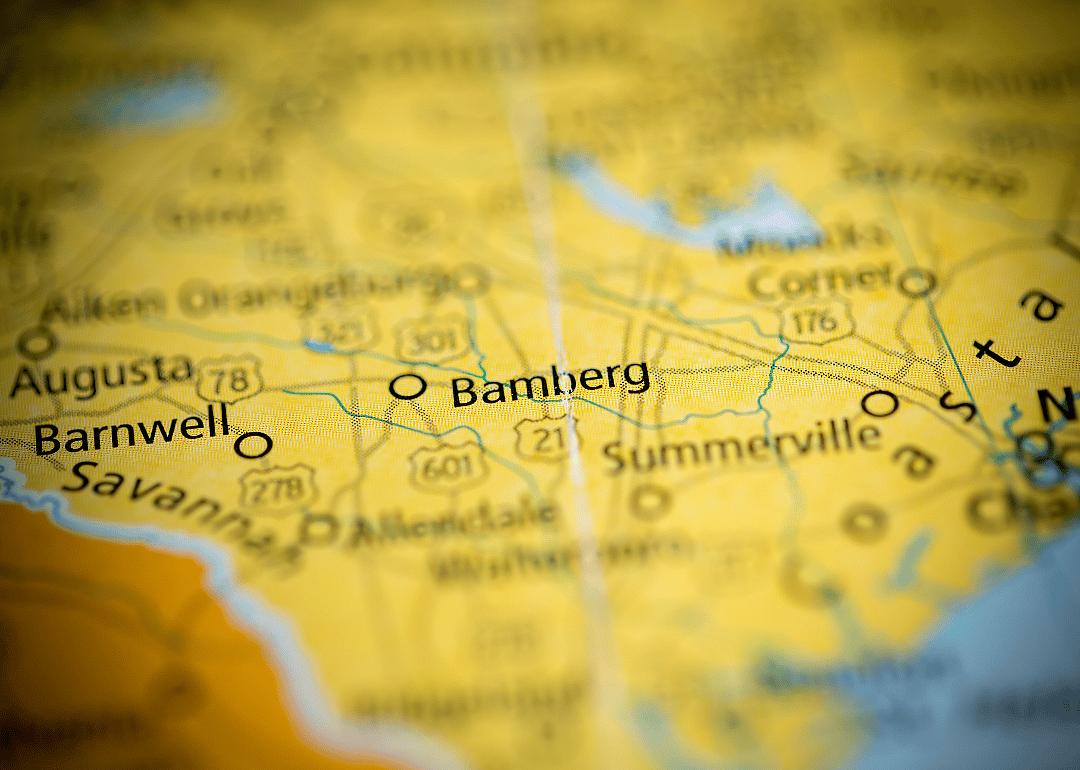
20 / 20- Bridges in poor condition: 12.9% (11 of 85 bridges)
- Square meters of bridges in poor condition: 19.4% (6,873 of 35,426 square meters of bridges)
You may also like: Countries from which South Carolina imports the most goods