Rain, sleet, snow, hail, wintry mix. Precipitation takes on many forms, and the degree to which climate change affects precipitation levels comes down to something almost everyone learns about in school—Earth's water cycle. A system in endless motion, the water cycle traces the process through which water exists in its three primary phases—liquid, solid, and gas—as it moves perpetually between the Earth and its atmosphere.
Increases in precipitation frequency and intensity are markers of climate change. When temperatures rise and oceans grow warmer, the amount of water that evaporates into the atmosphere—and the speed at which it does so—also increases. As atmospheric circulation carries the moisture-rich air over land or pushes it into a storm system, heavy rain or snow is often the result.
The continental U.S. on average received about 30 inches of precipitation between March 2022 and February 2023. Traditionally "wet" regions—such as Washington state and Alaska in the northwest and Georgia and Mississippi in the southeast—continue to have some of the rainiest counties in the United States. Other areas such as Oklahoma, Kansas, and Nebraska, as well as pockets of the South and of California, experience the opposite extreme: drought, also largely a product of climate change.
Stacker cited data from the National Centers for Environmental Information to identify the counties in South Carolina that receive the most precipitation through rain, sleet, or snow. Counties are ranked by five-year precipitation averages in inches as of February 2023 with rainfall over the past year serving as a tiebreaker. Supplementary data on how last year's precipitation compares to the 100-year average for the area is also included.
You may also like: Counties with the oldest homes in South Carolina
#46. Lancaster County
- Five-year precipitation average: 45.81 inches
- Precipitation over the past year: 45.31 inches (#70 rainiest year since 1895)
- Precipitation compared to 1901-2000 average: -0.28 inches below norm
#45. Kershaw County
- Five-year precipitation average: 46.06 inches
- Precipitation over the past year: 43.07 inches (#50 rainiest year since 1895)
- Precipitation compared to 1901-2000 average: -2.82 inches below norm
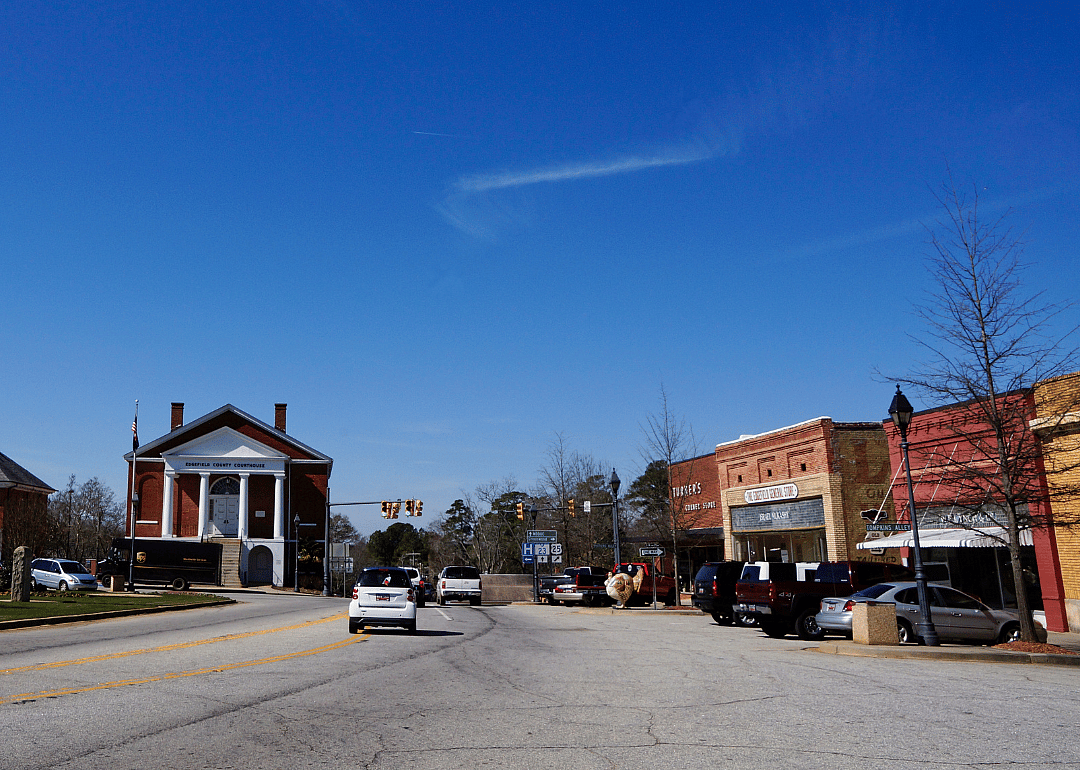
#44. Fairfield County
- Five-year precipitation average: 46.74 inches
- Precipitation over the past year: 46.34 inches (#79 rainiest year since 1895)
- Precipitation compared to 1901-2000 average: 0.75 inches above norm
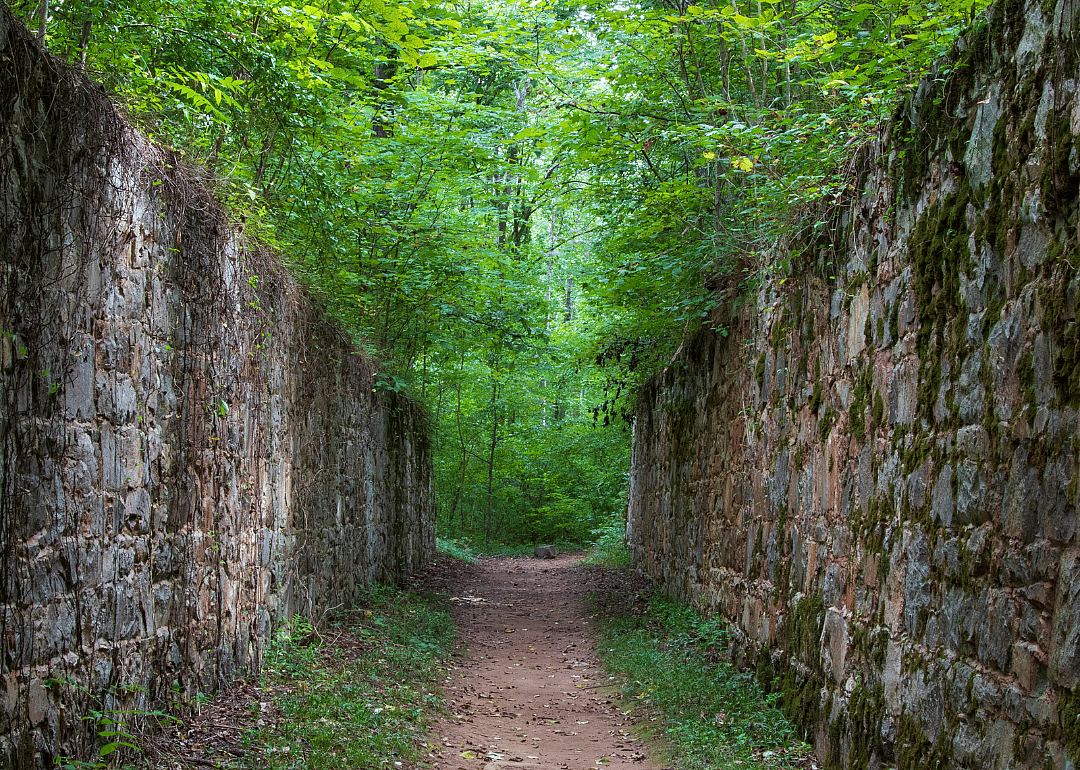
Nolichuckyjake // Shutterstock
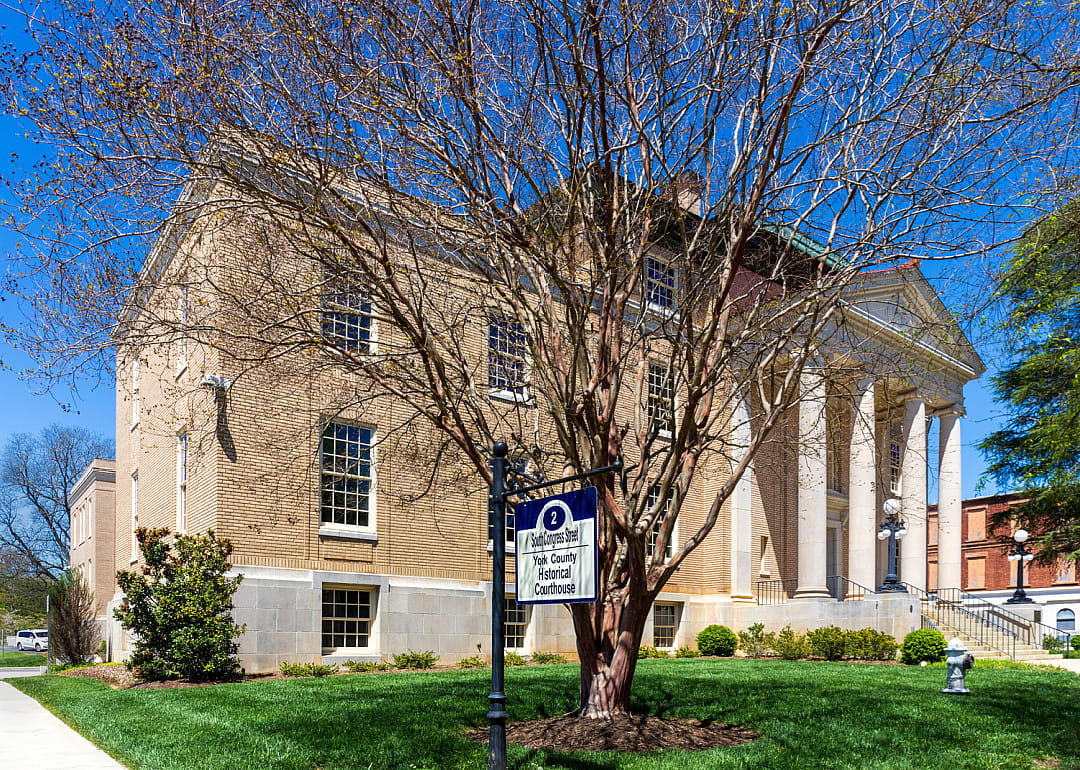
4 / 46#43. York County
- Five-year precipitation average: 47.11 inches
- Precipitation over the past year: 44.32 inches (#44 rainiest year since 1895)
- Precipitation compared to 1901-2000 average: -2.62 inches below norm
#42. Chester County
- Five-year precipitation average: 47.41 inches
- Precipitation over the past year: 45.33 inches (#62 rainiest year since 1895)
- Precipitation compared to 1901-2000 average: -0.85 inches below norm
You may also like: Counties with the coldest winters in South Carolina
#41. Cherokee County
- Five-year precipitation average: 48.28 inches
- Precipitation over the past year: 47.50 inches (#55 rainiest year since 1895)
- Precipitation compared to 1901-2000 average: -1.56 inches below norm
#40. Richland County
- Five-year precipitation average: 48.86 inches
- Precipitation over the past year: 47.55 inches (#85 rainiest year since 1895)
- Precipitation compared to 1901-2000 average: 2.15 inches above norm
#39. Beaufort County
- Five-year precipitation average: 49.00 inches
- Precipitation over the past year: 44.97 inches (#49 rainiest year since 1895)
- Precipitation compared to 1901-2000 average: -3.22 inches below norm
#38. Jasper County
- Five-year precipitation average: 49.46 inches
- Precipitation over the past year: 43.98 inches (#35 rainiest year since 1895)
- Precipitation compared to 1901-2000 average: -4.34 inches below norm
#36. Lexington County
- Five-year precipitation average: 50.06 inches
- Precipitation over the past year: 46.52 inches (#78 rainiest year since 1895)
- Precipitation compared to 1901-2000 average: 0.76 inches above norm
Bennekom // Shutterstock
12 / 46#35. Edgefield County
- Five-year precipitation average: 50.07 inches
- Precipitation over the past year: 45.79 inches (#72 rainiest year since 1895)
- Precipitation compared to 1901-2000 average: -0.09 inches below norm
#34. Newberry County
- Five-year precipitation average: 50.37 inches
- Precipitation over the past year: 49.04 inches (#89 rainiest year since 1895)
- Precipitation compared to 1901-2000 average: 2.96 inches above norm
#33. McCormick County
- Five-year precipitation average: 50.47 inches
- Precipitation over the past year: 45.85 inches (#69 rainiest year since 1895)
- Precipitation compared to 1901-2000 average: -0.92 inches below norm
Malachi Jacobs // Shutterstock
15 / 46#32. Calhoun County
- Five-year precipitation average: 50.48 inches
- Precipitation over the past year: 49.86 inches (#94 rainiest year since 1895)
- Precipitation compared to 1901-2000 average: 3.71 inches above norm
You may also like: Coldest Novembers in South Carolina since 1895
#31. Laurens County
- Five-year precipitation average: 50.54 inches
- Precipitation over the past year: 48.23 inches (#71 rainiest year since 1895)
- Precipitation compared to 1901-2000 average: 0.21 inches above norm
#30. Saluda County
- Five-year precipitation average: 50.60 inches
- Precipitation over the past year: 50.34 inches (#95 rainiest year since 1895)
- Precipitation compared to 1901-2000 average: 4.23 inches above norm
James R Poston // Shutterstock
18 / 46#29. Orangeburg County
- Five-year precipitation average: 50.84 inches
- Precipitation over the past year: 51.65 inches (#100 rainiest year since 1895)
- Precipitation compared to 1901-2000 average: 4.91 inches above norm
#28. Dorchester County
- Five-year precipitation average: 51.05 inches
- Precipitation over the past year: 50.26 inches (#90 rainiest year since 1895)
- Precipitation compared to 1901-2000 average: 2.51 inches above norm
#26. Greenwood County
- Five-year precipitation average: 51.11 inches
- Precipitation over the past year: 47.57 inches (#77 rainiest year since 1895)
- Precipitation compared to 1901-2000 average: 0.54 inches above norm
Wilma Engelhardt Ellis // Shutterstock
22 / 46#25. Marlboro County
- Five-year precipitation average: 51.28 inches
- Precipitation over the past year: 43.92 inches (#53 rainiest year since 1895)
- Precipitation compared to 1901-2000 average: -1.98 inches below norm
#24. Sumter County
- Five-year precipitation average: 51.32 inches
- Precipitation over the past year: 46.55 inches (#72 rainiest year since 1895)
- Precipitation compared to 1901-2000 average: 0.04 inches above norm
#23. Charleston County
- Five-year precipitation average: 51.37 inches
- Precipitation over the past year: 48.95 inches (#74 rainiest year since 1895)
- Precipitation compared to 1901-2000 average: 0.49 inches above norm
Jen Wolf // Shutterstock
25 / 46Chansak Joe // Shutterstock
26 / 46#21. Chesterfield County
- Five-year precipitation average: 51.59 inches
- Precipitation over the past year: 45.91 inches (#69 rainiest year since 1895)
- Precipitation compared to 1901-2000 average: 0.03 inches above norm
SevenMaps // Shutterstock
27 / 46#20. Williamsburg County
- Five-year precipitation average: 51.60 inches
- Precipitation over the past year: 49.10 inches (#68 rainiest year since 1895)
- Precipitation compared to 1901-2000 average: 0.47 inches above norm
#19. Colleton County
- Five-year precipitation average: 51.86 inches
- Precipitation over the past year: 49.50 inches (#80 rainiest year since 1895)
- Precipitation compared to 1901-2000 average: 1.78 inches above norm
#18. Lee County
- Five-year precipitation average: 52.00 inches
- Precipitation over the past year: 45.46 inches (#66 rainiest year since 1895)
- Precipitation compared to 1901-2000 average: -0.90 inches below norm
Bennekom // Shutterstock
30 / 46#17. Allendale County
- Five-year precipitation average: 52.02 inches
- Precipitation over the past year: 50.02 inches (#92 rainiest year since 1895)
- Precipitation compared to 1901-2000 average: 3.56 inches above norm
You may also like: Coldest Octobers in South Carolina since 1895
#16. Clarendon County
- Five-year precipitation average: 52.09 inches
- Precipitation over the past year: 49.16 inches (#83 rainiest year since 1895)
- Precipitation compared to 1901-2000 average: 1.33 inches above norm
#15. Aiken County
- Five-year precipitation average: 52.51 inches
- Precipitation over the past year: 48.30 inches (#87 rainiest year since 1895)
- Precipitation compared to 1901-2000 average: 2.69 inches above norm
Kristi Blokhin // Shutterstock
33 / 46#14. Dillon County
- Five-year precipitation average: 52.73 inches
- Precipitation over the past year: 42.36 inches (#44 rainiest year since 1895)
- Precipitation compared to 1901-2000 average: -3.42 inches below norm
#13. Anderson County
- Five-year precipitation average: 52.92 inches
- Precipitation over the past year: 46.41 inches (#49 rainiest year since 1895)
- Precipitation compared to 1901-2000 average: -2.67 inches below norm
SevenMaps // Shutterstock
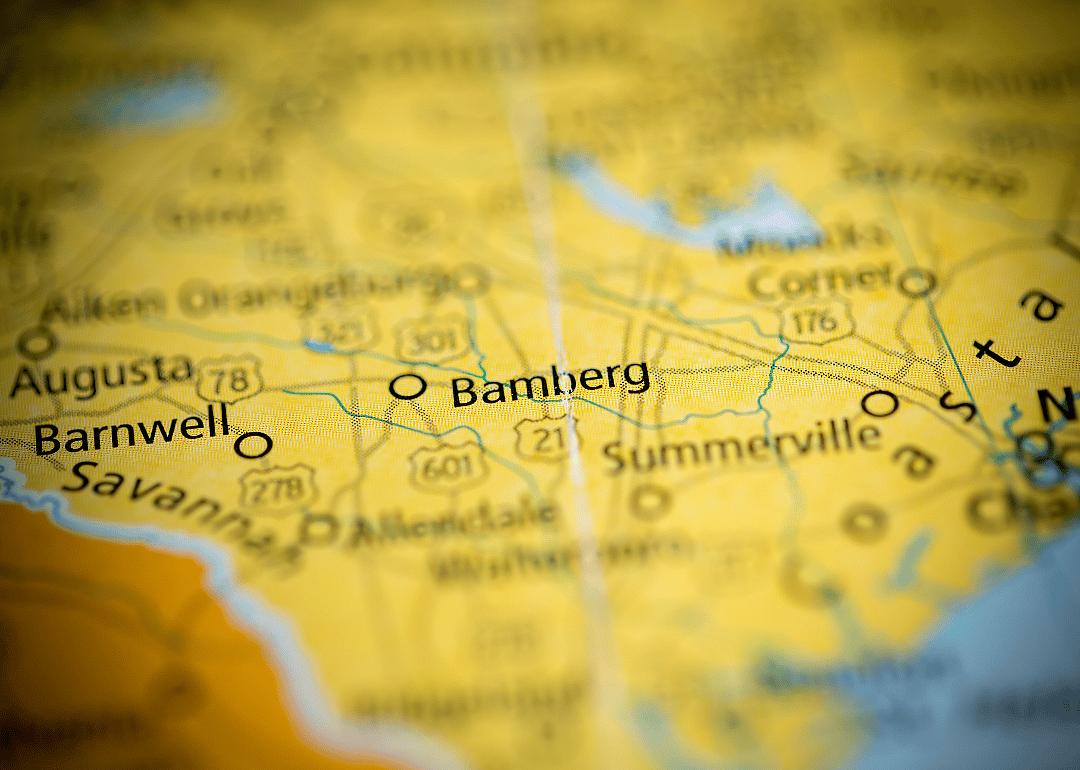
35 / 46#12. Bamberg County
- Five-year precipitation average: 52.93 inches
- Precipitation over the past year: 55.14 inches (#114 rainiest year since 1895)
- Precipitation compared to 1901-2000 average: 8.43 inches above norm
You may also like: Best counties to retire to in South Carolina
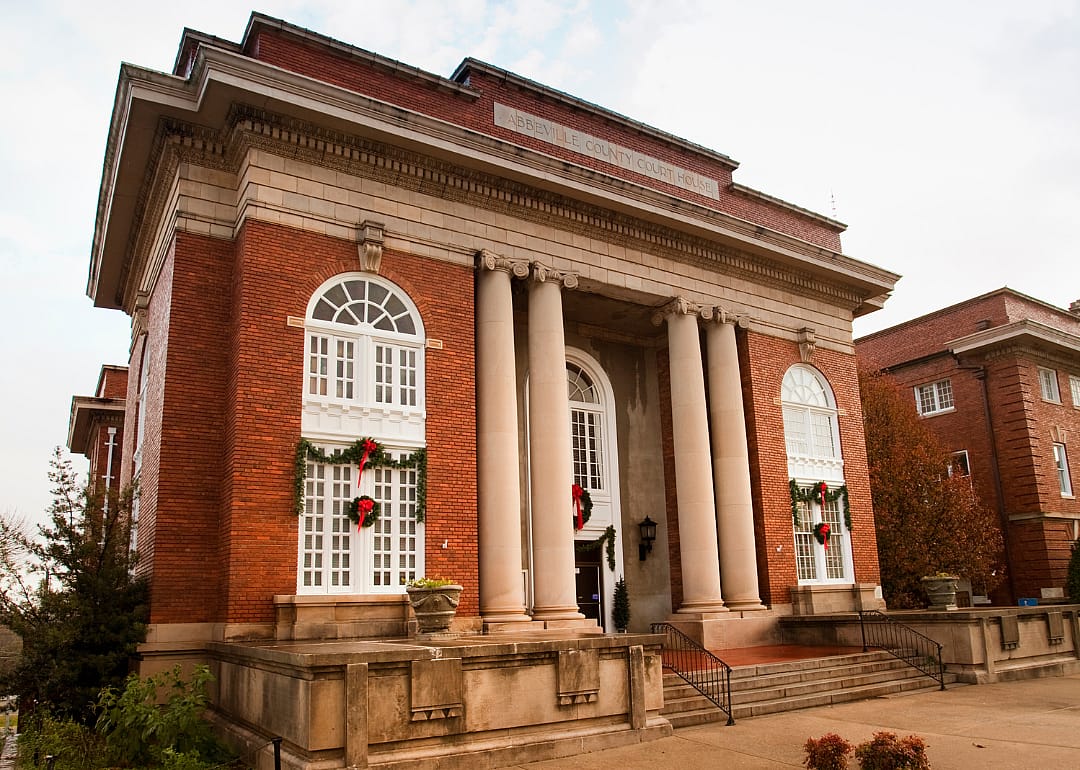
#11. Abbeville County
- Five-year precipitation average: 53.04 inches
- Precipitation over the past year: 49.33 inches (#80 rainiest year since 1895)
- Precipitation compared to 1901-2000 average: 1.27 inches above norm
#10. Florence County
- Five-year precipitation average: 53.11 inches
- Precipitation over the past year: 48.03 inches (#78 rainiest year since 1895)
- Precipitation compared to 1901-2000 average: 0.94 inches above norm
C Dash // Shutterstock
38 / 46#9. Barnwell County
- Five-year precipitation average: 53.53 inches
- Precipitation over the past year: 53.40 inches (#109 rainiest year since 1895)
- Precipitation compared to 1901-2000 average: 7.16 inches above norm
Jared Freye // Shutterstock
39 / 46#8. Darlington County
- Five-year precipitation average: 53.54 inches
- Precipitation over the past year: 46.21 inches (#70 rainiest year since 1895)
- Precipitation compared to 1901-2000 average: 0.39 inches above norm
#6. Spartanburg County
- Five-year precipitation average: 54.80 inches
- Precipitation over the past year: 51.25 inches (#70 rainiest year since 1895)
- Precipitation compared to 1901-2000 average: -0.14 inches below norm
Brian Nolan // Shutterstock
42 / 46#5. Marion County
- Five-year precipitation average: 55.01 inches
- Precipitation over the past year: 46.82 inches (#70 rainiest year since 1895)
- Precipitation compared to 1901-2000 average: -0.48 inches below norm
#4. Horry County
- Five-year precipitation average: 56.19 inches
- Precipitation over the past year: 48.20 inches (#59 rainiest year since 1895)
- Precipitation compared to 1901-2000 average: -0.60 inches below norm
#3. Greenville County
- Five-year precipitation average: 60.86 inches
- Precipitation over the past year: 54.02 inches (#58 rainiest year since 1895)
- Precipitation compared to 1901-2000 average: -1.81 inches below norm
#1. Oconee County
- Five-year precipitation average: 67.93 inches
- Precipitation over the past year: 60.13 inches (#62 rainiest year since 1895)
- Precipitation compared to 1901-2000 average: -0.90 inches below norm