Several factors contribute to cancer rates, from personal habits and genetics to air pollution or groundwater quality in a given area. People experiencing social, economic, or environmental disadvantages are disproportionately affected by high cancer rates in certain regions—including access or barriers to early screening and care.
Cancer rates also fluctuate by jobs: Higher rates of cancer can be found among meat industry and rubber manufacturing workers, and farmers.
Stacker compiled the counties with the highest cancer rates in South Dakota using data from the CDC. Keep reading to see where in your state cancer cases are the most common.
You may also like: Easy as pie: See the most uniquely popular pie in South Dakota
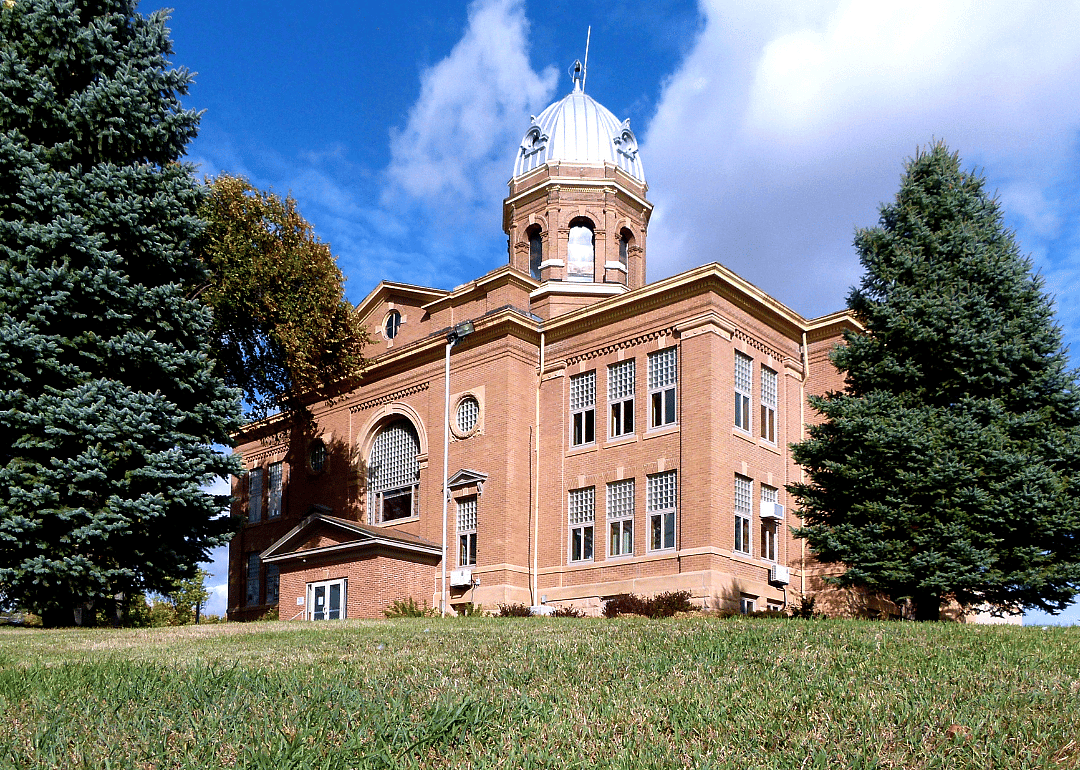
#50. Mellette County
- Cancer rate per 100,000, 2016-2020: 493.9
- Age-adjusted rate per 100,000, 2016-2020: 454.9
#49. Roberts County
- Cancer rate per 100,000, 2016-2020: 500.5
- Age-adjusted rate per 100,000, 2016-2020: 379.1
Michael J Magee // Shutterstock
3 / 50#48. Sully County
- Cancer rate per 100,000, 2016-2020: 518.0
- Age-adjusted rate per 100,000, 2016-2020: 377.8
#47. Lyman County
- Cancer rate per 100,000, 2016-2020: 522.1
- Age-adjusted rate per 100,000, 2016-2020: 410.4
Jacob Boomsma // Shutterstock
5 / 50Jacob Boomsma // Shutterstock
6 / 50#45. Moody County
- Cancer rate per 100,000, 2016-2020: 547.0
- Age-adjusted rate per 100,000, 2016-2020: 404.8
Jacob Boomsma // Shutterstock
7 / 50#44. Hamlin County
- Cancer rate per 100,000, 2016-2020: 547.2
- Age-adjusted rate per 100,000, 2016-2020: 474.8
#43. Pennington County
- Cancer rate per 100,000, 2016-2020: 551.4
- Age-adjusted rate per 100,000, 2016-2020: 430.6
Steven Frame // Shutterstock
9 / 50#42. Minnehaha County
- Cancer rate per 100,000, 2016-2020: 554.9
- Age-adjusted rate per 100,000, 2016-2020: 535.9
#40. Beadle County
- Cancer rate per 100,000, 2016-2020: 570.4
- Age-adjusted rate per 100,000, 2016-2020: 445.9
#39. Butte County
- Cancer rate per 100,000, 2016-2020: 571.2
- Age-adjusted rate per 100,000, 2016-2020: 401.5
#38. Lake County
- Cancer rate per 100,000, 2016-2020: 577.4
- Age-adjusted rate per 100,000, 2016-2020: 397.2
Jacob Boomsma // Shutterstock
14 / 50#37. Brown County
- Cancer rate per 100,000, 2016-2020: 585.8
- Age-adjusted rate per 100,000, 2016-2020: 473.1
SevenMaps // Shutterstock
15 / 50Bennekom // Shutterstock
16 / 50#35. Bon Homme County
- Cancer rate per 100,000, 2016-2020: 590.1
- Age-adjusted rate per 100,000, 2016-2020: 413.9
#34. Charles Mix County
- Cancer rate per 100,000, 2016-2020: 594.1
- Age-adjusted rate per 100,000, 2016-2020: 459.7
#33. Yankton County
- Cancer rate per 100,000, 2016-2020: 597.0
- Age-adjusted rate per 100,000, 2016-2020: 438.7
#32. Walworth County
- Cancer rate per 100,000, 2016-2020: 615.0
- Age-adjusted rate per 100,000, 2016-2020: 401.0
#30. Codington County
- Cancer rate per 100,000, 2016-2020: 632.7
- Age-adjusted rate per 100,000, 2016-2020: 479.0
J K Laws // Shutterstock
22 / 50#29. Davison County
- Cancer rate per 100,000, 2016-2020: 635.5
- Age-adjusted rate per 100,000, 2016-2020: 487.3
Jacob Boomsma // Shutterstock
23 / 50#28. Turner County
- Cancer rate per 100,000, 2016-2020: 641.5
- Age-adjusted rate per 100,000, 2016-2020: 451.8
#27. Stanley County
- Cancer rate per 100,000, 2016-2020: 660.6
- Age-adjusted rate per 100,000, 2016-2020: 462.8
SevenMaps // Shutterstock
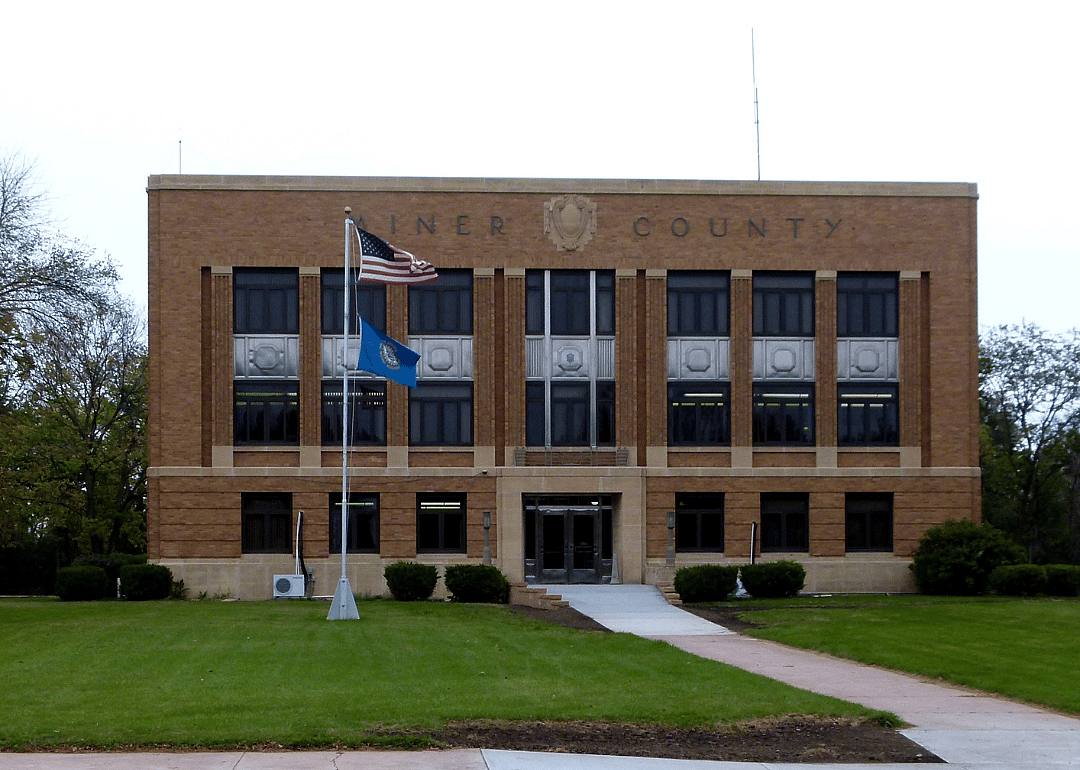
25 / 50#25. Miner County
- Cancer rate per 100,000, 2016-2020: 668.7
- Age-adjusted rate per 100,000, 2016-2020: 472.1
#24. Brule County
- Cancer rate per 100,000, 2016-2020: 676.5
- Age-adjusted rate per 100,000, 2016-2020: 517.1
#23. Custer County
- Cancer rate per 100,000, 2016-2020: 677.6
- Age-adjusted rate per 100,000, 2016-2020: 344.1
SevenMaps // Shutterstock
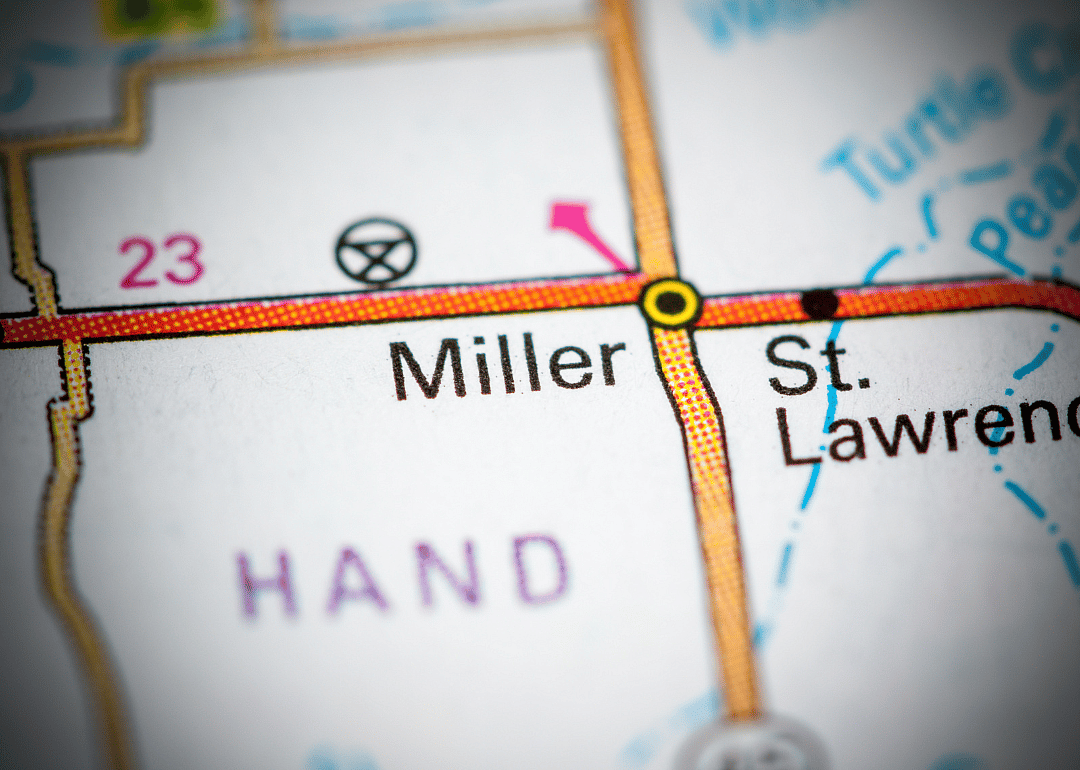
29 / 50#22. Hand County
- Cancer rate per 100,000, 2016-2020: 677.9
- Age-adjusted rate per 100,000, 2016-2020: 433.1
Jacob Boomsma // Shutterstock
30 / 50Sabrina Janelle Gordon // Shutterstock
31 / 50#20. Union County
- Cancer rate per 100,000, 2016-2020: 685.9
- Age-adjusted rate per 100,000, 2016-2020: 528.1
#19. Sanborn County
- Cancer rate per 100,000, 2016-2020: 691.3
- Age-adjusted rate per 100,000, 2016-2020: 497.1
Jacob Boomsma // Shutterstock
33 / 50#18. Spink County
- Cancer rate per 100,000, 2016-2020: 695.9
- Age-adjusted rate per 100,000, 2016-2020: 470.8
#17. Grant County
- Cancer rate per 100,000, 2016-2020: 701.7
- Age-adjusted rate per 100,000, 2016-2020: 458.3
Jacob Boomsma // Shutterstock
35 / 50Jacob Boomsma // Shutterstock
36 / 50#15. Jerauld County
- Cancer rate per 100,000, 2016-2020: 726.9
- Age-adjusted rate per 100,000, 2016-2020: 434.4
Danita Delimont // Shutterstock
37 / 50#14. Hutchinson County
- Cancer rate per 100,000, 2016-2020: 728.0
- Age-adjusted rate per 100,000, 2016-2020: 486.7
SevenMaps // Shutterstock
38 / 50#13. Edmunds County
- Cancer rate per 100,000, 2016-2020: 732.8
- Age-adjusted rate per 100,000, 2016-2020: 491.6
Patrick Ziegler // Shutterstock
39 / 50#12. McCook County
- Cancer rate per 100,000, 2016-2020: 746.9
- Age-adjusted rate per 100,000, 2016-2020: 558.8
SevenMaps // Shutterstock
40 / 50vagabond54 // Shutterstock
41 / 50#10. Day County
- Cancer rate per 100,000, 2016-2020: 788.7
- Age-adjusted rate per 100,000, 2016-2020: 475.1
SevenMaps // Shutterstock
42 / 50#9. McPherson County
- Cancer rate per 100,000, 2016-2020: 810.2
- Age-adjusted rate per 100,000, 2016-2020: 498.3
SevenMaps // Shutterstock
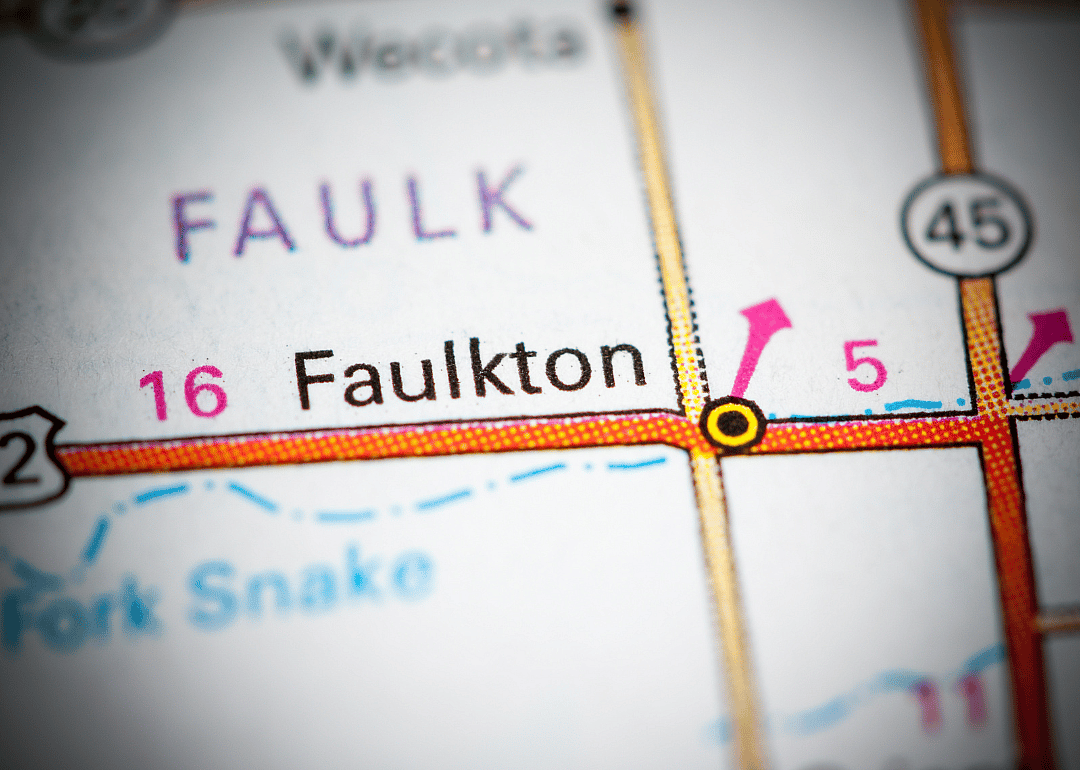
43 / 50#8. Faulk County
- Cancer rate per 100,000, 2016-2020: 812.1
- Age-adjusted rate per 100,000, 2016-2020: 536.5
melissamn // Shutterstock
44 / 50#7. Aurora County
- Cancer rate per 100,000, 2016-2020: 819.7
- Age-adjusted rate per 100,000, 2016-2020: 559.4
#5. Kingsbury County
- Cancer rate per 100,000, 2016-2020: 879.2
- Age-adjusted rate per 100,000, 2016-2020: 538.0
SevenMaps // Shutterstock
47 / 50#4. Hyde County
- Cancer rate per 100,000, 2016-2020: 881.0
- Age-adjusted rate per 100,000, 2016-2020: 483.5
#3. Jones County
- Cancer rate per 100,000, 2016-2020: 887.4
- Age-adjusted rate per 100,000, 2016-2020: 528.5
Jacob Boomsma // Shutterstock
49 / 50#2. Potter County
- Cancer rate per 100,000, 2016-2020: 891.4
- Age-adjusted rate per 100,000, 2016-2020: 554.0